INTRODUCTION
The control of schistosomiasis (Schistosoma haematobium and S. mansoni) and soil-transmitted helminthiasis (STH: Ascaris lumbricoides, Trichuris trichiura and hookworm) has been greatly boosted since the World Health Assembly, in May 2001, resolved to regularly treat at least 75% of school-aged children and other high-risk groups by 2010 (WHO, 2002). In parallel, there has been an increase in political, financial and technical support for helminth control, with a focus on preventive chemotherapy using praziquantel against schistosomiasis and albendazole or mebendazole against STH (Utzinger et al. Reference Utzinger, Bergquist, Xiao, Singer and Tanner2003; WHO, 2006). In particular, school-based programmes have been shown to be a cost-effective approach for controlling schistosomiasis and STH (Partnership for Child Development, 1997; Bundy et al. Reference Bundy, Shaeffer, Jukes, Beegle, Gillespie, Drake, Seung-Hee, Hoffman, Jones, Mitchell, Wright, Barcelona, Camara, Golmar, Savioli, Takeuchi, Sembene, Jamison, Breman, Measham, Alleyne, Claeson, Evans, Jha, Mills and Musgrove2006; Brooker et al. Reference Brooker, Kabatereine, Fleming and Devlin2008). The increase in school participation worldwide as one of the key millennium development goals (MDGs), as well as the specific promotion of school health programmes as part of these efforts, provides an additional strong policy incentive to deliver deworming through school systems. Identifying which schools and communities require treatment is an essential part of any control programme, and a key issue for epidemiological mapping.
For schistosomiasis surveys, recommendations put forth by the World Health Organization (WHO) are based on the random selection of at least 50 individuals within defined ecological zones using the ‘gold’ standard of parasitological diagnosis, namely light microscopy of repeated stool and/or urine examinations to detect and quantify distinctive schistosome eggs (Bergquist, Johansen and Utzinger, Reference Bergquist, Johansen and Utzinger2009; Danso-Appiah et al. 2009, in this special issue). However, the costs of such an approach are high and health systems often lack the necessary equipment, supplies and skilled personnel (Kurowski et al. Reference Kurowski, Wyss, Abdulla and Mills2007). The technical capacity to conduct population-based surveys is also often limited (Mathieu et al. Reference Mathieu, Deming, Lammie, McLaughlin, Beach, Deodat and Addiss2003), necessitating low-cost, simple and rapid alternatives. This operational requirement is also true for a number of other tropical diseases.
In the last five years, there has been an expansion of interest in a range of so-called neglected tropical diseases (NTDs), including lymphatic filariasis, onchocerciasis, trachoma as well as schistosomiasis and STH (Molyneux, Hotez and Fenwick, Reference Molyneux, Hotez and Fenwick2005; Lammie, Fenwick and Utzinger, Reference Lammie, Fenwick and Utzinger2006; Utzinger and de Savigny, Reference Utzinger and de Savigny2006; WHO, 2006; Hotez et al. Reference Hotez, Molyneux, Fenwick, Kumaresan, Ehrlich Sachs, Sachs and Savioli2007). Control of these diseases is mainly through mass drug administration (MDA) with annual or semi-annual doses of safe and efficacious oral treatments. Given the similarity of approaches to implementation, it is suggested that disease-specific programmes can enhance their efficiencies and cost-effectiveness by delivering drugs in a coordinated fashion (WHO, 2006; Hotez et al. Reference Hotez, Molyneux, Fenwick, Kumaresan, Ehrlich Sachs, Sachs and Savioli2007). WHO guidelines for preventive chemotherapy provide a useful framework for countries that are implementing integrated NTD control (WHO, 2006). An important first step is to define the geographical distribution and degree of overlap of different NTDs in order to define treatment strategies (Brady, Hooper and Ottesen, Reference Brady, Hooper and Ottesen2006; Kolaczinski et al. Reference Kolaczinski, Kabatereine, Onapa, Ndyomugyengi, Kakmebo and Brooker2007); simple, cheap and rapid methods of assessment are clearly necessary for initial mapping.
This review examines how a number of scientific approaches can be used to rapidly and effectively map the distribution of schistosomiasis in Africa. We also focus on the operational experience of mapping other NTDs, and on the potential integration of rapid mapping approaches in the implementation of combined NTD control. Finally, we suggest that experiences and expertise gained from the rapid mapping of schistosomiasis and other NTDs may be relevant for rapid assessment of malaria.
IDENTIFYING AREAS OF SCHISTOSOMIASIS RISK
Disease mapping and climate-based risk models
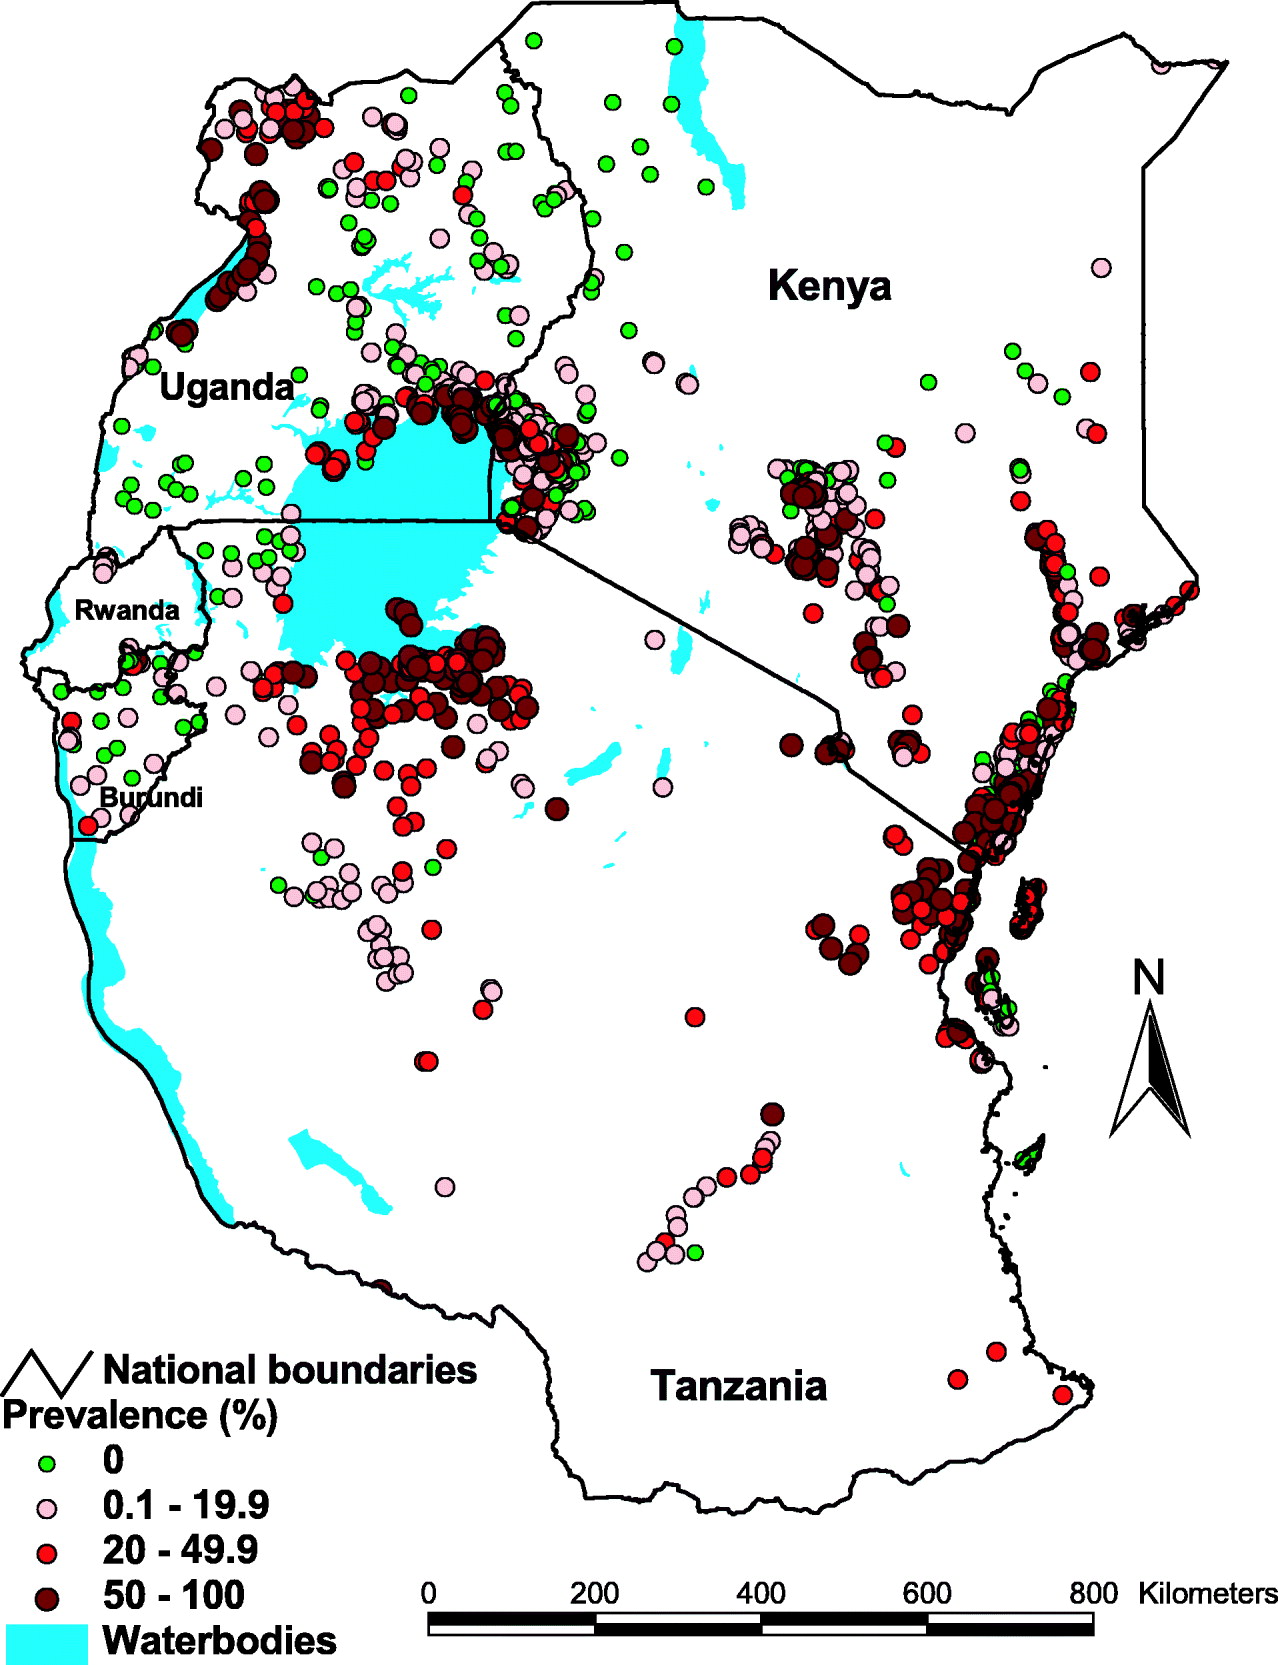
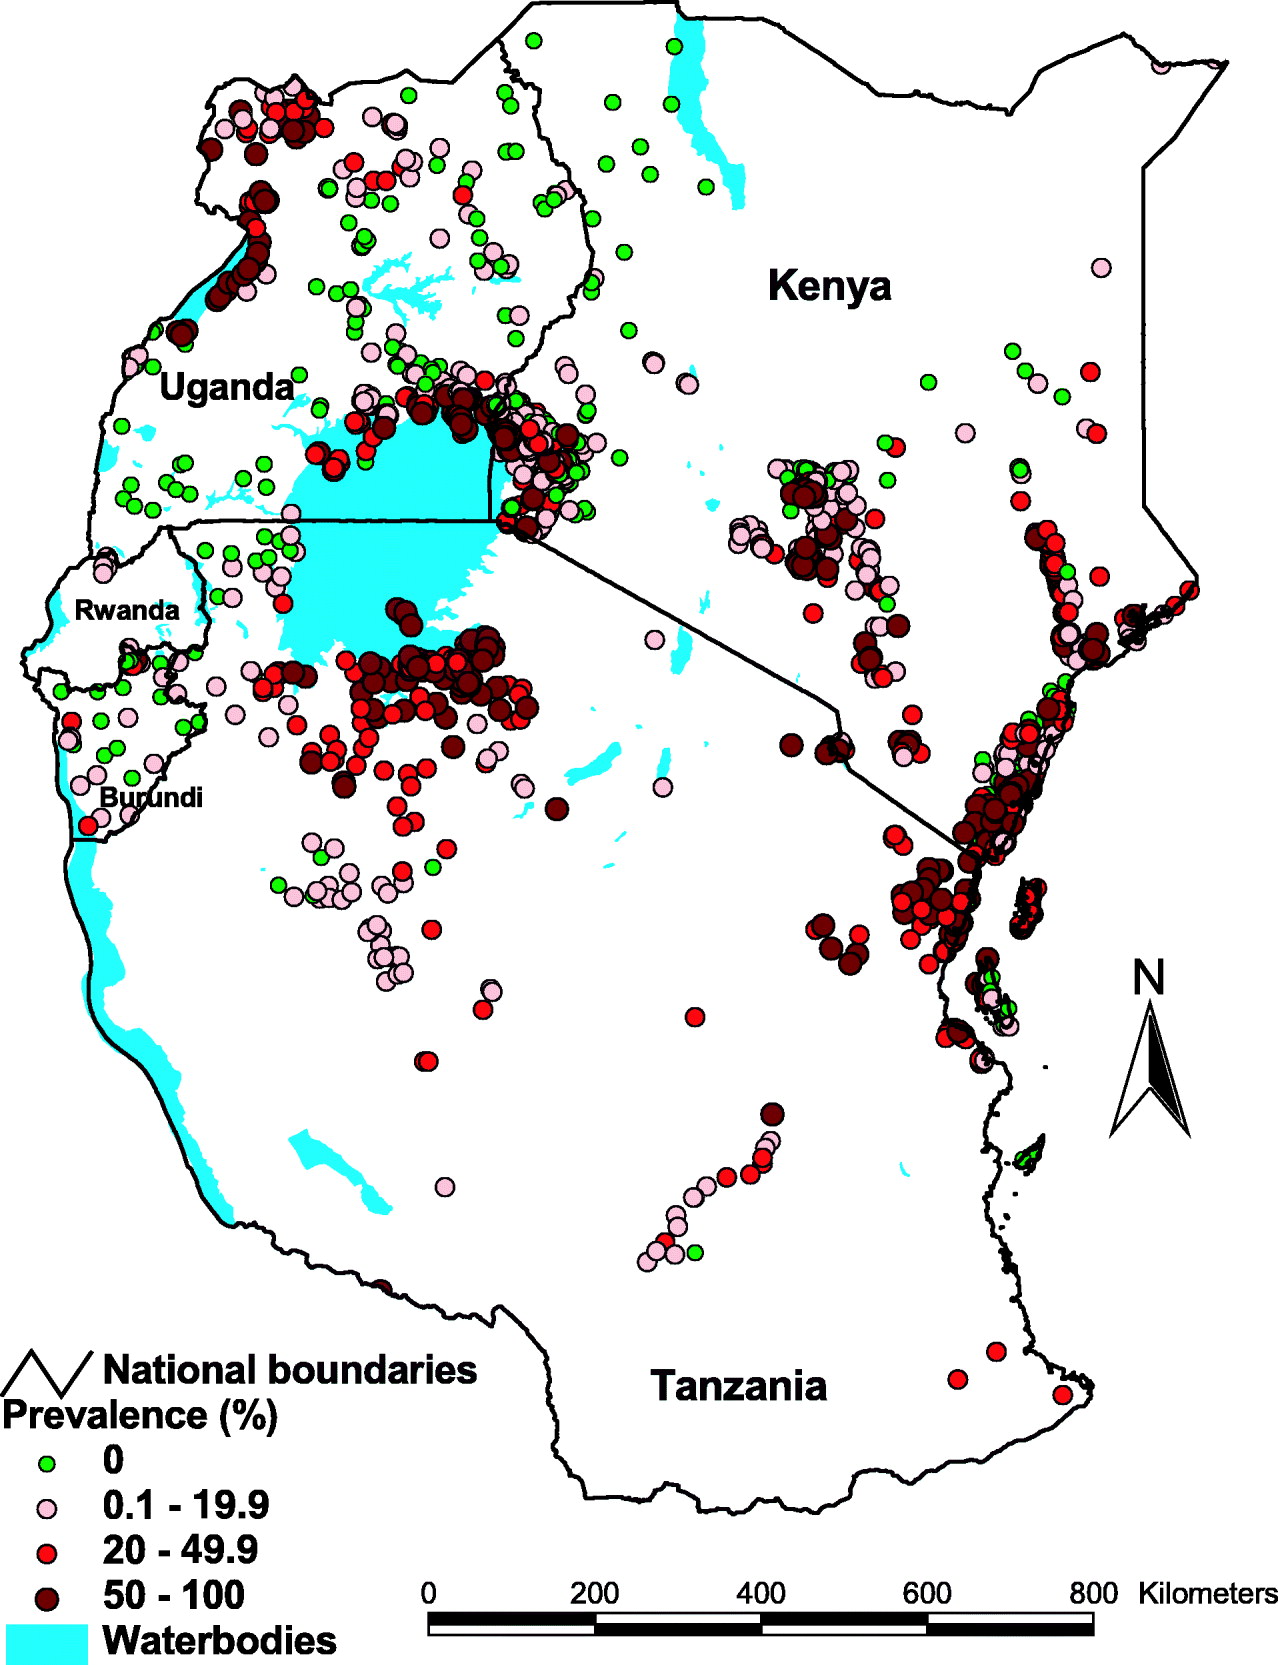
Over the years, thousands of surveys have been undertaken to estimate the prevalence of schistosomiasis in different locations across Africa (Doumenge et al. Reference Doumenge, Mott, Cheung, Villenave, Chapuis, Perrin and Read-Thomas1987; Brooker et al. Reference Brooker, Rowlands, Haller, Savioli and Bundy2000). While there are problems regarding comparability between surveys due to differences in sampling methods, age groups covered, diagnostic approaches taken, and timings of surveys, an ‘Atlas of Human Helminth Infections’ has attempted to extract and collate relevant surveys into a single database, with the aim of describing the distribution of infection across the African continent (Brooker et al. Reference Brooker, Rowlands, Haller, Savioli and Bundy2000). This work served to highlight the tremendous paucity of empirical data for large areas of the African continent, with survey data on schistosomiasis available in 2000 for only a third of districts in Africa. Since 2000, a large number of national surveys have been undertaken, and current work is ongoing to update the atlas as well as to geo-position surveys to actual locations. Fig. 1 presents an example of current progress for East Africa.
The distribution of schistosomiasis in East Africa based on current progress in updating the Global Atlas of Human Helminth Infection (for further details see Brooker et al. Reference Brooker, Rowlands, Haller, Savioli and Bundy2000). The data included 2498 survey locations reporting either S. mansoni or S. haematobium, and the highest prevalence of either species is presented. Information is based on electronic searches of formal literature and grey literature databases, as well as using personal contacts with schistosomiasis research scientists and control personnel. In the searches strict inclusion criteria are employed: only random or complete community-sample surveys conducted post-1980, where parasite species and age groups are defined. Surveys are geopositioned using Microsoft Encarta encyclopedia and electronic gazetteer sources along with personal communication with authors. A list of included studies is available from the authors.
To help overcome the paucity of survey data, research efforts have been made to predict schistosome infection risk at non-sampled locations on the basis of climate-based risk models, using geographical information system (GIS), remote sensing (RS) and geostatistics (for recent reviews see: Brooker, Reference Brooker2007; Simoonga et al. Reference Simoonga, Utzinger, Brooker, Vounatsou, Appleton, Stensgaard, Olsen and Kristensen2009, in this special issue; Vounatsou et al. Reference Vounatsou, Raso, Tanner, N'Goran and Utzinger2009, in this special issue). Although useful to guide control efforts at national scales by excluding areas where no or limited transmission occurs, such risk models are unable to define the geographical variation of infection evident at community levels. This is because schistosomiasis is a highly focal disease, such that control needs to be targeted on a community by community basis. This requirement will be increasingly important as national control programmes reduce the overall level of infection, and morbidity and spatial patterns potentially become even more heterogeneous, which has important repercussions for control (Raso et al. Reference Raso, Vounatsou, McManus and Utzinger2007). Below we consider a number of approaches to map community patterns of schistosomiasis and discuss their implementation in practice.
Morbidity questionnaires
The signs and symptoms of urinary schistosomiasis, such as blood in urine and pain when urinating, are clearly recognised by individuals, and it is not common for school-aged children to report having blood in urine without having urinary schistosomiasis. Such specificity of this sign of S. haematobium infection in endemic areas has allowed blood in urine to be incorporated into morbidity questionnaires which identify communities with a high prevalence of infection and warranting mass treatment (WHO, 1995). The use of reported blood in urine to identify high prevalence communities using a simple school-based questionnaire was first developed and administered through the education system in Kilombero and Kilosa districts of Tanzania (Lengeler et al. Reference Lengeler, de Savigny, Mshinda, Mayombana, Tayari, Hatz, Degrémont and Tanner1991a, Reference Lengeler, Kilima, Mshinda, Morona, Hatz and Tannerb). A number of studies have subsequently demonstrated that morbidity questionnaires can rapidly and cost-effectively identify high-risk communities (for a review see: Lengeler, Utzinger and Tanner, Reference Lengeler, Utzinger and Tanner2002). These studies confirm that morbidity questionnaires administered through the education system are accurate and allow for rapid and cost-effective identification of high-risk communities of urinary schistosomiasis (Ansell and Guyatt, Reference Ansell and Guyatt2002; Lengeler et al. Reference Lengeler, Utzinger and Tanner2002). At an operational level, two aspects are worth highlighting. First, the recall period length (2 weeks versus 4 weeks) had only a minor effect on the diagnostic performance of the questionnaire (van der Werf, Borsboom and de Vlas, Reference van der Werf, Borsboom and de Vlas2003). Second, age and sex influence the reliability of self-reported schistosomiasis as a diagnostic method (Ansell et al. Reference Ansell, Guyatt, Hall, Kihamia and Bundy2001; Clements et al. Reference Clements, Barnett, Nyandindi, Lwambo, Kihamia and Blair2008a).
Questionnaire surveys for urinary schistosomiasis are now recommended as a first step in implementing national schistosomiasis control programmes. In the late 1990s, for example, questionnaires were administered to 1291 schools in five regions of Côte d'Ivoire. Within 5 weeks filled-in questionnaires were returned by 1091 schools (84·5%) with 118 327 schoolchildren being interviewed, with a recent history of blood in urine being reported by 22 035 (18·6%) of the children. Based on these results, 186 schools were considered at high risk of urinary schistosomiasis (N'Guessan et al. Reference N'Guessan, Acka, Utzinger and N'Goran2007). In Tanzania in 2004, a morbidity questionnaire was distributed through the existing infrastructure of the Ministry of Education to all schools in the country and teachers were trained in how to complete the questionnaire. More than 2·5 million schoolchildren in 12 399 schools were interviewed and results on the frequencies of self-reported blood in urine and self-reported schistosomiasis were utilized to guide the spatial targeting of praziquantel administration (Clements et al. Reference Clements, Brooker, Nyandindi, Fenwick and Blair2008b).
Considerable efforts have also been made to extend the questionnaire approach from urinary to intestinal schistosomiasis. These efforts were predicated on the results of numerous epidemiological and hospital-based studies showing that S. mansoni infections, especially those with a moderate or heavy intensity (>100 eggs per gram of stool), are associated with a recent history of blood in stool and/or (bloody) diarrhoea (Gryseels, Reference Gryseels1992; Utzinger et al. Reference Utzinger, N'Goran, Esse Aya, Acka Adjoua, Lohourignon, Tanner and Lengeler1998), and that these symptoms are valuable markers for identification of high-risk communities of intestinal schistosomiasis (Utzinger et al. Reference Utzinger, N'Goran, Ossey, Booth, Traoré, Lohourignon, Allangba, Ahiba, Tanner and Lengeler2000; Lengeler et al. Reference Lengeler, Utzinger and Tanner2002). However, compared to urinary schistosomiasis, the questionnaire approach for intestinal schistosomiasis only showed a moderate sensitivity. It was thus concluded that parasitological validation should precede any large-scale use of questionnaires for rapid screening of intestinal schistosomiasis in a given epidemiological setting (Brooker et al. Reference Brooker, Miguel, Waswa, Namunyu, Moulin, Guyatt and Bundy2001; Lengeler et al. Reference Lengeler, Utzinger and Tanner2002).
Rapid mapping of intestinal schistosomiasis
Concerns about the lack of a reliable questionnaire approach for intestinal schistosomiasis and the need for further validation prompted researchers to explore alternative ways to reduce the sampling effort required to assess the prevalence and distribution of S. mansoni. Lot quality assurance sampling (LQAS) is an approach that relies on a relatively limited number of observations to classify sampling units so that a decision can be rapidly reached. Originally developed by industry to monitor production quality, it has been increasingly adapted for use in population health surveys (Robertson and Valadez, Reference Robertson and Valadez2006). Recent operational research has highlighted the potential of LQAS for identifying high-risk communities for S. mansoni (Rabarijaona et al. Reference Rabarijaona, Rakotomanana, Ranaivo, Raharimalala, Modiano, Boisier, De Giorgi, Raveloson and Jambou2001; Brooker et al. Reference Brooker, Kabatereine, Myatt, Stothard and Fenwick2005). In this approach, a specified number of individuals are randomly selected to provide stool samples which are examined until either a predetermined number of infected individuals is identified, i.e. indicating a high prevalence (⩾50%), or the specified number of individuals sampled without the threshold being reached, i.e. indicating a prevalence below 50% (WHO, 2002). A finer classification system may be provided by applying alternative, secondary sampling plans to data already collected and classified, by previously applied sampling plans, as coming from communities with a prevalence below 50%, and used to distinguish between moderate (20–49%) and low (<20%) prevalence schools (Brooker et al. Reference Brooker, Kabatereine, Myatt, Stothard and Fenwick2005). The approach has the benefit of allowing the survey to stop as soon as it has sufficient information about the likely category of S. mansoni prevalence and facilitates an intervention strategy to be planned, e.g. mass treatment of entire communities with praziquantel where prevalence exceeds 50%.
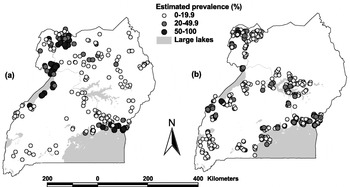
In Uganda, a comprehensive investigation, employing a combination of computer simulations and field studies, showed that LQAS provides a highly reliable approach to classifying schools according to treatment strategy (Brooker et al. Reference Brooker, Kabatereine, Myatt, Stothard and Fenwick2005). Cost-effectiveness analysis indicated that screening and treating schools on the basis of LQAS was more cost-effective than mass treating all schools without prior screening in a given district. On the basis of these results, the Ugandan National Helminth Control Programme determined, in 2006, to undertake nationwide rapid mapping survey using LQAS to assess the status of S. mansoni following several treatment rounds. The purpose of the investigation was to classify schools according to different prevalence thresholds: <20%, 20–50% and >50%, in order to direct the future treatment strategy for the national control programme. Comparing these rapid mapping results against parasitological data collected prior to treatment (Kabatereine et al. Reference Kabatareine, Brooker, Tukahebwa, Kazibwe and Onapa2004), it can be seen that greatest apparent change occurred along the Nile basin in the north-western region of the country and along the shores of Lake Albert (Fig. 2). The results also highlight that areas of high prevalence of S. mansoni still exist and reveal additional districts where treatment is warranted. Although illustrative, such mapping results cannot definitively assess programme impact – a robust analysis of programme impact is presented elsewhere (Kabatereine et al. Reference Kabatereine, Brooker, Koukounari, Kazibwe, Tukahebwa, Fleming, Zhang, Webster, Stothard and Fenwick2007) – but can provide useful qualitative information for planning purposes as control programmes roll out. The overall estimated cost of the rapid mapping investigation was US$ 21 182, illustrating the low cost of the approach to rapidly assess the distribution of intestinal schistosomiasis at a national level. The approach could be further simplified if combined with rapid, yet reliable diagnosis, which we now consider.
Estimated distribution of S. mansoni in Uganda (a) pre-2004 and (b) in 2006. The pre-2004 data were collected from 201 schools and based on stool examination using the Kato-Katz method (Kabatereine et al. Reference Kabatareine, Brooker, Tukahebwa, Kazibwe and Onapa2004). The 2006 data were collected from 429 schools in 31 districts across the country and based on a rapid mapping survey using LQAS technique (Brooker et al. Reference Brooker, Kabatereine, Myatt, Stothard and Fenwick2005). Here, four teams, comprised of one supervisor, two technicians and a driver visited different regions of the country and sampled eight schools per day over 3 days per district. Geographical coordinates, using hand-held global positioning system (GPS) devices, were also recorded for each school which allowed, once all the data had been collected, the creation of prevalence maps using GIS software.

Rapid diagnosis of schistosomiasis
Reliable and rapid diagnosis is central to the mapping of schistosomiasis. The ‘gold’ standard for diagnosing schistosomiasis, particularly in the early stages of control when morbidity reduction is the declared objective, is the detection of eggs in urine by the filtration method (for S. haematobium) or in stool by the Kato-Katz technique or other direct methods (for S. mansoni) (Bergquist et al. Reference Bergquist, Johansen and Utzinger2009). However, stool examination suffers day-to-day and intra-specimen variation in egg output necessitating sample collection over several days to ensure maximal sensitivity (de Vlas and Gryseels, Reference Gryseels1992; Engels, Sinzinkayo and Gryseels, Reference Engels, Sinzinkayo and Gryseels1996, Reference Engels, Sinzinkayo and Gryseels1997; Utzinger et al. Reference Utzinger, Booth, N'Goran, Müller, Tanner and Lengeler2001). Moreover, urine filtration and Kato-Katz thick smear examination require expert microscopy.
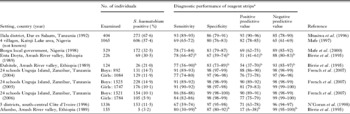
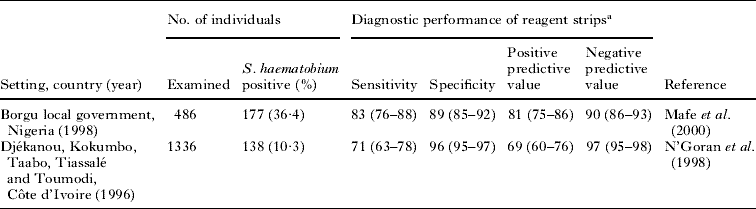
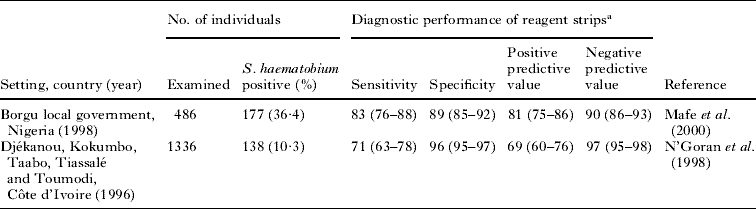
For S. haematobium, testing urine with reagent strips for blood is a simple, indirect method of identifying infected individuals and who require treatment (Mafe, Reference Mafe1997; Lengeler et al. Reference Lengeler, Utzinger and Tanner2002). A wealth of studies report high sensitivity and specificity of reagent strips when compared to urine filtration when both methods were performed by research teams (Table 1). Furthermore, studies show that training of teachers (usually within half a day) allow for subsequent reagent strip testing by the teachers, resulting in moderate to high sensitivity and specificity (Table 2).
Diagnostic performance of reagent strip testing for microhaematuria compared to urine filtration (considered as the diagnostic ‘gold’ standard), performed by research teams in different African settings

a Values in brackets indicate 95% confidence intervals.
b Values have been recalculated, including 95% confidence intervals.
Diagnostic performance of reagent strip testing for microhaematuria carried out by previously trained teachers compared to research teams in different African settings (the results from the research teams were considered as the diagnostic ‘gold’ standard)
a Values in brackets indicate 95% confidence intervals.
One limitation of haematuria reagent strips is that they can be affected by factors such as menstruation and genitourinary infections (Hall and Fentiman, Reference Hall and Fentiman1999; Poggensee et al. Reference Poggensee, Krantz, Kiwelu and Feldmeier2000). A further shortcoming is that they are semi-quantitative and have a limited concentration detection range. Such limitations have prompted researchers to investigate alternative rapid diagnosis methods. In recent years, the diagnosis of many tropical diseases, including malaria, has been greatly enhanced by the use of easy-to-use and accurate immunological tests, where relevant parasite antigens are detected in finger-prick blood (Moody, Reference Moody2002; Marx et al. Reference Marx, Pewsner, Egger, Nüesch, Bucher, Genton, Hatz and Jüni2005). Although accurate, non-invasive rapid antigen detection assays are currently available for lymphatic filariasis, onchocerciasis and visceral leishmaniasis (Weil, Lammie and Weiss, Reference Weil, Lammie and Weiss1997; Ayong et al. Reference Ayong, Tume, Wembe, Simo, Asonganyi, Lando and Ngu2005; Chappuis et al. Reference Chappuis, Rijal, Jha, Desjeux, Karki, Koirala, Loutan and Boelaert2006), progress in this area for schistosomiasis has been slow.
Schistosome antigens are readily detectable in sera, but sample collection requiring venopuncture is often unpractical, not widely accepted and requires trained personnel. An alternative diagnostic method is based on schistosome circulating cathodic antigens (CCA), which are excreted in both serum and urine. For practical convenience, a urine-based test has sought to be developed. The first such test was an enzyme-linked immunosorbent assay (ELISA), which led to a dipstick format (van Etten et al. Reference van Etten, van Lieshout, Mansour and Deelder1997). More recent attention has focused upon immuno-lateral flow principles, which utilise capillary diffusion of reagents through nitrocellulose strips (van Dam et al. Reference van Dam, Wichers, Falcao Ferreira, Ghati, van Amerongen and Deelder2004). A CCA-based dipstick became commercially available in 2003 from BV European Veterinary Laboratory. Field evaluations in Burkina Faso, Niger, Uganda and Zanzibar showed that the test was insensitive in detecting urinary schistosomiasis but highly (80%) sensitive and specific in the detection of intestinal schistosomiasis (Stothard et al. Reference Stothard, Kabatereine, Tukahebwa, Kazibwe, Rollinson, Mathieson, Webster and Fenwick2006). Studies in Ethiopia confirmed the high sensitivity and specificity of CCA-based dipsticks for S. mansoni but showed a lower sensitivity in low transmission settings (Legesse and Erko, Reference Legesse and Erko2007, Reference Legesse and Erko2008). Other work in Ethiopia found a low sensitivity (52%) and specificity (64%) for the detection of S. haematobium (Ayele et al. Reference Ayele, Erko, Legesse, Hailu and Medhin2008), thereby supporting the claim by Stothard and colleagues (2006) that CCA-based dipsticks have no or limited value for detection for S. haematobium. A current limitation of using CCA dipsticks for S. mansoni is the prohibitively expensive cost, which is presently at US$ 2.6 per test.
RAPID MAPPING OF OTHER NTDS
The rapid assessment of schistosomiasis has been able to build successfully upon rapid mapping methods developed for other NTDs. The first such method was for onchocerciasis, a disease caused by infection with a parasitic filarial worm, Onchocerca volvulus. Control of onchocerciasis involves the yearly mass community-directed distribution of ivermectin as part of the African Programme for Onchocerciasis Control (APOC). Priority areas for mass distribution of ivermectin are identified on the basis of the rapid epidemiological mapping of onchocerciasis (REMO) method, which takes into consideration specific spatio-epidemiological characteristics of the disease (spatial distribution of vectors in breeding sites along fast-flowing and well oxygenated rivers) to identify areas likely to be at high risk (Ngoumou, Walsh and Mace, Reference Ngoumou, Walsh and Mace1994; Katabarwa, Onapa and Nakileza, Reference Katabarwa, Onapa and Nakileza1999). A sub-sample of communities in identified areas are then screened using the rapid epidemiological assessment for onchocerciasis (REA) method, which is based on the estimation of the prevalence of onchocercal nodules in adult males using simple palpation. Results of REMO have been effectively incorporated into a GIS to visualize priority areas for mass distribution of ivermectin and estimate the number of individuals to be treated, and has greatly helped APOC to prioritize allocation of resources according to need (Noma et al. Reference Noma, Nwoke, Nutall, Tambala, Enyong, Namsenmo, Remme, Amazigo, Kale and Sékétéli2002).
The approach has also been extended to rapidly map Loa loa (loiasis) using the rapid assessment procedure for loiasis (RAPLOA) method (TDR, 2001; Takougang et al. Reference Takougang, Meremikwu, Wandji, Yenshu, Aripko, Lamlenn, Eka, Enyong, Meli, Kale and Remme2002). Individuals with high microfilarial loads of L. loa are at increased risk of neurologically serious adverse events following ivermectin treatment against onchocerciasis, and it is therefore important to identify areas of high loiasis risk as part of onchocerciasis control efforts. The RAPLOA approach correlates the proportion of community members reporting a history of eyeworm with the prevalence of high-intensity L. loa microfilaremia in that community, and is used to assess rapidly those areas at potential risk of treatment-related L. loa encephalopathy. Work in Cameroon has demonstrated that RAPLOA and REA could be used simultaneously to rapidly evaluate loiasis and onchocerciasis endemicity in areas targeted by APOC for safe treatment with ivermectin (Wanji et al. Reference Wanji, Tendongfor, Esum, Yundze, Taylor and Enyong2005). As with schistosomiasis, spatial risk mapping can successfully exclude areas of zero or low loiasis transmission prior to rapid assessment surveys (Diggle et al. Reference Diggle, Thomson, Christensen, Rowlingson, Obsomer, Gardon, Wanji, Takougang, Enyong, Kamgno, Remme, Boussinesq and Molyneux2007).
The implementation of control efforts against lymphatic filariasis, a disease caused by the filarial parasite Wuchereria bancrofti, has also benefited from a rapid mapping approach. WHO recommends that the control of lymphatic filariasis is based on MDA with either ivermectin or diethylcarbamazine (DEC) plus albendazole in areas where prevalence exceeds 1% (WHO, 2000). As a first step in development of national control programmes, comprehensive survey data are essential. Rapid mapping of lymphatic filariasis has been made feasible by the development of immunochromatographic card tests (ICT) for the detection of circulating Og4C3 antigen from adult W. bancrofti filarial antigenaemia as well as standardised sampling strategies (WHO, 2000). These sampling strategies have included the use of a spatial sampling grid with either 25 km or 50 km between sampled communities and geostatistical modelling for predicting infection in non-sampled areas, an approach which has been validated (Gyapong and Remme, Reference Gyapong and Remme2001) and subsequently used to map the distribution of W. bancrofti in West Africa (Gyapong et al. Reference Gyapong, Kyelem, Kleinschmidt, Agbo, Ahouandogbo, Gaba, Owusu-Banahene, Sanou, Sodahlon, Biswas, Kale, Molyneux, Roungou, Thomson and Remme2002) and Uganda (Onapa et al. Reference Onapa, Simonsen, Baehr and Pedersen2005). Other analyses suggest, however, that endemic foci can persist within the interstices of the proposed grid and that smaller grids are required (Srividya et al. Reference Srividya, Michael, Palaniyandi, Pani and Das2002). Another sampling method has been the adaptation of LQAS whereby a minimum of 100 individuals are tested in each community (or school), and then if one or more are found to be positive no further testing is done and MDA will be provided throughout the district in which the community is located. Otherwise, up to 250 individuals are tested to ensure that infection prevalence does not exceed 1%. This approach has successfully been used to map infection in Nepal (Sherchand et al. Reference Sherchand, Obsomer, Thakur and Hommel2003) and Haiti (Beau de Rochars et al. Reference Beau de Rochars, Milord, St Jean, Désormeaux, Dorvil, Lafontant, Addiss and Streit2004). LQAS has also been used to monitor coverage after every round of MDA as part of the India national lymphatic filariasis control programme (Vanamail et al. Reference Vanamail, Subramanian, Srividya, Ravi, Krishnamoorthy and Das2006).
In addition to lymphatic filariasis and S. mansoni, LQAS has been employed to help identify priority areas for interventions targeting blinding trachoma caused by the bacterium Chlamydia trachomatis (Myatt et al. Reference Myatt, Limburg, Minassian and Katyola2003) and human African trypanosomiasis (Hutin et al. Reference Hutin, Legros, Owini, Brown, Lee, Mbulamberi and Paquet2004). To our knowledge, no attempts have been made thus far to use LQAS for rapid identification of high-risk communities of STH. This is rather surprising, as stool samples can be readily examined for the presence of S. mansoni and other helminth eggs, and hence holds promise for prioritizing control not only of intestinal schistosomiasis but also STH (Hugh Sturrock et al. unpublished).
FUTURE DIRECTIONS
In the last two decades, there have been significant developments in methods for identifying at-risk populations for control programmes targeting schistosomiasis, using questionnaire surveys, GIS, and rapid survey methodologies. Practical, low-cost applications of these methods are now being implemented at national and regional scales. More recent interest has focused on the potential of integrating a number of NTD interventions which deliver population-based chemotherapy (WHO, 2006; Hotez et al. Reference Hotez, Molyneux, Fenwick, Kumaresan, Ehrlich Sachs, Sachs and Savioli2007). The effectiveness of such integrated programmes will crucially depend on the geographical overlap between the different NTDs. However, in spite being co-endemic in individual countries (Brady et al. Reference Brady, Hooper and Ottesen2006), different NTDs can in certain settings, for example, Uganda (Kolaczinski et al. Reference Kolaczinski, Kabatereine, Onapa, Ndyomugyengi, Kakmebo and Brooker2007), exhibit limited geographical overlap at sub-national scales, necessitating a more geographically targeted approach for integrated NTD control (Brooker and Utzinger, Reference Brooker and Utzinger2007). Thus, research efforts should be undertaken to determine the optimal strategy of rapidly and simultaneously assessing a number of NTDs. An immediate question that arises is whether it is possible to develop an integrated rapid mapping approach.
As a first step, we have previously proposed that the spatial co-distribution of different NTDs over large geographical areas, such as at continental and regional scales, can be based initially on climate-based disease risk maps (Brooker, Clements and Bundy, Reference Brooker, Clements and Bundy2006; Brooker, Reference Brooker2007; Brooker and Utzinger, Reference Brooker and Utzinger2007). Such models also have a role in defining co-distribution at local levels (Raso et al. Reference Raso, Vounatsou, Singer, N'Goran, Tanner and Utzinger2006b; Brooker and Clements, Reference Brooker and Clements2009). At finer scales, however, there will remain a need to undertake rapid and inexpensive assessments of infection levels to guide local integrated control. As outlined here, a number of simple (though not always cheap) approaches, including the use of questionnaires and rapid antigen detection assays, are currently available. An issue which merits further attention, and is indeed germane to the sustainable implementation of NTD control, includes investigation into how these assessment tools can be cost-effectively and practically combined into a single, simple survey methodology.
There are, however, a number of important differences in the mapping approaches used by various NTD programmes, which makes the move to an integrated mapping approach particularly challenging. First, the target age group for sampling differs among the major NTDs: school-aged children for schistosomiasis and STH, persons aged 10 years or above for lymphatic filariasis, and adults for onchocerciasis. Second, the number of individuals to be sampled depends, in part, on the prevalence threshold used to denote the need for MDA: because the threshold for lymphatic filariasis is 1%, up to 250 individuals per community are sampled; this contrasts the 50 children per school for schistosomiasis and STH, or even lower numbers when using LQAS. Third, the inherent spatial heterogeneity of infection varies among the different NTDs (Gyapong et al. Reference Gyapong, Kyelem, Kleinschmidt, Agbo, Ahouandogbo, Gaba, Owusu-Banahene, Sanou, Sodahlon, Biswas, Kale, Molyneux, Roungou, Thomson and Remme2002; Srividya et al. Reference Srividya, Michael, Palaniyandi, Pani and Das2002; Brooker et al. Reference Brooker, Kabatereine, Tukahebwa and Kazibwe2004; Raso et al. Reference Raso, Vounatsou, Gosoniu, Tanner, N'Goran and Utzinger2006a, b; Brooker, Reference Brooker2007) and this necessarily has implications for the spatial density of sampling. Fourth, various tests and approaches are used to diagnose infection (urine, stool and blood), and this adds complication and expense to any integrated survey. Finally, the geographical unit at which interventions are implemented varies: whole districts for lymphatic filariasis and perhaps STH, communities or schools for schistosomiasis and onchocerciasis. Any integrated mapping approach would need to reconcile such differences, and the approach would need to be constantly adapted in response to progress made and as a function of the stage of control of different NTDs.
Notwithstanding these challenges, we believe that the issue of rapid, low-cost assessment methods will gain even greater importance as control programmes are increasingly implemented and the aims of control programmes move from morbidity control to transmission control (Bergquist et al. Reference Bergquist, Johansen and Utzinger2009). The identification of remaining pockets of high transmission in areas of low endemicity will become more difficult as a large amount of unnecessary assessments will need to be conducted. Thus, novel approaches to rapid assessment must be developed. A recent study in Brazil has explored the use of schoolchildren as indicators for the identification of S. mansoni-positive family members in an area of low endemicity (Massara et al. Reference Massara, Peixoto, Enk, da Silva Barros, dos Santos Carvalho, Sakurai and Schall2006). Although the approach had a relatively low sensitivity (50%), it had a high negative predictive value (87%) suggesting that few positive family members of schoolchildren with a negative stool result are missed. Further evaluation of this approach in other settings and for different diseases is clearly warranted.
For example, as malaria control efforts are intensified in Africa and elsewhere, indeed with renewed efforts towards local elimination and global eradication, there is a pressing need for rapid assessment methods to guide interventions. The usefulness of rapid malaria assessment in urban areas, including collection of health statistics, health facility-based surveys, vector breeding site surveys, and school parasite surveys, has recently been evaluated in four cities across Africa (Wang et al. Reference Wang, Lengeler, Smith, Vounatsou, Cissé, Diallo, Akogbeto, Mtasiwa, Teklehaimanot and Tanner2005). It would be interesting to evaluate this approach and to investigate alternative rapid malaria assessment methods, including LQAS (Rabarijaona et al. Reference Rabarijaona, Rakotomanana, Ranaivo, Raharimalala, Modiano, Boisier, De Giorgi, Raveloson and Jambou2001), in rural settings.
The research reviewed here provide salient, evidence-based approaches to a rapid understanding of the prevalence and distribution of schistosomiasis and other NTDs in order to facilitate the design and implementation of sustainable development programmes. Alternative rapid assessment methods and their cost-effectiveness should continue to be investigated. We hope this review will stimulate a concerted research effort in the future.
ACKNOWLEDGEMENTS
S. B. is supported by a Career Development Fellowship (081673) from the Wellcome Trust and J. U. acknowledges the financial support of the Swiss National Science Foundation (project no. PPOOB–102883, PPOOB–119129). Support for the LQAS survey in Uganda was provided by the Schistosomiasis Control Initiative of Imperial College.