


1 Introduction
One of the most critical factors that influence population dynamics is the environment, both abiotic (physical) and biotic (living), including interactions with the other species. Each species engages in a web of interspecific relationships that forms the foundation of community ecology. Within these communities, no species exists in isolation; population changes in one species inevitably affect and are affected by the others. For example, the presence or absence of a particular species can significantly alter the population trajectory of another species. Such interactions, whether positive, such as mutualism, or negative, such as competition or predation, are essential for shaping ecological systems (see [Reference Begon, Townsend and Harper3, Reference Smith and Smith18]).
A classical and fundamental example is the predator–prey relationship, in which one species (the predator) feeds on another (the prey). Consider the case of foxes and rabbits in a forest ecosystem: rabbits feed on plants, and foxes prey on rabbits. To understand these dynamics, ecologists often employ mathematical models, the most famous of which is the Lotka–Volterra model developed by Vito Volterra in
$1920$
 (see [Reference Allen1, Reference Volterra19]). This model assumes that: (i) the prey grow exponentially in the absence of the predators, (ii) encounters between the predators and the prey occur at a rate proportional to the product of their population sizes, (iii) the predator birth rate scales with the prey consumption, and (iv) the predator death occurs at a constant per-capita rate.
Mathematically, this yields a coupled system of equations: the term “
$-pxy$
 ” reduces the prey due to the predation, while “
$+qxy$
 ” increases the predator biomass by converting the consumed of the prey. These interactions produce characteristic oscillatory cycles: prey increase, predators follow, prey decline under predation, and predator numbers subsequently fall, only for the prey to recover again.
The Holling–Tanner model is a mathematical model used to describe predator–prey dynamics in ecology. It is a modification of the classical Lotka–Volterra model, introducing more realistic biological assumptions, particularly, the concept of a functional response (how predators respond to prey density).
In recent decades, ecologists [Reference Gopalsamy9, Reference Kuang13, Reference Murray15] have refined these models by incorporating biologically motivated time delays, such as gestation, maturation, or delayed responses to environmental changes. In population dynamics, several types of delays [Reference Arditi, Abillon and Silva2] are recognized:
-
• Latency (latent period): This is the time interval between infection and the onset of the symptoms in epidemiology.
-
• Time lag: It represents a general ecological delay, such as the time between the increase of the prey population, and the response of the predator.
-
• Generation time: This refers to the age at which organisms reach maturity and begin to reproduce.
-
• Delayed density dependence: Current population growth is influenced by past population densities, which often leads to oscillatory dynamics.
From a modeling perspective [Reference Arditi, Abillon and Silva2], introducing a delay into Holling–Tanner type predator–prey model which is also a ratio-dependant predator–prey functional response enhances biological realism [Reference Hu and Cao10, Reference Wang, Shi, Xu and Zang20] by representing the delayed effect of prey availability on predator reproduction or behavior. After predation, prey populations do not recover or respond instantaneously (see also [Reference Ruan16, Reference Yuan, Jiang and Wang22, Reference Zhang, Jin and Yang23]). There is a natural time lag arising from biological processes, such as maturation, gestation [Reference Begon, Townsend and Harper3], or recovery periods before the prey population can increase again. This delay accounts for the time required for prey populations to rebound after being reduced by predators [Reference Li and Wei14]. From a mathematical standpoint, introducing a time delay into the ratio-dependent functional response adds both realism and analytical complexity [Reference Celik4, Reference Celik and Çekiç6, Reference Çelik and Degirmenci7].
Time delays often yield richer dynamics and more accurate predictions. These delay-based models exhibit complex dynamics, such as Hopf bifurcations and sustained oscillations that are not typically observed in models without delay. Nevertheless, when a delay is incorporated into this framework, particularly in the response term, it can significantly influence the system dynamics and lead to complex behaviors, such as Hopf bifurcations, where a stable equilibrium gives rise to periodic population cycles (see [Reference Khabyah, Ahmed, Akram and Akhtar12, Reference Yafia, El Adnani and Alaoui21]).
In this study, we analyze the local stability and Hopf bifurcation of a ratio-dependent delayed predator–prey model, focusing on how delay
$\tau $
 affects the dynamics of the system. Singh et al. have shown that discretizing continuous systems highlights local stability and periodic bifurcation behavior (see [Reference Allen1, Reference Ruan16, Reference Zhang, Jin and Yang23]). Singh et al. [Reference Singh, Dhar and Bhatti17] considered the following continuous-time Holling–Tanner type predator–prey model where the carrying capacity is proportional to the prey density, which changes the dynamical structure in different aspects


They transform this model into a discrete-time model using the Euler discretization scheme and they investigate the local stability of the resulting system and obtain the conditions under where the Hopf bifurcation may occur. To incorporate the model (1.1), the time required for prey populations to recover from predation, a delay is introduced into the prey survival response, reflecting the rebound period following predation pressure.
Motivated by Singh’s study, we analyze the following model based on the model (1.1) by incorporating time delay for prey populations for local stability and Hopf bifurcation:


where a, k, b, m, n, d, and q are positive constants.
$x(t)$
 is the density of the prey population and
$y(t)$
 is the density of the predator population at time t, respectively, and
$\tau \geq 0$
 denotes the delay time for the prey density. In this model, the constants are described as follows: a is the intrinsic growth rate of the prey, b is the harvesting rate of the prey by the predator, d is the death rate of the predator, k is the carrying capacity of the prey in a particular habitat, m is the maximum value which per capita reduction rate of predator can attend, n is the measure of the food quality that the prey provides for conversion into predator births, and q is the extent to which alternatives are provided for the growth of the predators. For more details on Differential Equations with delay, see [Reference Allen1, Reference Celik4, Reference Çelik and Degirmenci7, Reference Khabyah, Ahmed, Akram and Akhtar12, Reference Li and Wei14, Reference Ruan16].
This article is organized as follows: In Section 2, we first focus on the linearization and local stability for Hopf bifurcation of the positive equilibrium,
$E^*(x^*,y^*)$
 . In Section 3, we prove the existence of Hopf bifurcation. By identifying the critical delay
$\tau $
 , we establish the condition under which a Hopf bifurcation occurs in the system. In Section 4, numerical simulations are performed to support the theoretical stability and Hopf bifurcation results with figures. Finally, in Section 5, discussion and conclusion are presented.
2 Linearization and Local Stability Analysis
The system


has six equilibrium points as
$E_1(0,\frac {(1-d)q}{m})$
 ,
$E_2(k,0)$
 ,
$E_3(-1,0)$
 ,
$E_4(0,0)$
 ,
$E_5(x_1^*,y_1^*)$
 , and
$E_6(x_2^*,y_2^*)$
 , where

and

and the corresponding
$y_i^*$
 is

So the system has only one positive equilibrium point
$E^*(x^*,y^*)$
 when
$1-d>0$
 and
$\widetilde{C}=\frac {bq(1-d)}{m}-a<0$
 .
To analyze the local stability of the positive equilibrium point
$E^*(x^*,y^*)$
 , we first linearize the delayed model and obtain the system

The Jacobian matrices are


From the partial derivatives of the functions f and g, the Jacobians are

To simplify the matrices, we let


When we check the trivial
$E_4(0,0)$
 equilibrium point for stability at
$\tau =0,$
 i.e., with no delay

We observe that for all possible values of
$\Delta =(1-d+a)^2-4a(1-d)$
 are positive, negative, or zero, the eigenvalues of the corresponding system are always positive or positive real parts, and hence
$E_4(0,0)$
 equilibrium point is unstable.
Now, for the positive equilibrium point, to find the characteristic equation of the linearized model, we substitute
$x = e^{\lambda t}v$
 , where
$v=\begin {bmatrix} v_1\\ v_2 \end {bmatrix}$
 into the system, that is equivalent to

which implies

Then, the corresponding characteristic equation is given by the transcendental equation


When there is no delay, i.e.,
$\tau =0$
 , the corresponding characteristic equation reduces to

for which
$\lambda _{1,2}=\frac {(B_1+C_1)\pm \sqrt {(B_1+C_1)^2-4(B_1C_1-A_1D_1)}}{2}$
 . Then, we obtain the following result.
Lemma 2.1 If the following conditions hold:
-
i. $C_1<0$
 ,
-
ii. $B_1C_1-A_1D_1>0$
,


then the positive equilibrium point
$E^*(x^*,y^*)$
 of the system (1.2) is locally asymptotically stable in the absence of
$\tau $
 .
We now examine the distribution of roots of the transcendental equation (2.3), since the stability of point
$(0,0)$
 of the linearized system (2.1) depends on the locations of the roots of the characteristic equation (2.3). By the continuous dependence of the roots of
$\lambda ^2 - B_1 \lambda - C_1 \lambda e^{-\lambda \tau } + (B_1 C_1 - A_1 D_1) e^{-\lambda \tau } = 0$
 and Lemma 2.1, there exists
$\tau _0> 0$
 such that
$Re\,\lambda (\tau ^*) < 0$
 for
$\tau \in [0,\tau _0)$
 . Since a loss of asymptotic stability of
$E^*(x^*,y^*)$
 will arise when
$Re\,\lambda (\tau ^*) = 0$
 , we shall investigate whether there exists
$\tau ^*> 0$
 for which
$Re\,\lambda (\tau ^*) = 0$
 , i.e., we shall decide when equation (2.3) has purely imaginary roots (see [Reference Celik and Çekiç6, Reference Çelik and Merdan8]). Hence, in the next section, we will prove the existence of Hopf bifurcation by finding
$\tau _0$
 where the system (1.2) loses its asymptotic stability.
3 The Existence of Hopf Bifurcation
To prove the existence of Hopf bifurcation, we first show that the transcendental equation (2.3) has a purely imaginary root by the approach of [Reference Çelik5].
Lemma 3.1 For system (1.2), the transcendental equation (2.3) admits at least one purely imaginary root .
Proof Assume that for
$\tau = \tau ^*$
 , the characteristic equation (2.3) admits a purely imaginary root
$\lambda = i \omega $
 , where
$\omega $
 is a real number, and without loss of generality
$\omega> 0$
 . Then, we obtain

Separating the characteristic equation into its real and imaginary parts leads to:

To simplify the system of equations, we square both sides of each equation, which yields:


Let

and

Since
$\lim _{z\to \infty } f(z) = \infty $
 and
$q = -C_1^2(B_1C_1-A_1D_1)^2 < 0$
 ,
$f(z)=z^2+pz+q$
 has at least one positive root which completes the proof of Lemma 2.1.
By Lemma 2.1, without loss of generality, we denote the positive root by z and
$\omega =\sqrt {z}$
 . Hence, we obtain

and

Denote
$\omega _0 = \frac {-(B_1^2-C_1^2)\pm \sqrt {(B_1^2-C_1^2)^2+4(B_1C_1-A_1D_1)^2}}{2}$
 and suppose

denotes the root of (2.3) near
$\tau =\tau _k$
 satisfying

Then, we have the following transversality condition.
Lemma 3.2 The following transversality conditions are satisfied:


if
$B_1C_1-A_1D_1<0$
 , i.e., system (1.1) undergoes Hopf bifurcation at the positive equilibrium point
$E^*(x^*,y^*)$
 for
$\tau = \tau _k, k= 0,1,2\ldots $

Proof Differentiating the characteristic equation (2.3) with respect to
$\tau $
 , we get


that is,

Thus,

The transversality condition,
$ \operatorname {Re}\!\left (\frac {d\lambda }{d\tau }\right )\big |_{\lambda =i\omega _0}> 0 $
 , if
$B_1C_1-A_1D_1<0$
 is satisfied. Since both
$cos$
 and
$sin$
 take positive values at
$x^*$
 and
$y^*$
 , from Rouché’s theorem, we have that the transversality condition holds and the conditions for Hopf bifurcation are satisfied at
$\tau = \tau _k$
 ,
$k=0,1,2\ldots $
 This completes the proof of the lemma.
Using these results, we can formulate the following theorem describing the stability and Hopf bifurcation behavior of system (1.1).
Theorem 3.3 Let system (1.1) be given. Then, the following statements hold:
-
(i) For $\tau \in [0, \tau _0]$
, the equilibrium point
$E^*(x^*,y^*)$
is asymptotically stable. -
(ii) If $\tau = \tau _k$
,
$k = 0,1,2,\dots $
, the system experiences a Hopf bifurcation at
$E^*(x^*,y^*)$
. -
(iii) When $\tau> \tau _0$
, the equilibrium point
$E^*(x^*,y^*)$
becomes unstable.


4 Numerical Simulations
In this section, we present the numerical simulations to verify our theoretical results proved in previous sections by using MATLAB (7.0) programming. Mainly, as an example, we simulate the predator–prey system (1.2) with the parameters, i.e., a = 0.7, b = 0.9, d = 0.6, m = 8, q = 8, n = 9, and k = 6, we consider the following system:


Using the algorithms in previous sections, we obtain that the system (4.1) has only one positive equilibrium point
$E^*(x^*, y^*)$
 =
$(0.467,0.6102)$
 . We evaluate that

$\omega _0$
 = 0.3772 and hence
$\tau _0$
 = 2.1. According to Theorem 3.3, the equilibrium point
$E^*$
 is locally asymptotically stable for
$\tau \in [0,\tau _0) = [0, 2.1)$
 and becomes unstable, when (
$\tau> 2.1$
 ). Additionally, a Hopf bifurcation occurs at
$\tau =\tau _0=2.1$
 as illustrated by the computer simulations. From this, we conclude that the Hopf bifurcation of system (1.1) at
$\tau _0 = 2.1$
 is supercritical, and a bifurcating periodic solution exists when
$\tau $
 crosses
$\tau _0$
 to the right, with the bifurcating periodic solution being unstable. In the computer simulations, we set the initial conditions as
$(0.467,0.6102)$
 and utilized the MATLAB delay differential equations (DDE) solver to simulate the system described in (1.2). Initially, we set
$\tau $
 = 1.8
$< \tau _0$
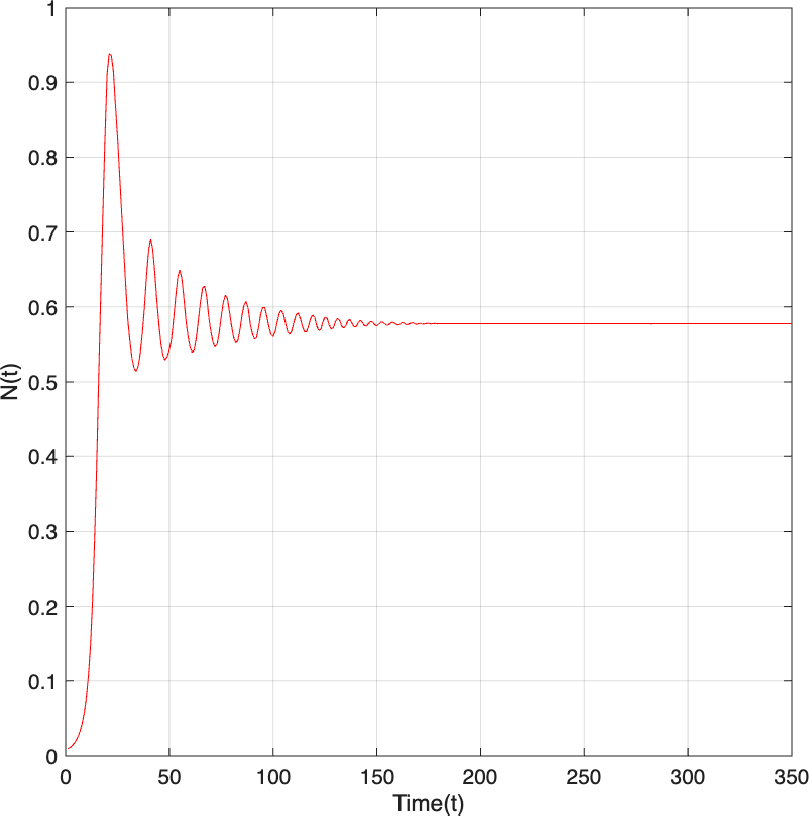
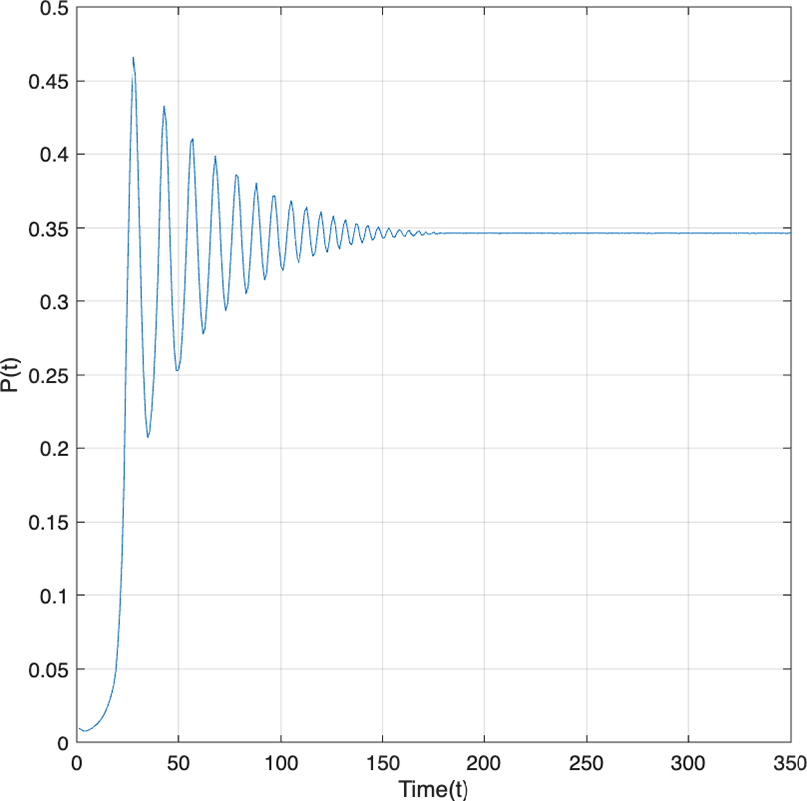
 and plot the density functions
$x(t)$
 and
$y(t)$
 in Figures 1 and 2, respectively, which show that the equilibrium is asymptotically stable for
$\tau < \tau _0$
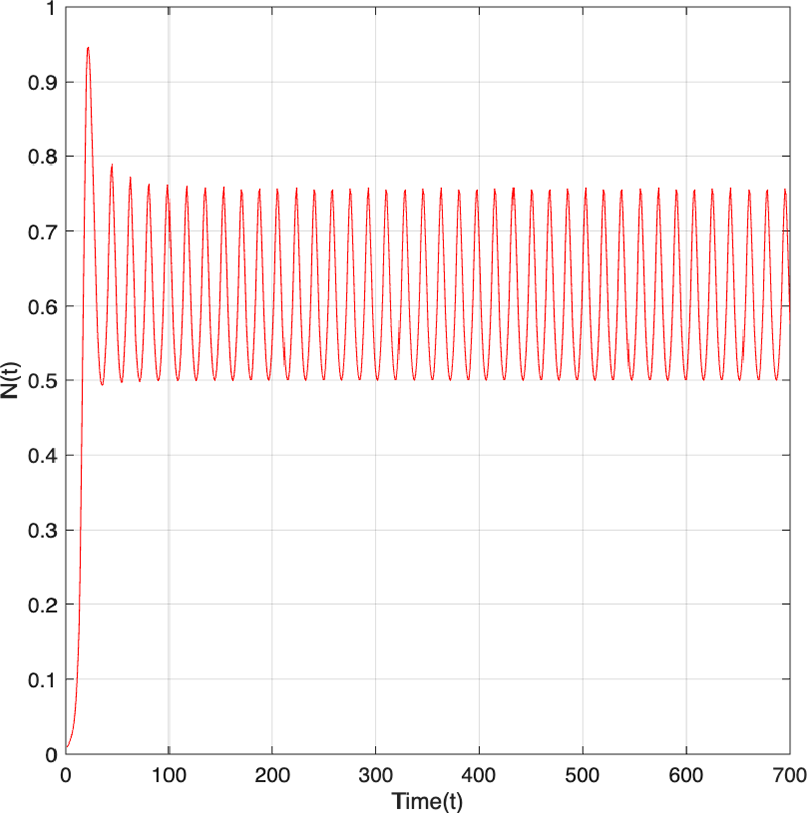
 . In Figures 3 and 4, we set
$\tau = 1.8 <\tau _0$
 , which is sufficiently close to
$\tau _0$
 , illustrating the existence of bifurcating periodic solutions from the equilibrium point
$E^*$
 .
The trajectory of prey density over time is shown for the initial conditions
$E^*(x^*, y^*)$
 =
$(0.467,0.6102)$
 . When
$\tau = 1.8 < \tau _0,$
 where the steady state
$E^*$
 is asymptotically stable.

Figure 1 Long description
The line graph is plotted on a Cartesian coordinate system with a grid. The horizontal x-axis is labeled Time(t) and ranges from 0 to 350 in increments of 50. The vertical y-axis is labeled N(t) and ranges from 0 to 1 in increments of 0.1.
Data flow:
* The red curve begins near the origin at t = 0.
* It rises sharply to a primary peak of approximately 0.94 at t = 20.
* Following the first peak, the curve undergoes a series of damped oscillations. Each subsequent peak and trough is smaller in amplitude than the previous one.
* The oscillations occur around a central value of approximately 0.58.
* By t = 150, the oscillations become nearly imperceptible.
* From t = 200 to t = 350, the curve becomes a perfectly horizontal line, indicating that the system has reached an asymptotically stable steady state at N(t) approximately equal to 0.58.
The trajectory of the predator density over time is shown for the initial condition
$E^*(x^*, y^*) = (0.467, 0.6102)$
 . When
$\tau = 1.8 < \tau _0$
 , the steady state
$E^*$
 remains stable.

Figure 2 Long description
The graph is plotted on a Cartesian coordinate system with a grid.
* The horizontal x-axis is labeled Time(t) and ranges from 0 to 350 in increments of 50.
* The vertical y-axis is labeled P(t) and ranges from 0 to 0.5 in increments of 0.05.
Data Flow:
* The trajectory begins near the origin at t = 0 with a very low P(t) value.
* Between t = 0 and t = 25, there is a sharp exponential-like increase.
* Starting around t = 25, the curve enters a phase of damped oscillations. The first and highest peak reaches approximately 0.47, followed by a trough at 0.21.
* As time progresses toward t = 150, the amplitude of the oscillations decreases significantly.
* By t = 180, the oscillations cease, and the line becomes perfectly horizontal, indicating convergence to a steady state at a P(t) value of approximately 0.347. This stability continues through the end of the plot at t = 350.
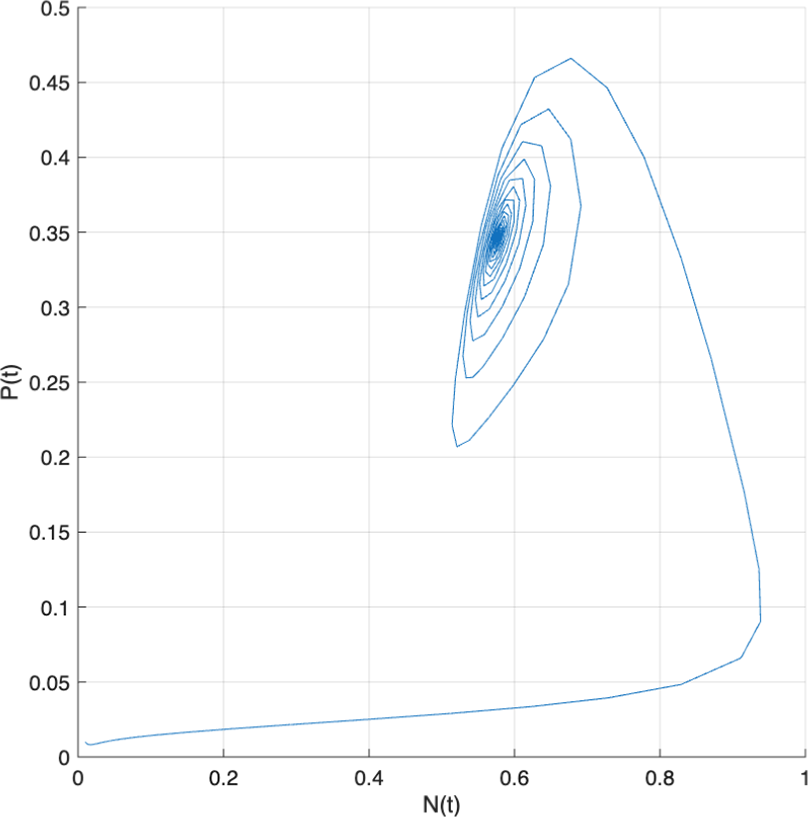
The trajectory and phase portrait corresponding to the initial condition
$E^*(x^*, y^*) = (0.467, 0.6102)$
 are presented. For
$\tau = 1.8 < \tau _0$
 , the steady state
$E^*$
 is asymptotically stable.

Figure 3 Long description
The line graph is plotted on a Cartesian coordinate system with a grid. The horizontal x-axis is labeled N(t) with values ranging from 0 to 1 in increments of 0.2. The vertical y-axis is labeled P(t) with values ranging from 0 to 0.5 in increments of 0.05.
A single blue trajectory line begins near the origin at approximately (0.01, 0.01). It moves horizontally to the right along the bottom of the graph until it reaches N(t) approximately 0.9. From there, it curves sharply upward and to the left, forming a large outer loop that peaks at P(t) approximately 0.47 and N(t) approximately 0.68.
The trajectory then continues to spiral inward in a clockwise direction. Each subsequent loop is smaller than the last, indicating an asymptotic approach to a central point. The spiral eventually converges and becomes highly dense at a steady state located at approximately N(t) equals 0.6 and P(t) equals 0.35.
The trajectory of prey density over time is shown for the initial conditions
$E^*(x^*, y^*)$
 =
$(0.467,0.6102)$
 . When
$ \tau =2.1,$
 where the steady state
$E^*$
 is converging.

5 Discussion and conclusion
In this study, we analyze the dynamics of a ratio-dependent predator–prey system incorporating a discrete time delay. The model exhibits a single positive equilibrium point
$E^*(x^*, y^*) = (0.467, 0.6102)$
 . Through linearization and the derivation of the characteristic equation, we establish the conditions under which the system undergoes a Hopf bifurcation. The corresponding transversality condition is verified, confirming the existence of a critical delay value
$\tau _0 = 2.1$
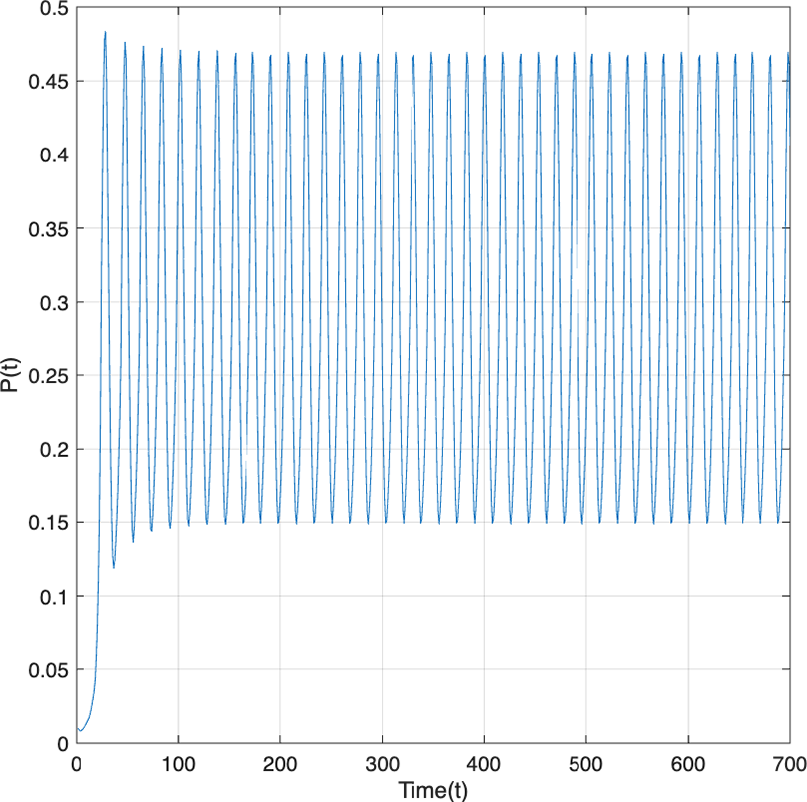
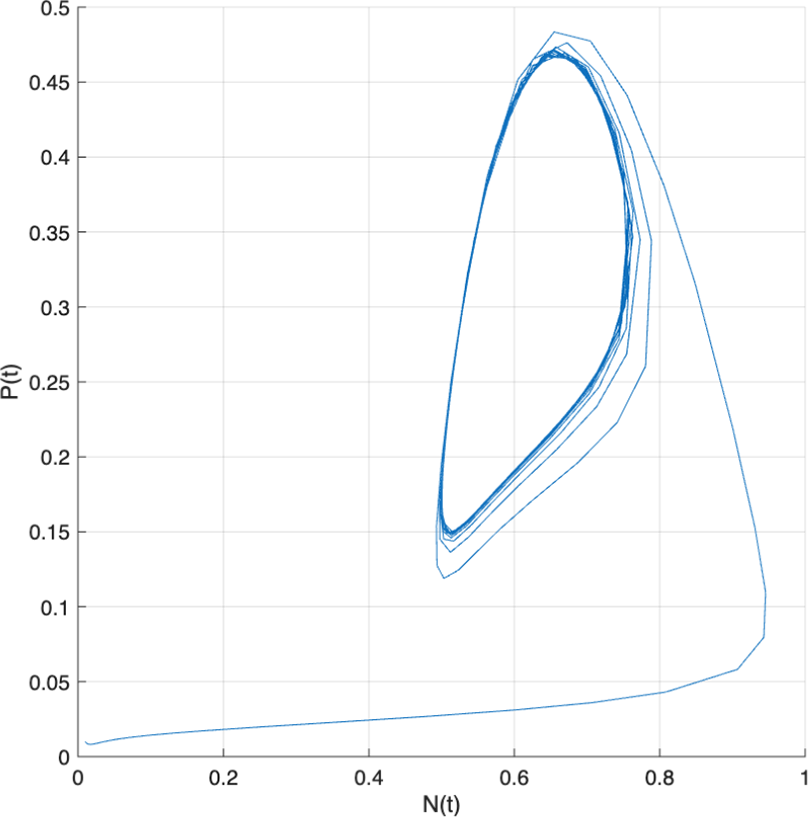
 at which the system transitions from asymptotic stability to instability. Figure 5 illustrates the dynamical behavior of the system for the chosen parameter values for the predator densities. Figure 6 presents the phase portrait corresponding to the analytical results (Figures 5 and 6).
The trajectory of predator density over time is shown for the initial conditions
$E^*(x^*, y^*)$
 =
$(0.467,0.6102)$
 . When
$ \tau =2.1,$
 where the steady state
$E^*$
 is converging.

The trajectory and phase portrait corresponding to the initial conditions
$E^*(x^*, y^*)$
 =
$(0.467, 0.6102)$
 . When
$\tau =2.1,$
 where the steady state
$E^*$
 is converging.

Numerical simulations conduct in MATLAB’s DDE solver further validate the theoretical findings. When
$\tau = 1.8$
 (
$\tau < \tau _0$
 ), the equilibrium
$E^*$
 remains asymptotically stable, as shown in Figures 1 and 2. Conversely, for
$\tau = 2.1$
 (
$\tau> \tau _0$
 ), the system exhibits periodic oscillations emerging from
$E^*$
 , consistent with the onset of a Hopf bifurcation, as illustrated in Figures 3 and 4. These results demonstrate the sensitivity of the system to variations in the delay parameter and highlight how time delays can induce complex oscillatory behavior in predator–prey interactions.
The Hopf bifurcation observed at
$\tau _0 = 2.1$
 is found to be supercritical, implying that a stable periodic solution bifurcates from the equilibrium point as the delay parameter surpasses the critical threshold. This finding underscores the importance of time delays in ecological modeling, where delayed feedback mechanisms often play a pivotal role in generating sustained population oscillations.
The analysis presents here builds upon classical approaches used in delay-differential models, such as the Holling–Tanner, Leslie–Gower, and Michaelis–Menten type systems [Reference Çelik5, Reference Karaoglu and Merdan11]. Our results align with previous studies [Reference Celik and Çekiç6, Reference Çelik and Merdan8], further supporting the robustness of Hopf bifurcation theory in capturing the transition from equilibrium stability to periodic behavior in biological systems.
Overall, the study provides both theoretical and computational evidence for the occurrence of a supercritical Hopf bifurcation in the delayed predator–prey model. The findings contribute to a deeper understanding of how delay-dependent mechanisms influence ecological stability and periodicity. Future research may extend this framework to multi-delay systems or investigate the impact of stochastic perturbations and parameter uncertainty on the bifurcation structure, enhancing the model’s applicability to real-world ecosystems.