Introduction
Legal adoption, historian Ellen Herman argues, was designed to ‘conquer chance and vanquish uncertainty’ (Herman, Reference Herman2008: 1). It sought to regulate a process which had previously been governed by the principles of a free market, principles that were the source of growing unease from the mid-nineteenth century as the child became increasingly invested with sentimental rather than economic value (Zelizer, Reference Zelizer1985). However, despite the best efforts of adoption professionals, the market has never completely disappeared, not least in the United States where a thriving industry of private providers has always existed alongside the professional agencies, but also in Australia where a sense of entitlement, often encased within a discourse of benevolence, has repeatedly surfaced to challenge existing adoption practice. This article investigates the nature of the market for children at a time when it was freely articulated, primarily through the use of newspaper advertisements which began to appear in major Australian newspapers in the middle of the nineteenth century.Footnote 1 It argues that advertisements provide an insight into the preferences, real and imagined, of people who sought to adopt, preferences that became more difficult to articulate when adoption came under professional control. Although Australian intercountry adoption is subject to just such control, the findings of this research provide insight into some of the expectations which applicants may bring to the process.
This research was both enabled and limited by the scope of the National Library of Australia's newspaper digitisation project, which to date has digitised 235 local, regional and national newspapers across Australia, from the early nineteenth through to the mid-twentieth century.Footnote 2 The collection currently includes complete runs of at least one major daily newspaper from every capital city, a more limited range from major regional centres and some suburban publications. The classified advertisement sections of all available newspapers were searched electronically using the primary search term ‘adopt’ with additional terms ‘orphan’, ‘baby’, ‘infant’, ‘boy’, ‘girl’, which produced a database of 15,132 unique entries published between 1860 and 1940. Advertisements were located in all the major dailies published in capital cities, and in ten regional newspapers. Only two advertisements have been located prior to 1860 and while advertisements continue beyond 1940, data collection and analysis for that period are not yet complete.
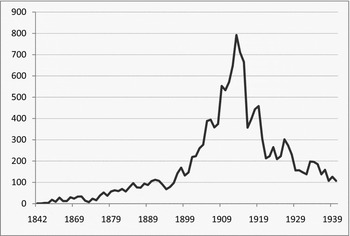
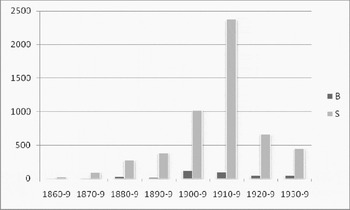
Mimicking a pattern already established in the United Kingdom, the advertisements are few at the beginning, increasing in number towards the end of the century, peaking in the first decade of the twentieth century and declining from that point on. Although not all of the children offered for adoption in the advertisements were illegitimate, the trend (see Figure 1) closely parallels the ex-nuptial birth rate in Australia during this period, peaking in the years immediately prior to World War I and declining from that point on (Swain and Howe, Reference Swain and Howe1995: 4).Footnote 3
Total advertisements 1842–1940.a

The early advertisements were diverse both in wording and placement, but settled relatively quickly into an established pattern which allowed those seeking to acquire or place children to locate and decode them easily. This article uses the categories of ‘buyers’ and ‘sellers’ to distinguish between these two groups. Although this terminology may seem inappropriate when it is considered that the commodity being traded is children, it clearly identifies the advertisements as a key part of what was essentially a market exchange. Location of advertisements within the newspapers varied between publications but the basic format of the advertisement became remarkably consistent, specifying what was being offered and what was being sought, and setting out a point of primary contact, most commonly a newspaper or post office box number. This basic construction was clear in the earliest advertisement in the database. Lodged in The Sydney Morning Herald it read:
WANTED, by a lady and gentleman, an intelligent destitute ORPHAN GIRL, about 10 years old, to adopt as their own. Early application is necessary. Apply by letter to X. Z., Newtown Post Office. (The Sydney Morning Herald, 1860: 8)
Although the language of the advertisements changed over time this basic structure is still apparent in the last of this sample, published in The Brisbane Courier-Mail in December 1940:
Family wishing to adopt young infant. References and circumstances on application. Box Z3 Courier Mail. (The Brisbane Courier-Mail, 1940: 12)
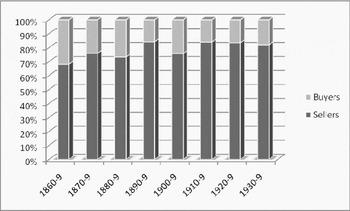
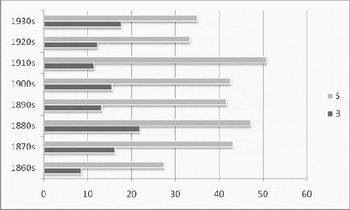
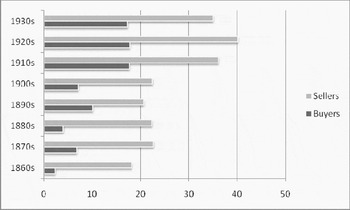
Advertisements from people seeking to adopt a child were always outnumbered by those from people with children available for adoption, a disparity which grew as the number of advertisements increased (see Figure 2).Footnote 4 However, it is important to consider both sets together, for in a sense they were mutually constitutive. The ‘sellers’ tried to frame their advertisements to most closely match the expressed preferences of those who were seeking to acquire a child. Although, presumably, most ‘sellers’ advertised only one baby during their lives, a substantial proportion of the advertisements were placed by intermediaries, midwives, ‘baby farmers’, charity workers and, in some cities, State Children's Department officials, all of whom developed an awareness of ‘buyer’ preferences and crafted their advertisements accordingly.
Percentage of buyers and sellers by decade.

While, until the 1920s, the term adoption was tarnished through its association with baby farming locally and internationally, it was used in newspaper advertisements to signify permanence, and a concomitant lack of interference from birth families, not available through conventional placing-out practices. Although only the state of Western Australia had adoption legislation in place prior to the 1920s, well-to-do couples in other states and colonies were able to engage solicitors to draw up agreements which encapsulated this expectation. Charitable organisations and the various state children's departments also introduced a form of adoption as part of the boarding-out policies applied across Australia from the late 1870s. The term was used to distinguish children taken without payment, and without the associated supervision which applied to those for whom weekly payments were made. Such placements were usually made without recourse to advertisement, although the South Australian and later the Queensland departments, occasionally, and the Western Australian department, with great regularity, used the newspapers as a recruitment resource, as did some charitable organisations dealing with children judged to be in need of protection.
An 1881 article, designed to popularise the practice of benevolent adoption, suggested that it had the potential to meet multiple needs. Describing the current practice in South Australia it noted:
Not only do childless couples and lone widows adopt these waifs, but some who have only boys adopt a girl, or a family of girls persuade their parents to adopt a brother for them. A dying boy asked his sorrowing mother and father to choose a boy from ‘The Destitute’, and to save his clothes and his toys for him. Old couples, whose children have grown up and left them will adopt a likely boy or girl for company whom they can train to be useful; and sometimes as a thank offering for prosperity they will take one or two children to bring up in the fear and love of God. (The Brisbane Courier, 1881: 6)
The evidence from the newspaper advertisements, however, suggests a much more specific list of desired characteristics which rarely corresponded with what was available.
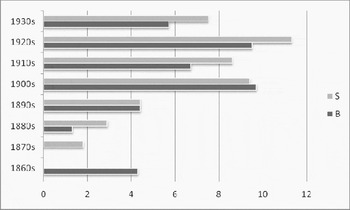
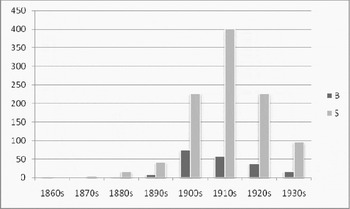
The two major points of dissonance were around age and gender. Ellen Herman has argued that in the United States potential adopters wanted babies, newborn if possible (Herman, Reference Herman2008: 39). Australian adopters were more cautious. As methods of artificial feeding became more reliable a market for newborns, with the adoptions arranged in advance, did develop, but there were always far more being offered than being sought (see Figures 3 and 4). Interestingly the proportion in both categories declined in the 1930s. In the newly introduced legal adoption, children were not placed until they were at least 18 months old, by which stage adoption professionals were able to boast of their ability to provide a ‘guaranteed product’ whose bad habits had been corrected, and ‘inherited traits’ and ‘physical disabilities’ detected and, if possible, overcome (Swain and Howe, Reference Swain and Howe1995: 132). The shift in advertisers’ age preferences would suggest that such propaganda was having an impact in the unregulated market as well.
Percentage of ‘from birth’ advertisements by buyers and sellers and decade.

Total ‘from birth’ advertisements by buyers and sellers and decade.

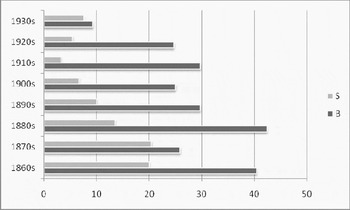
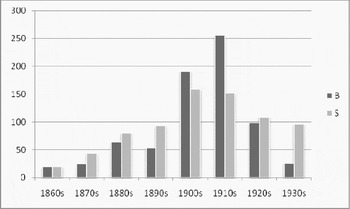
This gap between buyers and seller preferences intensified after the baby had been born. While babies under six months of age constituted an increasing proportion of those on offer, buyers showed no great enthusiasm to take them on (see Figure 5). In absolute terms this left large numbers of babies for whom no apparent demand existed (see Figure 6). At the other end of the age scale, the reverse is the case. In percentage terms, buyers were far more like to be seeking a child over the age of five than there were parents or guardians offering them (see Figure 7), with the disparity increasingly becoming apparent in absolute numbers as well (see Figure 8). Although there is no contemporary commentary on the reasons for this disparity, the wording of the advertisements does provide some clues, with older children sought for their intelligence, companionability and sometimes their labour skills, while the advertisements for infants make much of their health or fitness. Perhaps, if the opportunity to pre-order a baby was past, the child whose qualities were both established and apparent was a safer option than a demanding infant who, at the time, even parents struggled to keep alive.
Percentage of advertisements for infants 0 to 6 months by buyers, sellers and decade.

Total advertisements for infants 0 to 6 months by buyers, sellers and decade.

Percentage of advertisements for children 5+ by buyers, sellers and decade.

Total advertisements for children 5+ by buyers, sellers and decade.

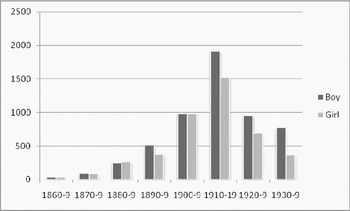
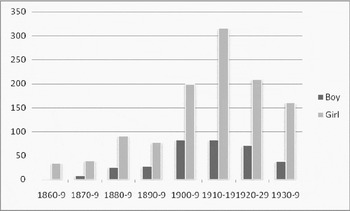
The dissonance around gender preference is apparent in the earliest of the advertisements and remains unshaken through to today. Where parents in western cultures anticipating the birth of their first child commonly express a preference for a boy, for adoptive parents the reverse was, and is, the case. While amongst the children offered for adoption through the advertisements the gender split is generally even (see Figure 9), buyers express a distinct preference for girls throughout the period collated to date (see Figure 10).
Total advertisements by gender preference, sellers and decade.

Total advertisements by gender preference, buyers and decade.

This finding is consistent with other research both in Australia and overseas (Melosh, Reference Melosh2002: 54; Murray, Reference Murray2004: 274). An appeal for people willing to adopt Belgian orphans in the early years of World War I produced requests which seemed to its promoters ‘surprisingly specific’. Although the responses came from ‘all classes and conditions of people . . . most came from women who were childless, or who wanted to acquire a child as a companion for their existing children . . . [with] the great majority’ asking for girls between the age of two and five (The Brisbane Courier, 1914: 7). During the early years of legal adoption, when children far exceeded applicants, agencies observed a similar trend. In 1929, the officer in charge of adoptions in the Western Australian State Children's Department observed: ‘most people seemed inclined towards baby girls, and in most cases blue eyes were considered an asset. Baby boys had not been nearly so much in demand’ (The West Australian, 1929: 14). In Melbourne, seventy-two of the first eighty-seven children adopted from Mission of St James and St John were girls (The Argus, 1929: 17).
Prospective parents may have been willing to foster a boy, but it would seem that it was girls that they were prepared to accept fully into their families (Swain and Howe, Reference Swain and Howe1995: 135). Early advocates of adoption suggested that perhaps girls were preferred because they provided company for mothers, but added, somewhat more darkly, that they ‘place less responsibility on foster parents later in life’ (The Argus, 1941: 8). Concerted campaigns to persuade prospective parents of the advantages of adopting a boy, drawing on arguments derived from economics, psychology and theology – even Christ was an adopted child – had little effect. Girls continued to be ‘snapped like star bargains’, leaving boys to be passed into institutional care (Swain and Howe, Reference Swain and Howe1995: 139).
More recent scholarship continues to struggle with this phenomenon. When asked, the most common response from adoptive parents of both genders is an ‘inexplicable preference’ for a girl (Goldberg, Reference Goldberg2009: 62). To some writers, this inexplicable preference is a rational choice, based on the higher levels of behavioural disorders amongst boys, but others point to more complex explanations grounded in patriarchy, suggesting that men are less concerned about gender once the blood tie and the possibility of passing on their masculine genetic characteristics is removed (Gravois, Reference Gravois2004). On a similar line, both men and women, it is postulated, find it less threatening to take a female rather than a male ‘stranger’ into the family (Melosh, Reference Melosh2002: 61). If, as is assumed in such scholarship, women are the driving force in adoption and men the followers, the latter's disinterest, it is argued, renders them less likely to oppose a woman's preference for a girl (Goldberg, Reference Goldberg2009: 57). A darker side of such explanations is the reluctance to risk the reputation of the family on the adopted child. Thus a girl who may hold the family name only until marriage represents less risk than a boy who carries it on to the next generation. Whatever the explanation, the impact of this gender preference was, and remains, to increasingly commodify children while diminishing the chances of adoption for males.
Another distinction which continues in debates around adoption today can be seen in the conflicting understandings of the nature of the market. Potential adopters were entrapped in an ‘orphan illusion’, the notion that there were large numbers of orphaned children in need of a home, while the sellers entertained a similar illusion about the existence of refined ladies in search of their children. Both illusions functioned to disguise the nature of the transaction in which they were engaged. While the percentage of advertisements requesting or offering an orphan declined consistently, the disparity between supply and demand remained surprisingly constant (see Figure 11). The decline reflected awareness that declining adult mortality rates were rendering orphans a scarce phenomenon. However the continuing aspiration for the orphan amongst adopters points to the potency of the illusion. The promise of a child without attachments minimised the possibility that the placement might be interrupted, but it also neutralised the circumstances through which the child became available, denying the pain, and perhaps also the injustice underlying a mother's actions in relinquishing her child. The orphan, like the foundling, was the adoptive parents’ ideal, free of parents who might reappear to reclaim him, and also of the unfortunate associations that such real parents might bring. Hence the orphan could be re-imagined as the child the parents might have had, even if the reality was very different (Berebitsky, Reference Berebitsky1994: 19). As some commentators note, the orphan myth remains alive in discourse promoting intercountry adoption (Cuthbert et al., Reference Cuthbert, Spark and Murphy2009).
Percentage of advertisements offering or seeking orphans by sellers, buyers and decade.

For relinquishing parents the ‘lady’ of the adoption advertisement served a similar purpose, placing the child in an imagined comfortable home, with promising prospects, assuring a future which even the most loving of mothers was unable to provide. The alternative reality, that the people who answered such advertisements were likely to occupy a more lowly status, or, at worse, were baby farmers intent on procuring the child in order to pass it on at a profit, could not be contemplated.
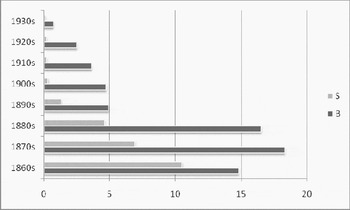
In part, these illusions are linked to a more concrete concern about the ‘quality’ of the product on offer. The implications of quality changed over time, but, at least initially, related far more to issues around respectability and social class than to health and heredity. Both sellers and buyers reference such concerns, with the interest amongst buyers clearly varying in line with negative publicity about baby farming, which peaked at the turn of the century (see Figure 12).
Percentage of advertisements referring to respectability by sellers, buyers and decade.

Prospective parents were looking for children of gentle, genteel, refined or superior birth, the product of good, respectable, superior or even excellent homes, with children born in wedlock and free of the stain of illegitimacy, particularly prized (hence again the appeal of the orphan). Anxious to cast their interest as benevolent, they projected possible explanations for the need to relinquish children amongst such respectable families, the sudden death of an otherwise respectable partner being the most popular. Sometimes they also specified the characteristics they were looking for in such superior children: education, standards of behaviour and accomplishments. Sellers constructed their advertisements within a similar set of assumptions, setting out plausible reasons for separating from the child and making claims for its respectability. The child of a minister, teacher or other educated person was clearly positioned as superior. During and after World War I, the ‘soldier's child’ attained a similar status. Given the complex process through which children changed hands, it would have been difficult to test any such claims, but the promise of references, used by both sides, was clearly designed to minimise any alarm.
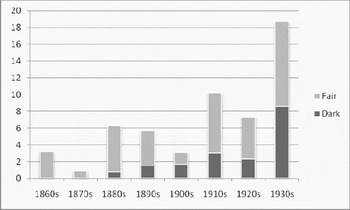
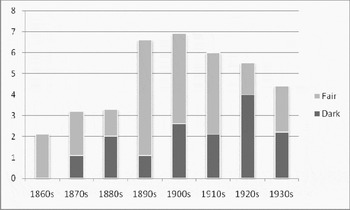
Ethnicity, too, was used as a marker of respectability, with English clearly holding a higher status, although French presumably brought some exotic value. More usually, however, ethnicity or race was coded within references to complexion, in particular hair and eye colour. Complexion was a factor which sellers could not control, but their choice as to whether or not to make reference to it in an advertisement indicated a keen, perhaps exaggerated understanding of its importance to the potential parent (see Figures 13 and 14). Although reference to complexion was made in less than 10 per cent of advertisements, it was clearly seen as being of increasing importance, particular amongst those seeking to place their children. Characteristics associated with a fair complexion (fair hair, blue eyes) predominated throughout, although prospective adoptive parents seem more tolerant of a dark complexion than sellers imagined. Presumably, sellers chose to mention in the advertisement characteristics that they thought would attract the best possible buyers. Buyers, however, were looking for a specific child and this created a space for requesting a child of darker complexion, perhaps as a replacement for a deceased child, or as a match for their own colouring, much as later adoption practice would seek to do. In some cases, there may also have been an element of exotica, with prospective parents seeking a child with very particular racial features.
Percentage of advertisements referring to complexion by sellers and decade.

Percentage of advertisements referring to complexion by buyers and decade.

The key silence in this context surrounds Indigenous children, subject, particularly in the twentieth century, to aggressive removal policies (Haebich, Reference Haebich2000). As the largest group of non-white children in the country, they were, presumably, the target of coded references, both positive and negative, around colour, although very rarely specifically identified as such. In this context, it is significant that child welfare authorities in Western Australia, a state with both a large Indigenous population and one of the most highly developed removal policies, most clearly understood the importance of racial and ethnic markers in appealing to prospective buyers, including detailed descriptions of both complexion and ethnic origin in a high proportion of the advertisements which they lodged.
The most common reference in the advertising, however, was not to appearance but to sturdiness. The dangers associated with artificial feeding, at least until the early years of the twentieth century, rendered adoption a risky venture and advertisers on both sides sought to minimise the risk. Although the level of concern amongst prospective adopters about health was clearly rising, they were far less likely to mention it than were the sellers (see Figure 15).
Percentage of advertisements referring to health by sellers, buyers and decade.

Partly the explanation may again be aspirational. Parents separating from their children, or the midwives or other agents assisting them to do so, needed to hope that the child would survive, despite the grim evidence to the contrary at least in the nineteenth century. In contrast to the media depictions of sickly babies being assisted through adoption to an early death, they sought to portray the child to potential adopters as a worthwhile investment, one that would bring their family happiness rather than grief. A second element to such presentation was the promise of security with phrases such as ‘entirely given up’, ‘as own’ and ‘no further claim’ increasingly invoked. Such portrayals tended to advance the chances of the healthy, able child in a market in which supply far exceeded demand, setting a pattern for adoption that would continue until well into the second half of the twentieth century, when a drop in supply forced adoption professionals to reconsider the promise of the perfect baby that had so underwritten their success.
The lesser importance placed in buyers’ advertisements on the issue of fitness, points to another component of the understandings of adoption evident in the data, the contestation between economy and sentiment. Combined with the preference for older children, the reduced emphasis on health may indicate that for many prospective adoptive parents, the transaction was still to take on its emotional import. Advertisements offering children for adoption were suffused with the language of sentiment, using terms like ‘kind’, ‘motherly’ and ‘loving’ in describing the substitute parents they were seeking. Women practising as baby farmers played on this aspiration, invoking notions of kindness in their self description in advertisements designed to have mothers entrust children to their care. However, many of the people who advertised for children to adopt were more utilitarian in their approach, invoking the term ‘useful’ and listing the education and training opportunities that they could offer a suitable child. This ambivalence around the purpose of adoption is evident in the way in which newspapers handled the advertisements, more usually in the early years lodging them in employment-related columns. Over time, however, The Argus, The Sydney Morning Herald and later The Brisbane Courier-Mail, chose to concentrate them under the heading ‘miscellaneous’, a column they shared with fortune tellers, herbalists and purveyors of miracle cures.
Such ambivalence underlay deeper concerns about the function and risks of adoption. Commenting on the many offers to adopt a boy who appeared in the Port Adelaide Juvenile court in 1917, posing as a French waif, The Advertiser noted the less than salutary motivation of some of the applicants: ‘Some of the writers, under the cloak of charity, apparently endeavouring to secure cheap labour, and others seem to be genuinely moved by the pitiful story the boy told.’ One farmer, for example, wrote: ‘I would look after him and care for him as if he were one of my own children. I should like to have him soon, as the season is so wet, and I am late with seeding’ (The Register, 1917: 6). It would be wrong to position such motives in opposition to each other. It was not uncommon for children to be expected to contribute to the family economy, and for working-class children this expectation was all but universal. However, by the beginning of the twentieth century, education was replacing labour as the primary focus of a child's life and parents who put their children to work became the subject of censure. Where, in the early years, it was acceptable to seek to adopt a girl to assist with housework or suggest that a willingness to work in a boy would lead to a ‘chance for life’, by the early years of the twentieth century such advertisements would be used as evidence of the need for adoption to be brought under official regulation. The fact that a poultry farmer needed to repeat his advertisement seeking to adopt a bright girl to work on his farm ten times over the last two months of 1935 would suggest that such endeavours had had some success (Townsville Daily Bulletin, 26, 27, 28 November, 4, 5, 7, 9, 10, 11, 13 December 1935) − the practice of using adoption to obtain cheap labour had clearly fallen into disfavour.
Advocates of legal adoption argued that by bringing the practice under professional control they could eliminate its more negative aspects, ensuring that adoption was focused on the needs of the child rather than the desires of the adopting parents. However, the tendency for parental preferences expressed in newspaper advertisements to persist over time would suggest that professional adoption did not contest, but rather sought to work with these preferences, dismissing as unadoptable all but the fit, healthy, non-delinquent child free of parental ties. Although there is evidence in the social work literature of the need to ‘educate’ parents to overcome preferences or expectations that were seen as being unrealistic, there is little evidence of such ‘education’ having an impact (Duffy, Reference Duffy1953). The shift when it came in the late 1960s was more a reaction to a change in the market, than to any active education. While in part this shift saw adoption opened up to categories of local children previously considered unadoptable – children with so-called ‘special needs’ – the majority of potential adopters turned their attention to intercountry adoption where both the deeply ingrained preferences as to age and gender, and the illusions around orphans and origins, could again come into play (Cuthbert et al., Reference Cuthbert, Spark and Murphy2009).
Adoption has always existed in an uneasy relationship with the expectations of a market that continues to be officially denied. Why do we feel uncomfortable about the notion of a market? In a much-cited article, first published in 1984, Canadian scholar J. Robert Prichard draws a distinction between the practical objections to the notion of a market in children and objections in principle. The former, mostly variations of the argument that a market would not work, can, he argues, be easily dismissed, but the latter, the notion that the essence of the value of the child is that it cannot be bought and sold, are more deeply ingrained (Prichard, Reference Prichard1984). In the years since this article was published, the in principle objections have been increasingly encroached upon with the pressures of the market pushing constantly against the attempts of professionals or gatekeepers to maintain the distinction between the child and other market commodities. Under the cloak of a discourse of benevolence, through the construction of a world awash with children in need of rescue adoptive parents have been consistently successful in asserting their right to a child, and pressuring governments to relax controls on intercountry adoption accordingly. The goal of this paper has been to trace the genealogy of such campaigns by going back to a time when adoption was a market, and market aspirations could be openly articulated. Only by recognising that such market forces survived, despite the increasing regulation of adoption, can we argue against attempts to elevate a potential parent's need for a child over the needs of a child for a safe, culturally and emotionally secure home.