I. INTRODUCTION
Metastable intermolecular composites (MICs) are a class of energetic materials consisting of an intimate mixture of fuel and oxide that have nanoscale dimensions, such as nanosize Al/MoO3 that Al is nucleus and MoO3 shell. The reduction of particle size will induce significant changes in the kinetics and reaction propagation characteristics compared with conventional thermites comprised of the same compositions in micron size range (1–100 μm).Reference Aumann, Skofronick and Martin1 They are highly exothermic, exhibiting high-energy densities, wide range of tenability, ignition delay times reduced by three orders of magnitude,Reference Granier and Pantoya2 larger amounts of energy (ΔH = 4705 kJ/kg),Reference Bockmon, Pantoya, Son, Asay and Mang3 and much faster propagation velocity (close 1000 m/s) features compared with traditional thermite.Reference Bockmon, Pantoya, Son, Asay and Mang3–Reference Plantier, Pantoya and Gash6 It has potential for use in a wide range of applications. Especially, in some areas such as environmentally clean (lead-free) primers and detonators, chem/bio agent neutralization improved rocket propellants and thermal batteries. The development in the preparation of MICs also has many excellent methods, such as solid phase reaction, arrested reactive milling, spray pyrolysis, and sol–gel method, and so on. The door is opened for the consideration of new applications for those materials.
But, MICs reaction mechanism is not clearly known. LevitasReference Levitas7 and Levitas et al.Reference Levitas, Pantoya and Dikici8 proposed melt-dispersion and convective combustion mechanisms that were very important to illustrate the combustion mechanism. There are a number of factors that can potentially change the combustion of these systems, and lots of experimental studies have been reported for nano-Al/MoO3 and other MICs,Reference Granier and Pantoya2,Reference Bockmon, Pantoya, Son, Asay and Mang3,Reference Michelle, Steven, Wayne, Betty, Blaine, James and Joseph5–Reference Levitas7,Reference Levitas, Asay, Son and Pantoya9 but the theoretical calculation or simulation is few. For this reason, in-depth research on the mechanism needs to be continued. We can study it on electronic or atomic level, and there is no doubt that calculation done through first-principle quantum mechanical method gives more accurate result. Because it needs a large computational effort to accurately solve the Schrödinger equation, this method is currently limited to the studies of static properties for systems involving only a few hundreds of atoms at 0 K. But, the classics molecular dynamics (MD) method can overcome the above complex computation process by using a simple empiricism function, and the unique vividness and explicitness, spatial, or time-resolution properties will be obtained by the simulation, some of which will not be observed in the experiments, such as the transport process of the reaction atoms. When the simulation combines the experiment, more clearing combustion mechanism about those MIC materials can be obtained. At the same time, other computational experiments can be carried out, such as how particle size and its distribution influence the properties (ignition time, quantity of heat, propagation velocity and others).
The basis of achieving the above work result is that we need a good potential, used in MD, to describe the chemical reaction during the combustion process. Up to now, a great growth in the empirical potentials, but most of them cannot describe a reaction when atoms' surrounding has extreme changes, except three potentials or methods, namely tight-binding method,Reference Goringe, Bowler and Hernández10 embedded-atom method (EAM),Reference Daw, Foiles and Baskes11–Reference Daw and Baskes15 and reactive force field (ReaxFF) based on the bond order.Reference van Duin, Strachan, Stewman, Zhang, Xu and Goddard16–Reference Johnston and Parr25
Tight-binding theory may be justified as an approximation to density functional theory (DFT), especially by using the noniterative formulation of Harris and Foulkes. And it has been applied in many systems, such as metals, semiconductor, fullerenes, and ionic materials, reviewed in Ref. Reference Goringe, Bowler and Hernández10.
Daw and BaskesReference Baskes, Foiles and Daw12–Reference Daw and Baskes15 made an important embedding energy plus electrostatic interactions, which is based on DFT and quasi-atom theory. There are many papers to research the high-energy reaction with the EAM potential.Reference Zhao, Germann and Strachan26–Reference Wu and Zhao29 It is notable that the EAM potential will not work well here, as the system has directional bonding, such as Mo–O and Al–O bond.
ReaxFF was initially developed to simulate the MD of large-scale reactive chemical systems for hydrocarbons.Reference van Duin, Dasgupta, Lorant and Goddard17 The optimized potential was used to simulate the RDX reaction at high temperature and pressure, and the NO, CO2, and CO, etc. oxidationsReference Strachan, Kober, van Duin, Oxgaard and Goddard30,Reference Strachan, van Duin, Chakraborty, Dasgupta and Goddard31 were observed. ReaxFF potential is based on the bond order, which can reflect the bond properties of the covalent compounds; and it is not intuitively suited to the metallic or the alloy system. Wide range of systems, including covalent,Reference van Duin, Dasgupta, Lorant and Goddard17,Reference Strachan, van Duin, Chakraborty, Dasgupta and Goddard31–Reference van Duin, Zeiri, Dubnikova, Kosloff and Goddard35 metallic,Reference Jarvi, Kuronen, Hakala, Nordlund, van Duin, Goddard and Jacob36 and (partially) ionic materials,Reference Cheung, Deng, van Duin and Goddard37,Reference Zhang, Çaǧın, van Duin, Goddard, Qi and Hector38 have been successfully parameterized to simulate the physical and chemical behaviors of various materials, such as combustion of hydrocarbon,Reference van Duin, Dasgupta, Lorant and Goddard17 shock detonation of energetic materials,Reference Strachan, van Duin, Chakraborty, Dasgupta and Goddard31 thermal decomposition of polymers,Reference Chenoweth, Cheung, van Duin, Goddard and Kober33 proton and oxide transport in fuel cell membranes,Reference Goddard, Merinov, Van Duin, Jacob, Blanco, Molinero, Jang and Jang39 catalytic formation of carbon nanotubes and dissociation of hydrogen over metals,Reference Nielson, van Duin, Oxgaard, Deng and Goddard34,Reference Ludwig, Vlachos, van Duin and Goddard40 catalytic selective oxidation of hydrocarbons over metal oxides surface,Reference Goddard, Chenoweth, Pudar, van Duin and Cheng41 and photocatalysis of water over metal oxides surface.Reference Raymand, van Duin, Goddard, Hermansson and Spangberg42–Reference Raymand, van Duin, Baudin and Hermansson44
EAM does not work well in the covalent system, although it has been applied in silicon and carbon element. And the tight-binding is not suitable to construct an approximate model that is suit to describe the various bond types and the chemical reactions where the circumstances of the reacting atoms change extremely.
Although ReaxFF is not intuitive to describe the metallic bond type, it has been widely used in a variety of materials as mentioned above. Therefore, ReaxFF is the barely satisfactory potential to simulate the reaction of MICs. And this paper focuses on obtaining the ReaxFF parameters of aluminum–molybdenum alloy of Al/MoO3 system, and then some properties are calculated to illustrate the parameters scope of application. And the Mo–O bond, Al–O–Mo angle terms, and simple simulations will be carried out in the near future, while the related Al-O parameters have been development.Reference Zhang, Çaǧın, van Duin, Goddard, Qi and Hector38, Reference Shin, Kwak, Zou, Vasenkov and van Duin45–Reference Shin, Kwak, Zou, Vasenkov and van Duin47
In the next section of this contribution, the ReaxFF will be explained, and the computational details in our calculation are showed. In the third section, we present the reproduced results and discuss them. In the fourth section, defects energy, such as vacancy formation and surface energy, elastic constant, and phonon spectra are calculated to predict the structures’ stability through the structures’ mechanical and dynamic stability. Finally, conclusions of this paper will be drawn.
II. METHODOLOGY
A. ReaxFF
ReaxFF is a bond-order potential, corresponding to the bond-order concept firstly introduced by Tersoff.Reference Tersoff48 Bond, angle, and dihedral angle energies are calculated by ReaxFF though the bond order, the mainly related energy expression are listed as follows:
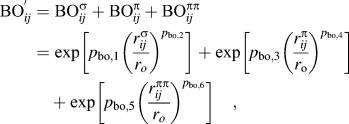 $$\eqalignb{ {\rm{BO}}_{ij}^' = {\rm{BO}}_{ij}^{\rm{\sigma }} + {\rm{BO}}_{ij}^{\rm{\pi }} + {\rm{BO}}_{ij}^{{\rm{\pi \pi }}} \cr = \exp \left[ {p_{{\rm{bo}},1} \left( {{{r_{ij}^{\rm{\sigma }} } \over {r_o }}} \right)^{p_{{\rm{bo}},2} } } \right] + \exp \left[ {p_{{\rm{bo}},3} \left( {{{r_{ij}^{\rm{\pi }} } \over {r_{\rm{o}} }}} \right)^{p_{{\rm{bo}},4} } } \right] \cr\,\,\,\,\,\,+ \exp \left[ {p_{{\rm{bo}},5} \left( {{{r_{ij}^{{\rm{\pi \pi }}} } \over {r_o }}} \right)^{p_{{\rm{bo}},6} } } \right]\quad, \cr}$$
 $$E_{{\rm{bond}}} = - D_{_e }^{\rm{\sigma }} \cdot {\rm{BO}}_{_{ij} }^{\rm{\sigma }} \cdot \exp [p_{{\rm{be}}1} (1 - ({\rm{BO}}_{ij}^{\rm{\sigma }} )^{p_{{\rm{be}}2} } )] - D_e^{\rm{\pi }} \cdot {\rm{BO}}_{ij}^{\rm{\pi }} - D_e^{{\rm{\pi \pi }}} \cdot {\rm{BO}}_{ij}^{{\rm{\pi \pi }}}\quad ,$$
 $$E_{{\rm{val}}} = \,\,\,f_7 ({\rm{BO}}_{ij} ) \cdot f_7 ({\rm{BO}}_{jk} ) \cdot f_8 (\Delta _j ) \,\,\cdot \{ p_{{\rm{val}}1} - p_{{\rm{val}}1} \exp [ - p_{{\rm{val}}2} (\Theta _{\rm{o}} ({\rm{BO}}) - \Theta _{ijk} )^2 ]\} \quad,$$
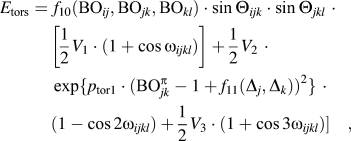 $$\eqalignb{ E_{{\rm{tors}}} = \,& \,f_{10} ({\rm{BO}}_{ij} ,{\rm{BO}}_{jk} ,{\rm{BO}}_{kl} ) \cdot \sin \Theta _{ijk} \cdot \sin \Theta _{jkl} \,\,\cdot \cr &\left[ {{1 \over 2}V_1 \cdot (1 + \cos {\rm{\omega }}_{ijkl} )} \right] + {1 \over 2}V_2 \,\,\cdot \cr &\exp \{ p_{{\rm{tor}}1} \cdot ({\rm{BO}}_{jk}^{\rm{\pi }} - 1 + f_{11} (\Delta _j ,\Delta _k ))^2 \} \,\,\cdot \cr &(1 - \cos 2{\rm{\omega }}_{ijkl} ) + {1 \over 2}V_3 \cdot (1 + \cos 3{\rm{\omega }}_{ijkl} )]\quad, \cr}$$
where actually parameter meaning can be found in Ref. Reference Chenoweth, van Duin and Goddard49.
Eq. (1) is the uncorrected bond order that three different bond orders are obtained from the interatomic distances. If the bond order falls under approaches or exceeds the number of valence electrons for the element, which is obtained by summing up all bond orders the atom is involved in, it will be corrected. Then, atoms’ bond order will be used as basic variables to describe valence interactions, and the expressions are like Eqs. (2)–(4).
There are repulsive interactions at short interatomic distances and attraction energies at long distances due to dispersion, which is in addition to valence interactions. Van der Waals and Coulomb forces constitute the nonbonded interactions. Distance-corrected morse potential is used to describe it, shown in the following Eq (5). And the full set of ReaxFF equations can be found in Ref. Reference Chenoweth, van Duin and Goddard49 for a complete description.
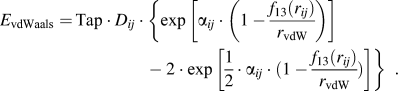 $$E_{{\rm{vdWaals}}} = \,{\rm{Tap}} \cdot D_{ij} \cdot \{ {\exp [ {{\rm{\alpha }}_{ij} \cdot ( {1 - {{f_{13} (r_{ij} )} \over {r_{{\rm{vdW}}} }}} )} ] - 2 \cdot \exp [ {{1 \over 2} \cdot {\rm{\alpha }}_{ij} \cdot ( {1 - {{f_{13} (r_{ij} )} \over {r_{{\rm{vdW}}} }}} )} ] \}\,\,\,.$$
The van der Waals nonvalence interaction contributes to the bond energy, whose interaction range is larger than the bond interaction. So, it is an extremely important term to describe the nonbonded interaction in this region. This approach strongly correlates the nonbonded and bond order-based valence interactions, which complicates force field development and confuses the physical meaning of the force field parameters, but it has the advantage that the van der Waals interactions directly contribute to the transition state energies. Furthermore, the van der Waals repulsion effectively turns into a density-based term at short distances, as commonly presented in FF-methods for metals, thus facilitates ReaxFF transfer to metallic materials.
B. Quantum mechanics methods
In order to parameterize ReaxFF, we performed a number of periodic DFT calculations. As described elsewhere,Reference van Duin, Dasgupta, Lorant and Goddard17,Reference Strachan, van Duin, Chakraborty, Dasgupta and Goddard31,Reference Nielson, van Duin, Oxgaard, Deng and Goddard34,Reference Cheung, Deng, van Duin and Goddard37,Reference Zhang, Çaǧın, van Duin, Goddard, Qi and Hector38 all DFT calculations were performed at T = 0 K using DFT, without zero-point correction. We compared the ReaxFF's value at 0 K with the DFT or experiment's to optimize the parameters.
We used the generalized gradient approximation to DFT and a plane wave basis with a kinetic energy cutoff of 520 eV. The Kohn–Sham equations were solved using the Vienna Ab Initio Simulation package (VASP).Reference Kresse and Furthmuller50–Reference Kresse and Hafner53 The valence electron and core interactions were described using the projector augmented wave method.Reference Blöchl54 The PW91 exchange-correlation functionalReference Perdew, Chevary, Vosko, Jackson, Pederson, Singh and Fiolhais55 with the Vosko–Wilk–Nusair interpolation for correlation part was used. The relaxations were assumed to have converged when the energy in two consecutive ionic relaxation steps differed by <100 µeV. Integrations in reciprocal space are according to the Monkhorst–Pack scheme, and reasonably converged grid spacing and numbers of k-points were used, such as Mo-bcc (15 × 15 × 15) and B32(MoAl) (15 × 15 × 15). Both the k-point density and energy cutoff were verified to give the total energy convergence of 1 meV or better. Quasi-Newton (variable metric) and conjugate-gradient algorithms were used to relax the ions into their instantaneous ground state.
Before static point calculation, we had used VASP to optimize the structures of pure Mo and Al–Mo alloys, whose initial structures were obtained from the experimental or assumptive structures. And then, homogeneously scaling of the equilibrium structures with lowest energy and approximate zero pressure were executed.
III. RESULTS AND DISCUSSION
A. Development of ReaxFF
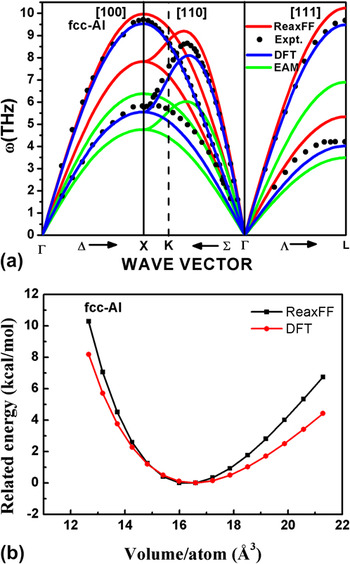
For training the force field parameters to describe the MICs reaction, we began with the parameters of Al/AlO,Reference Zhang, Çaǧın, van Duin, Goddard, Qi and Hector38 which has been successfully applied to aluminum clusters and Al/α–Al2O3 interface.Reference Zhang, Çaǧın, van Duin, Goddard, Qi and Hector38,Reference Ojwang, van Santen, Kramer, van Duin and Goddard56 To examine the aluminum parameters, equation of states (EOS) of aluminum and its phonon dispersion curve were drawn in Fig. 1. From Fig. 1, the reproduced result is very well and also illustrates that aluminum's parameters are well to simulate. For an accurate description of MICs reaction about the Al–O–Mo system, the Mo–Al alloy parameters should be optimized, by fitting an extensive set of heat of formation and geometry data. DFT value comes from calculating the structures of a15-Mo, bcc-Mo, fcc-Mo, Al12Mo, AlMo3, and the B2(AlMo), B32(AlMo). Although some of the structures are not experimentally realizable, it is important that ReaxFF is able to identify them as energy unstable so that it avoids them in simulations by recognizing their high-energy point.
Aluminum’s phonon dispersion and EOS curve are listed in (a) and (b), respectively.

Because the parameters in ReaxFF are too many to use the general numerical method to be optimized, so the ReaxFF developers use their proposed “single-parameter” methodReference van Duin, Baas and van de Graaf57 to optimize them, namely the thought of least square optimization, parabola extrapolation method, and one parameter optimized per iteration among the processes of self-consistent. And it is finished when the two iterations energy difference is under 0.1 kcal/mol. We use the large change range of values allowed at the beginning to try our best to avoid converging to a local optimum and then the small range to obtain the accurate parameters value. The sum of squares error function is as follows:
 $${\rm{Error}}^{{\rm{ReaxFF}}} \, = {\rm{((}}v^{{\rm{ReaxFF}}} - v^{{\rm{QC/Lit}}} {\rm{)/weight)}}^{\rm{2}} \quad,$$
where v ReaxFF is the ReaxFF value, v QC/Lit is the quantum mechanics (QM) or the literature value, and weight is the accuracy chosen in the training set, which the more important it is, the smaller value it will be.
1. Mo phases
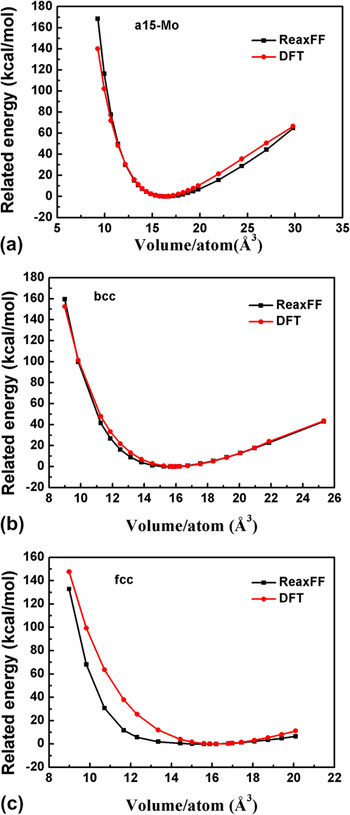
The fcc, bcc, and a15 structures’ heat of formation, EOS, and lattice constant were used to fit the ReaxFF molybdenum bond parameters, the reproduced results are shown in Table I and Fig. 2. Finally, it should also be noted that ReaxFF reproduces the cohesive energy of molybdenum (157.65 kcal/mol) in good agreement with experiment (157.2 kcal/mol). The energy versus the cell volume for the bcc molybdenum can also be used to calculate the structural properties, such as the lattice constant, density, and bulk modulus. ReaxFF gives an equilibrium lattice space of 3.15 Å in good agreement with our DFT result of 3.17 Å and experiment value of 3.15 Å.Reference Lide62 This gives an equilibrium density of 10.21 g/cm3, which is in a reasonable agreement with the experimental value of 10.22 g/cm3. For fitting data, we applied the well-established Birch–Murnaghan EOS to third order,Reference Birch63 and values for the bulk modulus were obtained, 261.8 GPa for ReaxFF and 253.8 GPa for DFT. These are both in reasonable agreement with the experimental value of 272 GPa.
Binding energy and lattice constant were calculated for molybdenum and aluminum–molybdenum alloys, the units being kcal/mol and Å, respectively.

EOS for (a) a15, (b) bcc, and (c) fcc molybdenum. The energies are with respect to the corresponding equilibrium states.

In Fig. 2, the energies for expansions and compressions of a15, bcc, and fcc structures show good agreement with the corresponding DFT calculations. Both stable and unstable of molybdenum phases are trained, which helps to ensure that ReaxFF is able to recognize both stable and unstable structures by energetically distinguishing a variety of coordinate configurations. It is noted that the fitting results of a15 and bcc structure molybdenum are better than fcc, because a15 and bcc have the lower binding energy. It is not so important to describe the relative unstable structures well.
In the process of fitting, the weight strategy is adopted, which the more stable predicted by DFT and more closed to the equilibrium the structure is, the smaller the weight is, the denominator in Eq. (6). The bcc and a15 structure Mo are more stable than other structures, which have lower binding energy (negative, directly calculated by the program) and it is not so important to describe the relative unstable structures well.
2. Aluminum–molybdenum
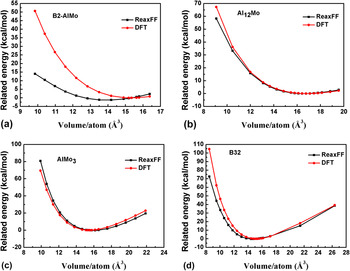
The molybdenum–aluminum alloys of B2, Al12Mo, AlMo3, and B32 structures’ heat of formation, EOS, and lattice constant were used to fit the ReaxFF aluminum–molybdenum bond parameters, and the feedback fitting data showed in Table I and Fig. 3, which illustrated that the related parameters are fitted well. The expansions and compressions of several aluminum–molybdenum phases, in Fig. 3, showed a good agreement with the corresponding DFT values.
EOS for (a) B2, (b) Al12Mo, (c) AlMo3, and (d) B32 alloys. The energies are with respect to the corresponding equilibrium states’.

It is worthy of noting that the ζ2-AlMo high temperature phase structure is not clear till now. Some calculations suggest the possibility that the structure of the ζ2 phase is B32,Reference Gonzales-Ormeño, Petrilli and Schön64 instead of B2, as usually assumed in the literature.Reference Birch63,Reference Gonzales-Ormeño, Petrilli and Schön64 We calculate the energy, E B2 equal to 1.60 kcal/mol and a 0 equal to 3.13 Å with DFT method, compared with experimental value of −1.42 kcal/molReference Gonzales-Ormeño, Petrilli and Schön64; E B32 equal to −4.64 kcal/mol and a 0 equal to 6.24 Å, compared with −7.07 kcal/mol and 6.25 Å64; −5.45 kcal/mol and 6.2 ÅReference Alonso and Rubiolo67; −5.47 kcal/mol and 6.14 Å,Reference Nguyen-Manh and Pettifor68 but the ζ2-AlMo’s experimental enthalpy of formation 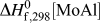 $\Delta H_{{\rm{f,298}}}^0 {\rm{[MoAl]}}$ equal to −7.49 kcal/mol.Reference Shilo and Franzen60 So, it will be a good idea to use force field method to predict the ζ2 structure.
All the structures, except Fig. 3(a), state that ReaxFF and DFT methods’ results are similar. The fitting result of B2 structure is not so well because B2-AlMo structure has the higher binding energy than B32-AlMo, which the B2 weight is larger, the difference up to 6.24 kcal/mol per atom with DFT calculation, and here is 1.2 kcal/mol.
B. Validate ReaxFF description ability
1. Surface energy
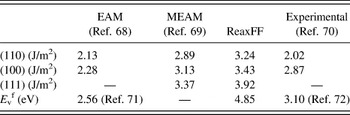
Based on the optimized ReaxFF parameters, the surface and vacancy formation energy were calculated for pure molybdenum. Relaxed surface energies were calculated for three low-index faces, i.e., (110), (100), and (111) faces. The results calculated by ReaxFF, EAM, and MEAM potential, respectively, as well as the experimental values listed in Table II. It can be seen that the energy sequence of these faces is completely consistent with the results obtained by various computation methods, i.e., the close-packed (110) face has the lowest energy, followed by the (100) face, and then the (111) face, which is in good agreement with the experimental observation.
Vacancy and surface energies (J/m2) of three low-index faces for bcc molybdenum.

2. Two deformation paths
Tetragonal and trigonalReference Bain74,Reference Paidar, Wang, Sob and Vitek75 paths were investigated to validate the stability of the ground-state bcc structure relative to alternative crystal structures.
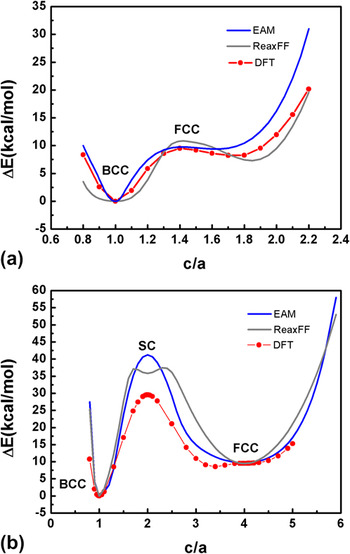
The most common transformational path is the tetragonal path, and it also can be called the Bain path, between fcc and bcc structures. The body-centered tetragonal (bct) structure is stretched along the [100] axis and the high-symmetry bcc and fcc structures are obtained in special cases. The bcc structure can be parameterized in terms of the c/a ratio (where a is the lattice parameter in the [100] and [010] directions and c in the [001] direction), with c/a = 1 corresponding to the bcc structure and c/a = sqrt(2) to the fcc structure. The volume per atom is constant for all structures along this path. Such deformation is attained when
 $$a = b = a_0 p^{ - 1/3} ;\quad c = a_0 p^{2/3} \quad,$$
where a 0 is the lattice parameter of the original bcc lattice and p is a continuously varying parameter. Compared with different methods, EAM, ReaxFF and DFT, the energy change is showed in Fig. 4(a). The three different methods obtain the same tendency, with BCC structure having the lowest and FCC structure having the peak value. But ReaxFF is soft near by the BCC structure, namely c/a ≈ 1.0, and the EAM is flat around the FCC structure.
Energy per atom, relative to the energy of the bcc lattice, as a function of c/a for the tetragonal (a) and trigonal (b) paths calculated by EAM, ReaxFF, and DFT methods.

The second investigated transformation path is the trigonal path, from bcc to fcc lattices but passing through the sc structure. Starting from the bcc lattice, the trigonal path occurs with the homogeneous deformation corresponding to the extension along the [111] axis while keeping the atomic volume constant. In the coordinated system with the x, y, and z axes parallel to  $[1\overline 1 0]$,
 $[11\overline 2 ]$, and
 $[111]$ directions. The magnitude of the vectors parallel to
 $[1\overline 1 0]$ and
 $[11\overline 2 ]$ directions is proportional to p −1/3, while the magnitude of the vector parallel to the
 $[111]$ directions is proportional to p 2/3. The calculated dependence of the energy per atom on the parameter is shown in Fig. 4(b), corresponding to the different cubic structures. Such deformation is attained when
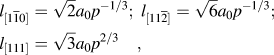 $$l_{[1\overline 1 0]} = \sqrt 2 a_0 p^{ - 1/3} ;\;l_{[11\overline 2 ]} = \sqrt 6 a_0 p^{ - 1/3} ;\;l_{[111]} = \sqrt 3 a_0 p^{2/3} \quad,$$
where a 0 is the lattice parameter of the original bcc lattice and p is a continuously varying parameter. Compared with different methods, EAM, ReaxFF, and DFT, the energy change is shown in Fig. 4(b). The three different methods also get the similar tendency, BCC structure having the lowest and SC structure having the peak value. Because the SC structure has the higher binding energy than BCC and FCC structures, ReaxFF describes the SC structure not well. Although the SC structure has the higher energy, it is at the minimal value.
3. Elastic constant and phonon dispersions
Some structures’ elastic constant and phonon dispersion were calculated to examine the ReaxFF force field predictive ability. Elastic constant has an impact contact with the properties, such as EOS, thermal capacity, thermal expansion, Debye temperature, and melting point, and so on. Also, the bond connecting and anisotropy characters will be obtained. Above all, the cubic structure's stability will be predicted according to Born–Huang ruleReference Born and Huang76: when C11 and C44 are greater than zero, C11 greater than |C12|, the structure is stable. Some structures’ elastic constant are listed in Table III. We find that those substances’ elastic constant, calculated by ReaxFF method, exist certain deviation with DFT method or experiment. All the structures, except B2(AlMo), are mechanically stable, which is consistent with DFT calculation or experiment. Fortunately, the data’s order of magnitude is the same in Mbar, which is useful to obtain the correct dispersion relation in the following part. We also note that the Cauchy press is approximate to zero. ReaxFF may be also called pair functionals, as it is not pairwise potentials but still constructed using only the distance between pairs of atoms, such as the bond order, morse, and coulomb interaction.
Predicted elastic constant of some structures, in units of Mbar.

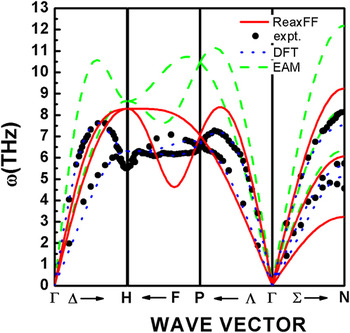
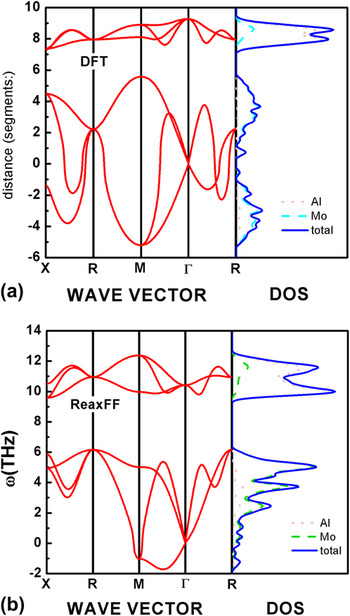
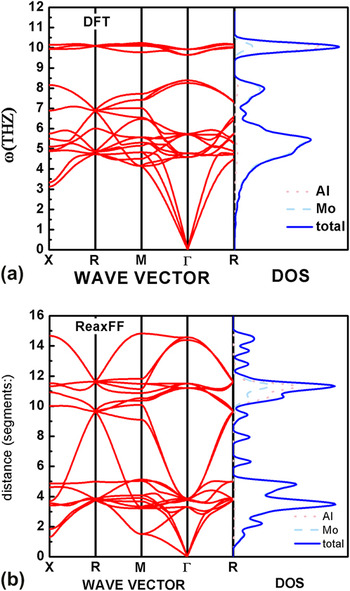
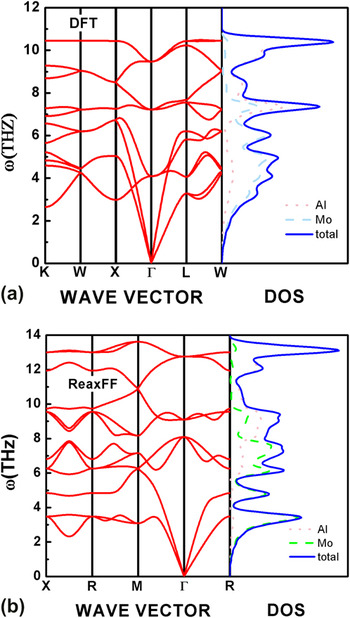
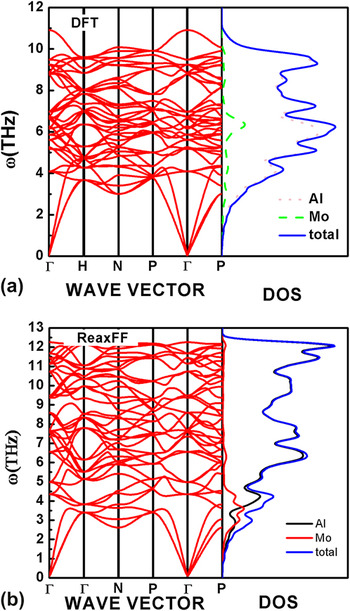
The calculated phonon dispersions curves, shown in Figs. 5–9, are important to describe lattice vibration, which is of great important to represent the atoms vibration frequency, namely determining the diffusion coefficient. We also obtained the structure’s kinetic stability. All the calculated structures, except B2(MoAl), have the positive frequency, so the related structures are kinetic stability. Both ReaxFF and DFT predict B2(AlMo) structure unstable. From those figures, we could find ReaxFF and DFT are very similar at the magnitude. From all those phonon figures, molybdenum occupies the low frequency and aluminum occupies the high frequency, which is in accordance with the DFT results.
The calculated phonon dispersions for pure Mo, using ReaxFF, DFT, EAM, and experiment values.

The calculated phonon dispersions and partial density of states for B2-MoAl, (a) for DFT and (b) for ReaxFF.

The calculated phonon dispersions and partial density of states for AlMo3, (a) for DFT, and (b) for ReaxFF.

The calculated phonon dispersions and partial density of states for B32-MoAl, (a) for DFT, and (b) for ReaxFF.

The calculated phonon dispersions and partial density of states for Al12Mo, (a) for DFT, and (b) for ReaxFF.

IV. CONCLUSION
To enable the theoretical study of the thermite reactions of Al–MoO3 system, we have developed the ReaxFF reactive force field to describe the accurate reactions involving aluminum–molybdenum alloy. Compared with EAM and tight-binding method, ReaxFF is found to be a suitable potential to be used to simulate the thermite reactions in aluminum–molybdenum alloy. We use the heat of formation, geometry data, and EOS to fit the ReaxFF parameters, and the fitting method is similar to that in Ref. Reference van Duin, Strachan, Stewman, Zhang, Xu and Goddard16,Reference van Duin, Dasgupta, Lorant and Goddard17,Reference Cheung, Deng, van Duin and Goddard37,Reference Zhang, Çaǧın, van Duin, Goddard, Qi and Hector38,Reference Raymand, van Duin, Baudin and Hermansson44. The vacancy formation and surface energy of molybdenum are calculated to validate the ReaxFF ability describing the defects. The surface energy of the structures are larger than experimental or DFT values, but the energy sequence from small to large for (110), (100), and (111) faces is correct. The tetragonal and trigonal deformation paths are calculated to validate the ReaxFF ability describing deformations, which is useful to check the bond and dihedral angle parameters; Figs. 4(a) and 4(b) illustrate that ReaxFF force field describe those properties well. Finally, some structures’ elastic constant and phonon dispersion curves are calculated to examine the structures’ mechanical and kinetic stability. B2 structures’ elastic constant and phonon dispersion indicate that both DFT and ReaxFF methods predict instability at 0 K. The elastic constant and phonon dispersion data calculated by ReaxFF are in the same magnitude of DFT results. It is available to describe the atoms diffusion property, by which the diffusion control combustion mechanism is mainly affected. All the results indicate the optimized force field parameters for Al–Mo alloy developed in this study are suited to describe the metal atoms diffusion and the combustion energy changes in the thermite reactions of the metallic part of Al/MoO3.
ACKNOWLEDGMENTS
The authors thank Dr. Adri van Duin for the great suggestion and help, especially providing Al–O parameters, Dr. L.M. Liu at Beijing Computational Science Research Center for insightful discussions, and are grateful to the financial support of the Key Project of Innovation Program of Shanghai Municipal Education Commission (Grant No. 10ZZ62), the National Natural Science Foundation of China (Grant No. 50931003), the Shu Guang Project (Grant No. 09SG36), and the Pu Jiang Project (Grant No. 10PJ1403900). Financial support from the 085 project at Shanghai University is acknowledged. High performance computing resources are provided by the Ziqiang Supercomputer Center at Shanghai University and Beijing Computational Science Research Center.