Introduction
Cryogenic transmission electron microscopy (cryo-TEM) has had a major impact in solving structural biology questions as well as in aiding the investigation of other nano- and micro-sized biological samples, without the need for staining or chemical fixation. Rapid advances in cryo-TEM methodology have led to a revolution in three-dimensional (3D) structure determination of biological macromolecules at near-atomic resolution.Reference Cheng1–Reference Nogales and Scheres4 Thousands of two-dimensional (2D) particle images selected from cryo-electron micrographs are averaged to produce the 3D structure using a method called single-particle reconstruction. This approach assumes that the sample particles have a relatively uniform structure, as is often the case in structural biology. Another powerful technique, cryo-electron tomography (cryo-ET), offers an alternative approach for generating 3D structures of samples with a significant degree of heterogeneity.Reference Beck and Baumeister5–Reference Weber, Wojtynek and Medalia7 The cryo-ET approach involves the collection of a tilt-series, or a set of 2D cryo-TEM images, of a particular region of the specimen viewed from multiple angles (e.g., ±60°). The images are then reconstructed to give a 3D representation of the sample, called a tomogram, which represents the density within the particle.
Cryo-TEM techniques have recently caught the attention of soft matter experimentalists. In order to characterize soft matter in its native state, investigations have thus far typically relied on ensemble-scattering techniques (e.g., dynamic light scattering or small-angle x-ray scattering). To obtain a real-space image using conventional TEM, soft matter requires some modification, such as negative staining using uranyl acetate, to increase the contrast of the carbon-based sample against the substrate. Not only does this introduce structural uncertainty, the sample still needs to be dried onto a substrate to ensure stability in a high-vacuum environment, a well-known source of artifact inclusion. Liquid-cell TEM is a powerful technique that allows for capturing the dynamics of a particle system in solution. However, its use has been limited for soft matter research due to reduced resolution caused by the increased electron path length through the liquid, coupled with typical low contrast. Furthermore, the inherent particle dynamics in liquid cell TEM make 3D reconstruction and the imaging of interfaces difficult.
Cryo-TEM, in contrast, “fixes” the sample in place, which eliminates the possibility of probing dynamics. This static state allows for more in-depth structural investigation, especially when 3D approaches such as cryo-ET can be performed. As such, cryo-TEM and cryo-ET are poised to have a significant and lasting impact on soft matter characterization.
“Soft” nanoparticles
Even without the determination of a 3D structure, cryo-TEM provides a way to visualize soft nanoparticles with the opportunity to make size and morphology measurements on individual particles, and evaluate sample polydispersity. Two-dimensional cryo-TEM imaging can also be used to provide information on the degree of periodicity within a sample,Reference Veliz, Ma, Molugu, Tiu, Stewart, French and Steinmetz8 morphological changes during self-assembly,Reference McKenzie, de Visser, Portale, Hermida-Merino, Friedrich, Bomans, Bras, Monaghan, Holder and Sommerdijk9 and in the case of polymer-stabilized perfluorocarbon gas nanobubbles, their robustness after exposure to high-intensity ultrasound or the electron beam of the TEM.Reference Hernandez, Gulati, Fioravanti, Stewart and Exner10 Three-dimensional cryo-TEM approaches, single-particle reconstruction and cryo-ET, provide additional information, which can be key to understanding the structure of the particle; these have been applied to a variety of soft nanoparticles.Reference Stewart11
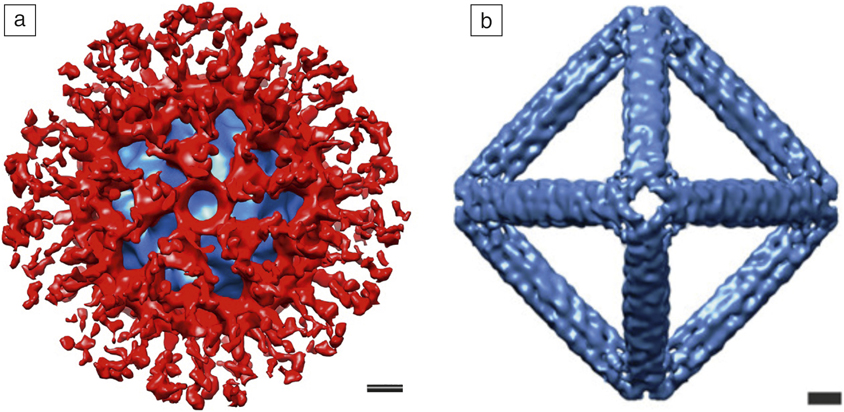
Historically, favorable samples for cryo-TEM single-particle reconstruction have included icosahedral viruses, as they have a large mass and high symmetry.Reference Jiang and Tang12 However, single-particle reconstruction becomes more challenging for polymer–virus conjugates, as polymers are not expected to adopt uniform conformations. Lee et al. have demonstrated that it is possible to observe the average distribution of a polymeric brush layer on a viral–polymer conjugate.Reference Lee, Isarov, Wallat, Molugu, Shukla, Sun, Zhang, Zheng, Lucius Dougherty, Konkolewicz, Stewart, Steinmetz, Hore and Pokorski13 The authors evaluated the immune shielding of three different polymers grafted to virus-like particles (VLPs, protein structures that mimic native viruses but are not infectious) derived from the bacteriophage Qβ. The particles conjugated with poly(norbornene−(oligo(ethylene glycol) ester)) (PNB) were most effectively shielded from antibody recognition. A cryo-TEM reconstruction of the Qβ−PNB viral–polymer conjugate provides a visual picture of the PNB brush layer (red) covering most of the viral capsid (Figure 1a). DNA nanoparticles also make suitable samples for cryo-TEM single-particle reconstruction. Jun et al. have used cryo-TEM single-particle reconstruction to validate the generation of polyhedral wireframe DNA nanoparticles with various symmetries, including tetrahedral and octahedral symmetry (Figure 1b).Reference Jun, Shepherd, Zhang, Bricker, Li, Chiu and Bathe14 The cryo-TEM reconstructions show that the 3D structures of the experimentally produced DNA nanoparticles are highly comparable to their predicted atomic models.
Examples of cryogenic transmission electron microscopy (cryo-TEM) single-particle reconstruction applied to soft nanoparticles. (a) Cryo-TEM reconstruction of the viral–polymer conjugate Qβ−PNB (poly(norbornene−(oligo(ethylene glycol) ester))). Note: blue, virion density; red, polymer.Reference Lee, Isarov, Wallat, Molugu, Shukla, Sun, Zhang, Zheng, Lucius Dougherty, Konkolewicz, Stewart, Steinmetz, Hore and Pokorski13 (b) Cryo-TEM reconstruction of a polyhedral wireframe DNA nanoparticle with a designed octahedral shape. Reprinted with permission from Reference 14. © 2019 American Chemical Society. Scale bars = 5 nm.

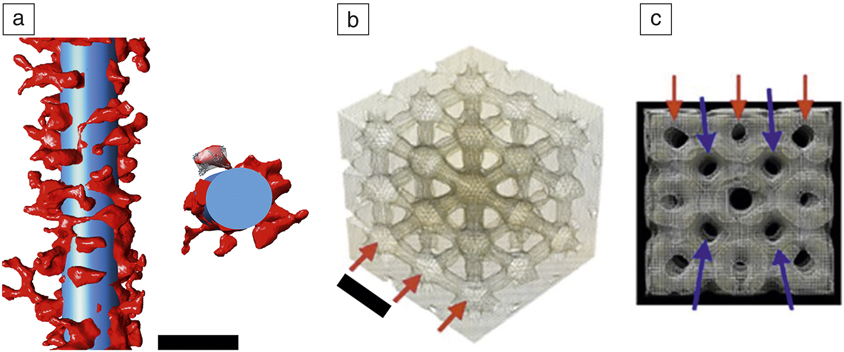
Engineered nanoparticles often include flexible linkers or have a nonuniform overall structure. In these cases, cryo-ET offers a way to characterize the nanoparticle structure in 3D. Gulati et al. demonstrated the use of cryo-ET to visualize a protein coating engineered on the surface of nanotubes formed by the tobacco mosaic virus (TMV).Reference Gulati, Pitek, Steinmetz and Stewart15 In this study, the surface of the TMV was coated via flexible linkers with human serum albumin, the most abundant protein in blood, to provide a camouflage layer from the immune system. Cryo-ET allowed for visualization of individual serum albumin molecules and quantitative measurements of the surface coverage provided by the protein stealth layer (Figure 2a).
Examples of cryo-electron tomography applied to soft nanoparticles. (a) (Left) Section of a serum albumin-coated tobacco mosaic virus particle taken from a tomogram. The superimposed blue cylinder (300 nm × 18 nm) represents the filamentous tobacco mosaic virus particle and the red density represents the flexibly attached serum albumin protein. (Right) The cross-sectional segment illustrates docking of the human serum albumin crystal structure. Scale bar = 25 nm.Reference Gulati, Pitek, Steinmetz and Stewart15 (b) Portion of a tomogram of the liquid-crystal region inside a cubosome (dispersed cubic liquid-crystalline phase particle). Red arrows show nodes within the water network. Scale bar = 16 nm. (c) Side view of the cubosome tomogram. The red and blue arrows indicate two interdependent channel networks. The average hole diameter is ∼5 nm. (b, c) Reprinted with permission from Reference 16. © 2015 Nature Publishing Group.
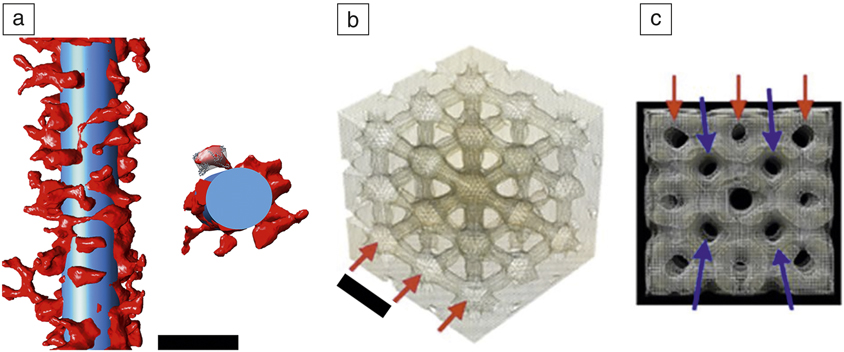
Amphiphilic lipids can self-assemble into highly ordered assemblies, such as dispersed cubic liquid-crystalline phases (cubosomes). A cryo-ET study of cubosomes revealed a 3D look at these assemblies and unequivocally demonstrates the presence of an internal bicontinuous cubic structure (Figure 2b).Reference Demurtas, Guichard, Martiel, Mezzenga, Hebert and Sagalowicz16 The tomogram derived by cryo-ET provides direct evidence that the internal channels within the cubosome are organized in two interdependent networks (Figure 2c). As these soft nanoparticle examples demonstrate, cryo-TEM can provide detailed information on nanoparticles composed of protein, DNA, lipid, and polymers, and often, this information can inform the design of new nanoparticles.
Synthetic polymers and supramolecular structures
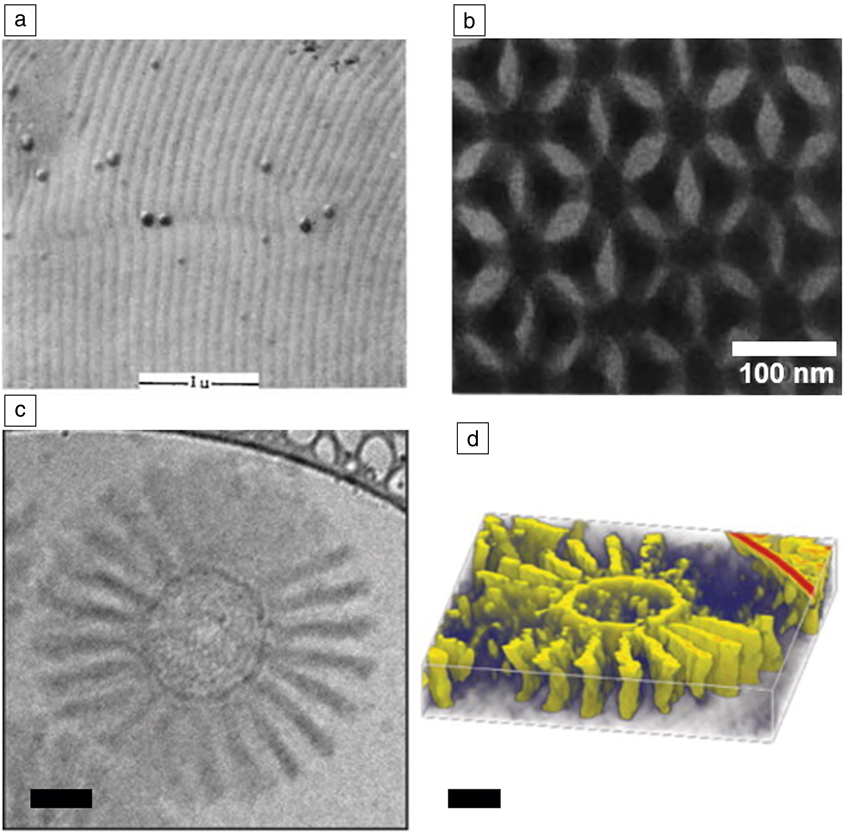
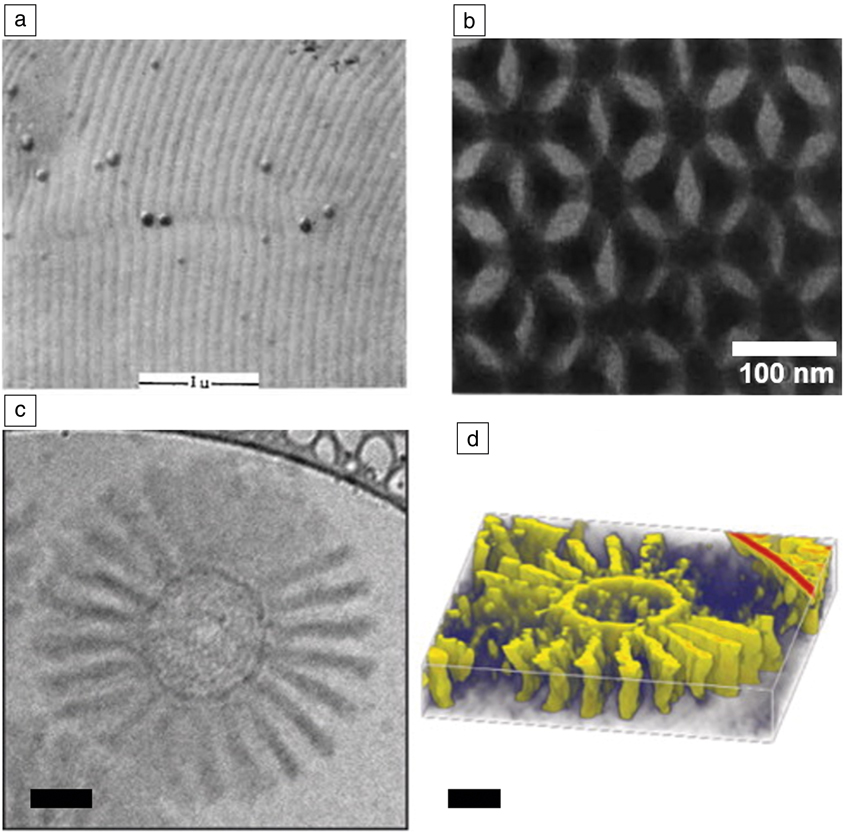
Synthetic organic nanostructures have a relatively long history of characterization by electron microscopy. While they suffer similar risks of beam damage as biological materials, they are often stable in the absence of water and under high vacuum, which has allowed them to be characterized by more traditional electron microscopy techniques. For example, much of the extensive understanding of the phase behavior of block copolymers was developed with the assistance of electron microscopy. Useful scanning electron microscope images of microphase separation in polymeric systems were being generated more than 50 years ago (Figure 3a),Reference Vanzo17 and clear and striking images were being taken by TEM more than 30 years ago (Figure 3b).Reference Kinning, Winey and Thomas18,Reference Thomas, Anderson, Henkee and Hoffman19 This imaging generally relied on microtomed samples stained with heavy metalsReference Kinning, Winey and Thomas18 or thin films annealed in a vacuum and then stained.Reference Thomas, Anderson, Henkee and Hoffman19
Evolution of electron microscopy of soft matter systems. (a) Scanning electron microscopy micrograph of a phase-separated diblock copolymer obtained in 1966. Reprinted with permission from Reference 17. © 1966 Wiley. Scale bar = 1 μm. (b) Transmission electron microcopy (TEM) micrograph of the 3D phase separation of a block copolymer published in 1988. Reprinted with permission from Reference 19. © 1988 Nature Publishing Group. (c) Cryogenic-TEM image of a polymer micelle in water. (d) Reconstructed tomogram of the same micelle. Reprinted with permission from Reference 21. © 2014 American Chemical Society. Scale bars = 50 nm.
Many other structures that exist only in the presence of volatile solvents could not be interrogated by TEM in their native states due to the introduction of drying artifacts. For example, micelles and other supramolecular structures were limited to scattering techniques. While these approaches are powerful, providing both equilibrium and dynamic information about a system, they are always model-based. More direct, real-space images are highly complementary to these scattering approaches and serve to constrain models, provide useful information on individual, unaveraged structures, as well as provide quickly understood images for nonexperts. Therefore, solution-based, self-assembled structures such as micelles, vesicles, and polymersomes have been popular targets of cryo-TEM.
Early cryo-TEM of micellar structures consisted of 2D images of the micelles in water that, despite their modest resolutions, led to new insights into the phase behavior of the micellar systems studied.Reference Vinson, Bellare, Davis, Miller and Scriven20 Introduction of cryo-ET has yielded greater detail for these self-assembled systems, including equilibrium structures as well as dynamics of formation and changes in dynamic systems. For example, Löbling et al. used cryo-ET to characterize the complex structure of a series of polymer-based micelles (Figure 3c–d).Reference Lobling, Haataja, Synatschke, Schacher, Muller, Hanisch, Groschel and Muller21 While the 2D cryo-TEM images have low-image contrast, it is important to remember that these are unstained structures captured in their native states, with their 3D structures intact. This allows a tremendous amount of information to be gleaned from a series of images at different tilt angles that lead to the computed 3D structure.
Less ordered self-assemblies can also be interrogated by cryo-TEM. Aggregation of conducting polymers in solution has long been blamed for anomalous solution behaviorReference Sehgal and Seery22 with strong intermolecular interactions, such as π stacking, being a common explanation for the aggregation. Scattering experiments in these systems have been challenging as the solution structures vary with time, making signal averaging a challenge. Cryo-TEM was able to overcome these issues to provide images of these structures frozen in time.Reference Wirix, Bomans, Friedrich, Sommerdijk and de With23 These images confirmed π stacking interactions, while providing additional insight into the semicrystalline nature of the agglomerates. Together, these examples of cryo-TEM of organic assemblies demonstrate some of the key capabilities that are emerging in the field. We can now characterize not just thermodynamically stable and highly ordered structures, but fluctuating low-order structures by vitrifying the solvent around them. Modern instrumentation allows for this even with the relatively low contrast afforded by an organic molecule dissolved in an organic solvent without staining. It is easy to see how kinetics of structural changes can be accessed by performing time-varying vitrification procedures.
Characterization of the full 3D order in a self-assembled organic material is another important area that is being enabled by cryo-EM. We have already discussed the capabilities of cryo-ET, but a complementary approach is cryogenic focused ion beam (cryo-FIB) milling, in which vitrified samples are sectioned and thinned to electron transparency for TEM analysis, allowing for the investigation of the internal structure. To date, this has seen more use in biological and inorganic materials, but can be expected to have a dramatic impact on synthetic organic systems as well.
Nanoparticles and inorganic–organic interfaces
When characterizing inorganic nanoparticles, chemical modification is not needed for sufficient imaging contrast in conventional TEM. However, sample preparation almost always involves drying, along with the associated artifacts (e.g., the often observed “coffee ring” of nanoparticles).Reference Magdassi, Grouchko, Toker, Kamyshny, Balberg and Millo24 As nanoparticle behavior is strongly dependent on their size, shape, and interparticle interactions, removing these uncertainties from material characterization is important. Furthermore, inorganic nanoparticles are often decorated with organic ligands that help to define their stability in solution. When desolvated, the nature of the ligands is altered, and our interpretation of their influence on nanoparticle behavior also becomes uncertain (i.e., measurements of interparticle distance could become incorrect). For some systems, this is crucial; for example, the magnetic relaxation behavior of an ensemble of magnetic nanoparticles is significantly altered by the presence of magnetic dipole–dipole interactions, which have a strong dependence on interparticle spacing.Reference Monson, Venturini, Petkov, Ren, Lavin and Huber25,Reference Bishop, Wilmer, Soh and Grzybowski26 Cryo-TEM techniques are powerful tools to increase our understanding of these important nanoparticle components in experimental space. Furthermore, nanoparticle growth intermediates can be isolated, yielding a “snapshot” of the growth stages.
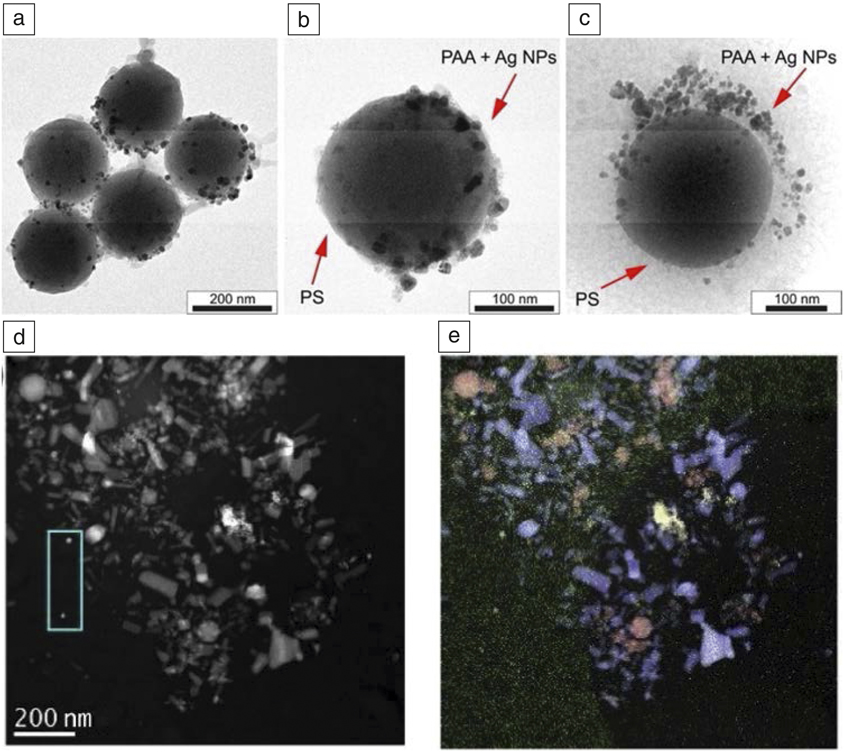
Sabyrov et al. used cryo-TEM to image the transformation of anatase TiO2 nanoparticles to the rutile phase, at low pH.Reference Sabyrov, Burrows and Penn27 They showed that at a pH of 3, aggregation effects were a contributing factor to the transformation mechanism, due to increased interparticle interactions. This would not have been possible with conventional TEM, as drying effects would remove the possibility of distinguishing between compact and loosely aggregated particle ensembles in solution. Cryo-TEM confirmed a Janus-type structure for hybrid silica-poly(acrylic acid)-polystyrene particles, where gold or silver metallic nanoparticles were selectively immobilized onto the hydrophilic face (Figure 4a–c). Because the polymer shell was solvated, cryo-TEM could reveal that the nanoparticles were adsorbed throughout the length of the polymer chain. Such features would have been lost in conventional TEM, as the polymer chain would have collapsed to the particle surface during drying.Reference Kirillova, Schliebe, Stoychev, Jakob, Lang and Synytska28
Comparison of (a, b) conventional transmission electron microscopy (TEM) and (c) cryogenic (cryo)-TEM characterization of hairy hybrid Janus catalyst made from silica-poly(acrylic acid)-polystyrene (PAA-PS) particles with selectively immobilized Ag nanoparticles on the poly(acrylic acid) shell hydrophilic face. Reprinted with permission from Reference 28. (d) High-angle annular dark-field cryo-scanning transmission electron microscope image of a mixture of CeO2, Fe2O3, and ZnO nanoparticles in a vitrified suspension. (e) Combined energy-dispersive x-ray spectrometry maps of Fe Kα (red), Zn Kα (blue), Ce Lα (yellow), and C Kα (green). Reprinted with permission from Reference 29. © 2019 Micron. Note: NPs, nanoparticles.

In another study, cryo-scanning TEM (cryo-STEM) was combined with energy-dispersive x-ray spectrometry and electron energy-loss spectroscopy to identify a mixture of CeO2, Fe2O3, and ZnO nanoparticles in a vitrified suspension (Figure 4d–e). The authors showed that STEM permitted larger electron fluxes (up to 2000 e–/Å2) to be used than conventional TEM (<100 e–/Å2), without significant damage to the frozen vitreous matrix.Reference Ilett, Brydson, Brown and Hondow29 They then applied the protocol to a suspension of BaTiO3 nanoparticles dispersed in a cell culture medium to study the bio–nano interface and better understand nanoparticle behavior in vivo.
Interfacing inorganic and organic species can result in exciting hybrid materials. Such nanocomposites can bring together the biocompatibility of select organic species, with target optical, electrical, magnetic, or catalytic properties possessed by inorganic nanostructures. For example, enveloping nanomaterials with a lipid bilayer can mask the underlying inorganic core, with the combined functionality then expressing a common biointerface. Inorganic nanoparticles can be coated by a single bilayer, embedded in the bilayer, decorated on the surface, or even aggregated as distinct phases.Reference Mousseau, Oikonomou, Baldim, Mornet and Berret30 On the other hand, preformed bilayers can be decorated with nanomaterials with target functionality. This combines inorganic properties with the dynamic reorganization properties of fluid bilayers, for applications such as drug release. Understanding how these new interfaces form and their influence on the structural integrity of the organic component is imperative. Cryo-TEM and cryo-ET are powerful direct visualization tools that can complement traditional techniques such as fluorescence microscopy, leakage tests, and chemical assays.Reference Wang, Zhang, Liu, Lin, Liu and Liu31
Liu et al. used halide ligands to tightly control the spacing between nanoparticles and phosphocholine-based liposomes to the sub-Angstrom level. The effect of the emergence of a new inorganic–organic interface on the liposome structure was investigated using cryo-TEM. They found that Au nanoparticle adsorption did not disturb the overall structure; however, they did notice two mechanisms for nanoparticle aggregation—interface-induced aggregation on the surface of the liposome and homogeneous aggregation in solution. Ensemble optical characterization techniques could not have distinguished between the two types of aggregation behavior.Reference Liu, Li, Xu, Zhang, Huang, Wang and Liu32 A similar study used a combination of cryo-TEM and surface-enhanced Raman spectroscopy to show that interacting Au nanoparticles destroyed the liposome bilayer when high levels of capping agent (citrate) were present. However, if excess citrate were removed leaving only a surface layer, the nanoparticles were adsorbed to the liposome surface and acted as a stabilizer.Reference Zivanovic, Kochovski, Arenz, Lu and Kneipp33
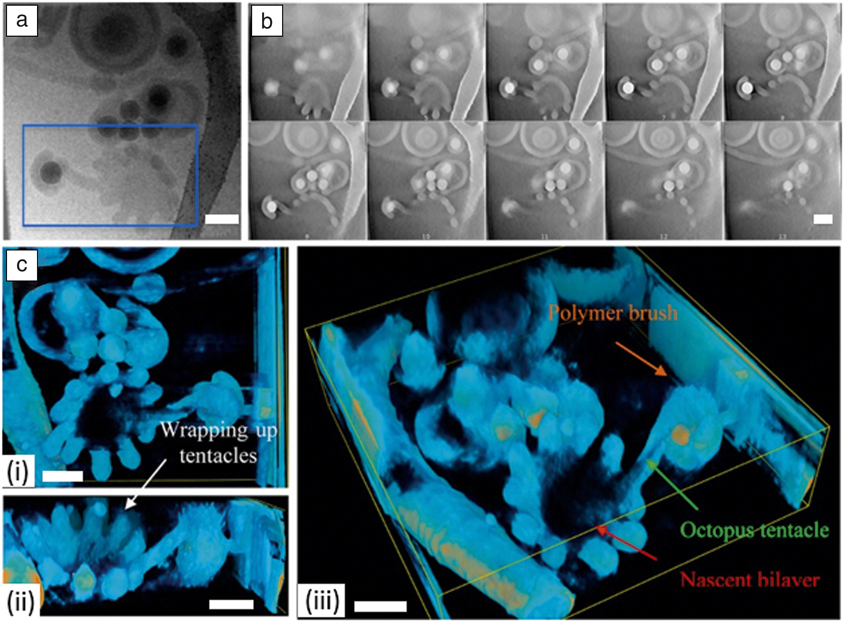
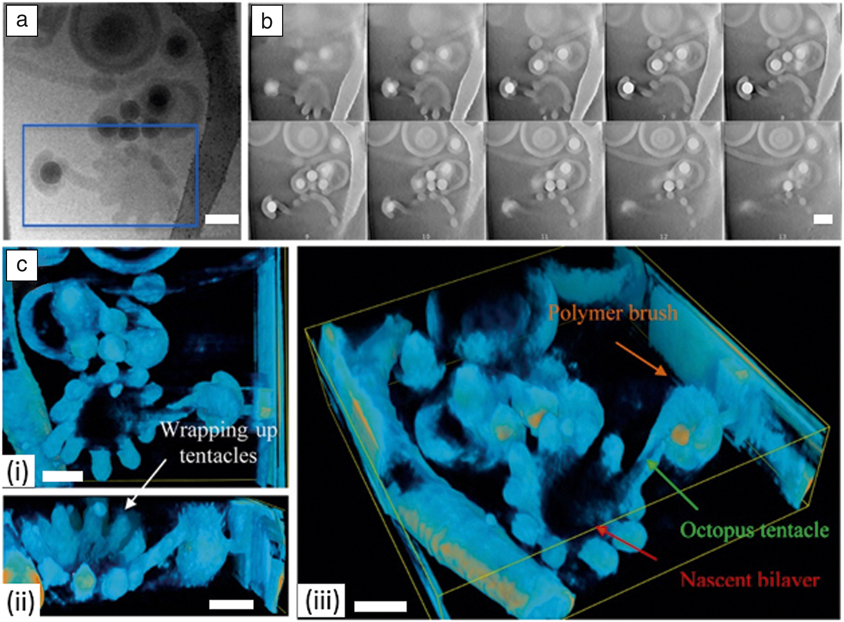
Qiao et al. studied self-assembled nano-objects formed by the diblock copolymer (poly(ethylene oxide) methyl ether methacrylate12-co-styrene)-b-(n-butyl methacrylate-co-styrene) on the surface of colloidal silica particles of various diameters, and then investigated the effect of changing pH.Reference Qiao, Lambert, Taveau, Dugas, Charleux, Lansalot and Bourgeat-Lami34 Low pH led to multipod-like silica/polymer composite particles, regardless of the silica particle size, whereas increasing pH led to a number of unique morphologies. With an intermediate silica particle size, and high pH, a complex mixture of kinetically trapped copolymer morphologies were formed (Figure 5b–c). They used both cryo-TEM and cryo-ET to investigate these unique structures, in order to give the most definitive insight into the formation mechanisms possible. Cryo-ET was able to identify a protruding copolymer “tentacle” that connected the encapsulated silica particle with a nascent bilayer vesicle, transient morphologies that were not observable using 2D cryo-TEM (Figure 5a).
Cryo-electron tomography analysis of an intermediate branched worm structure with protruding tentacles made from in situ self-assembled diblock copolymer (poly(ethylene oxide) methyl ether methacrylate12-co-styrene)-b-(n-butyl methacrylate-co-styrene) on the surface of colloidal silica particles. (a) Cryogenic transmission electron microscope image showing a 2D projection of the selected particle. (b) Selected slices from the reconstructed tomogram of the blue rectangular area selected in (a). (c) Isosurface of the reconstructed tomogram rendered in (i) top, (ii) front, and (iii) 45° views, respectively. Scale bars = 200 nm. Reprinted with permission from Reference 34. © 2017 American Chemical Society.
Challenges and opportunities
Multiple challenges are inherent in the various cryo-TEM approaches described here. As with structural biology, controlled and reproducible sample preparation of soft matter samples is vital. Rapid vitrification of the sample medium is essential to ensure a low-contrast background and to remove crystalline artifacts. Also, given enough time, solvent-rearrangement effects could be strong enough to alter the arrangement of nanoparticles themselves.Reference Burrows and Penn35 One also needs to be careful when blotting the sample, as the flow caused by blotting can create a shear stress, which will tend to align anisotropic structures, introducing arrangement artifacts. Since there is a thickness to the vitrified ice background, particles can have some overlap in the Z-direction. Simple tilting of the sample grid in the microscope can resolve overlaps, which would not be possible with dried samples and conventional TEM. Ethane contamination from the vitrification process can appear as spheres, with strong contrast against an ice background. In structural biology research, newly vitrified samples are often stored overnight in high-quality liquid N2 to allow this ethane contamination to dissolve away. The same may also be prudent for soft matter samples.
For single-particle reconstruction to be applied to novel soft materials, a high-quality ensemble with tight size and shape distribution is required. Experimentally, this is difficult to achieve, as even the highest quality biomimetic materials and nanoparticle ensembles possess a size distribution significantly greater than that found in structural biology. However, applying cryo-ET to a single entity can enable reconstruction of 3D structure and visualization of inorganic–organic interfaces, as seen in Figure 5, and demonstrated recently at the atomic level for a single inorganic nanoparticle.Reference Miao, Ercius and Billinge36 In cryo-ET, control over electron dose is important to reduce sample damage throughout the tilt series and to ensure artifacts are not introduced into the system.
The increased use of cryo-FIB is certain to open up new opportunities in soft matter characterization. Cryo-FIB is already significantly impacting energy research, allowing researchers to probe the solid–liquid interface in lithium-metal batteries.Reference Zachman, Tu, Choudhury, Archer and Kourkoutis37 Likewise, soft matter researchers will look to use cryo-FIB to probe buried interfaces (e.g., phase separation during polymer self-assembly).Reference Simocko, Frischknecht and Huber38
Despite all of the challenges presented by cryo-TEM approaches, the high-quality, information-rich 2D images and 3D structures that can be produced will ensure that these techniques will provide increasing value in soft matter research.
Acknowledgments
This work was performed, in part, at the Cleveland Center for Membrane and Structural Biology at Case Western Reserve University and at the Center for Integrated Nanotechnologies, an Office of Science User Facility operated for the US Department of Energy (DOE) Office of Science. Sandia National Laboratories is a multi-mission laboratory managed and operated by National Technology & Engineering Solutions of Sandia, LLC, a wholly owned subsidiary of Honeywell International, Inc., for the DOE’s National Nuclear Security Administration under Contract No. DE-NA-0003525. This article describes objective technical results and analysis. Any subjective views or opinions that might be expressed in the article do not necessarily represent the views of the DOE or the United States Government. Los Alamos National Laboratory, an affirmative action equal opportunity employer, is managed by Triad National Security, LLC for the DOE’s NNSA, under Contract No. 89233218CNA000001.

John Watt is a scientist and electron microscopist at the Center for Integrated Nanotechnologies (CINT) at Los Alamos National Laboratory. He received his PhD degree in 2010 from Victoria University of Wellington (VUW), New Zealand. He completed postdoctoral research at VUW and CINT Sandia. His research interests include the synthesis and cryogenic transmission electron microscopy characterization of soft matter and inorganic materials, and their unique interfaces. Watt can be reached by email at watt@lanl.gov.

Dale Huber is a distinguished member of the technical staff at the Center for Integrated Nanotechnologies at Sandia National Laboratories. He received his PhD degree in 2000 from the University of Connecticut. He completed postdoctoral research at Sandia National Laboratories. His research interests include novel polymer syntheses, fine control of nanoparticle size and shape, and preparation of nanocomposites. Huber can be reached by email at dale.huber@sandia.gov.

Phoebe Stewart is a professor of pharmacology and director of the Cleveland Center for Membrane and Structural Biology at Case Western Reserve University. She received her PhD degree in chemistry in 1987 from the University of Pennsylvania. She was a Helen Hay Whitney postdoctoral fellow at the Wistar Institute in Philadelphia. Her research interests include applying cryo-electron microscopy and cryo-electron tomography to study nanoparticles and virus–host factor interactions. Stewart can be reached by email at PLS47@case.edu.