Introduction
The genus Trichosirocalus Colonnelli, 1979 (Coleoptera, Curculionidae, Ceutorhynchinae) includes 17 Palaearctic species (Colonnelli, Reference Colonnelli, Löbl and Smetana2013), mainly feeding on Plantaginaceae and Asteraceae (Colonnelli, Reference Colonnelli2004). Weevils originating from Italy and Germany, identified at the time as Trichosirocalus horridus (Panzer, 1801), were released in Canada, USA, New Zealand and Australia for classical biological control of Musk thistle (Carduus nutans L.) and its close relatives (Kok & Trumble, Reference Kok and Trumble1979; Harris, Reference Harris, Kelleher and Hulme1984; Jessep, Reference Jessep1989; Woodburn, Reference Woodburn1997). In 1997, weevils associated with Scotch thistle (Onopordum acanthium L.) in Spain were introduced to Australia (Briese et al., Reference Briese, Pettit, Swirepik and Walker2002a ; Briese, Reference Briese, Julien, McFadyen and Cullen2012). Until 2002, T. horridus (Panzer, 1801) was considered as single species, known to be associated in the larval and/or adult stages with several species of thistles of the tribe Cardueae (Carduus spp., Cirsium spp., Onopordum spp, Silybum marianum (L.) Gaertn and Galactites tomentosa Moench) (Zwölfer, Reference Zwölfer1965). Alonso-Zarazaga & Sánchez-Ruiz (Reference Alonso-Zarazaga and Sánchez-Ruiz2002), from a morphological study of samples collected by D. Briese in Australia on Carduus (T. horridus was released in Australia in 1985 as control agent against Carduus thistles), as well as samples from the Australian quarantine stock originally collected on Onopordum in Spain, concluded that T. horridus was a complex of three species, which differed in host range and geographical distribution. Accordingly, T. horridus sensu stricto, feeds on Cirsium spp. and occurs in Spain, France, Germany and Croatia, Trichosirocalus mortadelo Alonso-Zarazaga & Sánchez-Ruiz (Reference Alonso-Zarazaga and Sánchez-Ruiz2002), feeds on Carduus spp. and is known from Australia and Germany (Hannover) and Trichosirocalus briesei Alonso-Zarazaga & Sánchez-Ruiz (Reference Alonso-Zarazaga and Sánchez-Ruiz2002), feeds on Onopordum spp. and occurs in Austria, Morocco and Spain. Thus, the T. horridus complex was believed to encompass three very closely related species primarily distributed in South and Central Europe; however, it was not clear which species were introduced to North America, Australia and New Zealand.
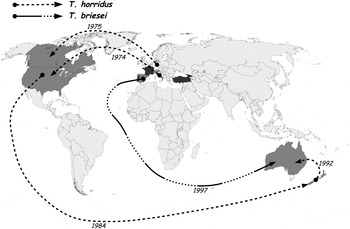
Members of this species complex have been repeatedly translocated in biocontrol programmes against several thistles (fig. 1). First, colonies of T. horridus originating from Carduus in Italy were established to control Carduus thistles in the USA (Virginia, Kansas, Nebraska and Montana) in 1974 (Kok, Reference Kok and Freeman1978, Reference Kok2001; Kok & Trumble, Reference Kok and Trumble1979). Weevils collected from Germany (Neuenburg) were introduced to Canada in 1975 to control Carduus spp. (Harris, Reference Harris, Kelleher and Hulme1984; De Clerck-Floate & Cárcamo, Reference De Clerck-Floate, Cárcamo and Floate2011). In 1984, specimens of T. horridus from the Canadian colony were introduced to New Zealand (Jessep, Reference Jessep1989), and in 1992 individuals from populations established in New Zealand were released in Australia to control Carduus spp. In the 1990s, Briese and colleagues carried out a field survey in Europe to seek prospective control agents to manage Onopordum thistles in Australia (Briese et al., Reference Briese, Sheppard, Zwölfer and Boldt1994, Reference Briese, Pettit, Swirepik and Walker2002a ). They discovered in Spain a population of the T. horridus complex apparently restricted to develop on Onopordum thistles, as suggested by the host range tests performed in an Australian quarantine laboratory (Briese et al., Reference Briese, Thomann and Vitou2002b , Reference Briese, Walker, Pettit and Sagliocco c ). These weevils were described as a new species (T. briesei) by Alonso-Zarazaga & Sánchez-Ruiz (Reference Alonso-Zarazaga and Sánchez-Ruiz2002) and released in Australia for the control of O. acanthium (Woodburn, Reference Woodburn1997). Although the identity of insects in the latter introduction was clear, it was uncertain whether T. horridus and/or T. mortadelo had previously been introduced in each of the above countries.
Map showing the introductions of Trichosirocalus horridus sensu lato to Canada, USA, New Zealand and Australia. Medium grey countries were involved in translocation events as described in the text. Dark grey countries were included in the sampling to get more data on biological variation of the species complex. Both light and dark grey countries were sampled for the present study. Base Map from http://commons.wikimedia.org/wiki.

In North America, T. horridus has been reared from both Carduus and Cirsium species (McAvoy et al., Reference McAvoy, Kok and Mays1987; Takahashi et al., Reference Takahashi, Louda, Miller and O'Brien2009; Wiggins et al., Reference Wiggins, Grant, Lambdin, Ranney and Wilkerson2009), which suggests either the presence of two species of weevil (T. horridus on Cirsium and T. mortadelo on Carduus) or that at least one of the species is not as specific as Alonso-Zarazaga & Sánchez-Ruiz (Reference Alonso-Zarazaga and Sánchez-Ruiz2002) claimed. Furthermore, the weevils have been found on Cirsium, Carduus and Onopordum in New Zealand despite the introduction of only one population from Canada (Groenteman et al., Reference Groenteman, Kelly, Fowler, Bourdôt, Julien, Sforza, Bon, Evans, Hatcher, Hinz and Rector2008). Because of concern about risk to non-target plant species and the need to better understand the specificity of biological control agents of weeds, it is important to clarify the taxonomic status of these species and their host specificity. Molecular genetic analysis has often contributed to the discovery of cryptic species that differ in important biological traits, including host specificity (Fumanal et al., Reference Fumanal, Martin and Bon2005; Madeira et al., Reference Madeira, Tipping, Gandolfo, Center, Van and O'Brien2006; Mound et al., Reference Mound, Wheeler and Williams2010; Gaskin et al., Reference Gaskin, Bon, Cock, Cristofaro, De Biase, De Clerck-Floate, Ellison, Hinz, Hufbauer, Julien and Sforza2011). Furthermore, combining morphological, genetic and biological traits, known as integrative taxonomy, can provide a more robust and stable classification (Dayrat, Reference Dayrat2005; Padial et al., Reference Padial, Miralles, De la Riva and Vences2010).
The goal of this paper is to reassess the taxonomy of the species in the T. horridus complex using a combination of molecular genetic, morphological and host plant data.
Materials and methods
Sampling of investigated populations
Samples of adult weevils were collected during field trips carried out in Spain, Portugal, France, Italy, Turkey and Georgia between 2008 and 2013 to obtain specimens from several distinct localities. In addition, many adult specimens were kindly provided by several colleagues from Germany, the USA, Canada, Australia and New Zealand, and a few larvae from New Zealand were provided by R. Groenteman (Landcare Research, Lincoln, New Zealand). These larvae were of particular interest because they had been collected from all the currently recorded host plants (Carduus, Cirsium, Onopordum) of the T. horridus complex. A few specimens of Trichosirocalus troglodytes (Fabricius, 1787), used as an outgroup taxon in the statistical analyses, were collected during a field trip in Portugal in 2013 by one of us (Enzo Colonnelli). Figure 1 displays the countries in which the studied samples were collected, and Table S1 (see supplementary material) lists the details of the localities and host plants. To record the trophic range of the taxonomic entities under study, during the fieldwork, the host plant of each collected adult specimen was identified by the field collectors. Insect voucher specimens are preserved in the authors’ collections.
Molecular genetic analysis
Following the procedure described in Cristofaro et al. (Reference Cristofaro, De Biase and Smith2013), the total genomic DNA was extracted and used as a template in polymerase chain reactions (PCR; Mullis et al., Reference Mullis, Faloona, Scharf, Saiki, Horn and Erlich1986) to amplify a fragment of the mitochondrial genome coding for the cytochrome c oxidase subunit I (cox1) and a fragment of the nuclear gene coding for the elongation factor 1α (ef1α). Folmer's primers LC01490 and HC02198 (Folmer et al., Reference Folmer, Black, Hoeh, Lutz and Vrijenhoek1994) were used to amplify the 5′ upstream region of the cox1 gene, or, when needed, the TY-J-1460 primer of Simon et al. (Reference Simon, Frati, Beckenbach, Crespi, Liu and Flook1994) as the forward one; few individuals not giving clean PCR results were amplified as described by Rector et al. (Reference Rector, De Biase, Cristofaro, Primerano, Belvedere, Antonini and Sobhian2010). The primers EF1-Bf and EF1-Br (Hernandez-Vera et al., Reference Hernández-Vera, Mitrović, Jović, Toševski, Caldara, Gassmann and Emerson2010), forward and reverse, respectively, were used to amplify the ef1α gene. We used several PCR thermal cyclers among those available at our laboratory (i.e., Perkin Elmer® GeneAmp PCR System 2400 thermal cycler; MWG® Biotech Primus 25, Biometra® Tpersonal 48), with the following amplification conditions: (a) cox1: 94°C denaturation (5 min), followed by 35 cycles of 95°C denaturation (1 min), 40°C annealing (1 min), and 72°C extension (1 min and 30 s), followed by a final 7 min elongation step at 72°C; (b) ef1α: touchdown PCR with 94°C denaturation (2 min), followed by 24 cycles of 94°C denaturation (30 s), 62–50°C annealing (1 min; decreasing 2°C every 2 cycles), and 72°C extension (1 min), followed by 2 cycles of 94°C denaturation (30 s), 48°C annealing (1 min), and 72°C extension (1 min), followed by a final 7 min elongation step at 72°C. Reactions were performed in 25 µl of cocktail containing (NH4)2SO4 16 mM, Tris–HCl 67 mM (pH 8.8 at 25°C), MgCl2 3 mM, Tween-20 0.01%, 1 mM of each deoxynucleotide, 0.8 pM of each primer, and 1.25 units of Taq DNA polymerase (Bioline Reagents Ltd, UK). Amplified products were purified by Exo-SAP enzymatic reactions and sequenced at the Macrogen Korea (Seoul, Korea) and Macrogen Europe (Amsterdam, The Netherlands) genomic centres, employing Applied Biosystems® 3730xl DNA Analysers and using the BigDye Terminator Kit (Applied Biosystems, USA) according to the manufacturer's protocol. Sequencing primers were LC01490 and EF1-Bf for the mitochondrial and nuclear markers, respectively. When needed, the DNA of a few individuals was sequenced on both strands using the same reverse primers used during the PCR amplifications.
The acquired sequences were screened by a blast search of the GenBank nucleotide collection of the National Center for Biotechnology Information (NCBI) using the Mega BLAST procedure (Wheeler et al., Reference Wheeler, Barrett, Benson, Bryant, Canese, Chetvernin, Church, Dicuccio, Edgar, Federhen, Geer, Kapustin, Khovayko, Landsman, Lipman, Madden, Maglott, Ostell, Miller, Pruitt, Schuler, Sequeira, Sherry, Sirotkin, Souvorov, Starchenko, Tatusov, Tatusova, Wagner and Yaschenko2007) available at its website (http://www.ncbi.nlm.nih.gov/blast). The screening procedure was aimed at checking the assignment of the specimens to high-level categories (e.g., family and subfamily). Next, the sequences were edited and aligned using the Staden Package ver. 2006.1.7.0 software (Staden et al., Reference Staden, Beal, Bonfield, Misener and Krawetz1999). All peaks were checked for wrong base calls and noise and were cleaned when required. The two alignments were visually assessed without requiring any insertion–deletion (indel) typing for the cox1 gene, whereas for the nuclear ef1α gene a little indel typing was needed within the encompassed intronic region. The latter sequences were also checked for heterozygous positions, and the gametic phases, where needed, were inferred with Phase version 2.1 (Stephens et al., Reference Stephens, Smith and Donnelly2001). Finally, both alignments were collapsed using FaBox tool (Villesen, Reference Villesen2007) to retain the scored haplotypes only.
Statistical analyses
Divergence analyses and Neighbour-Joining (NJ; Saitou & Nei, Reference Saitou and Nei1987) tree inference were performed for both markers by means of Molecular Evolutionary Genetics Analysis, version 5.2 (MEGA5), setting the p uncorrected model for the genetic distance values computation (Tamura et al., Reference Tamura, Dudley, Nei and Kumar2007). Confidence at tree nodes was determined by bootstrapping 1000 times over the data. Genetic divergence was estimated as p uncorrected distance computed as net averages among the groups scored on the inferred NJ topology.
Bayesian analyses were performed using Beast version 1.8.0 (Drummond et al., Reference Drummond, Suchard, Xie and Rambaut2012) under the substitution model(s) selected by AICc in jModelTest 2 for each marker/partition analysed (Darriba et al., Reference Darriba, Taboada, Doallo and Posada2012). The HKY + I + G substitution model was selected for cox1, while the ef1α nuclear marker was modelled by setting three partitions, namely the coding and noncoding regions of the gene (exons and introns both with HKY substitution model with estimated base frequencies and no model for site heterogeneity) and the indels that were scored during the alignments of the sequences (stochastic Dollo model). We used the lognormal relaxed-clock model implemented in the software to take into account the variation of the substitution rate among lineages (prior distribution set as Exponential with initial value 1.0, mean 10.0 and offset 0.0). The tree prior was set using the Constant coalescent Kingman model (Kingman, Reference Kingman1982). The analysis was carried out using a random starting tree, running two Markov chains for 50 × 106 generations and sampling every 1000 generations. Finally the same analysis was performed sampling from priors only to evaluate the priors that we applied to the various parameters. Convergence was evaluated with Tracer version 1.6 (Rambaut et al., Reference Rambaut, Suchard and Drummond2013), and the two chains were combined with Logcombiner routine of Beast, discarding 12,500 burn-in trees each; the combined set of trees for each marker was summarized as a Maximum clade credibility tree with Beast's Treeannotator routine.
Degree of genetic divergence is related to the taxon under study, and there is no universal yardstick for unequivocally assigning a taxonomic rank to a scored value of genetic divergence (Blaxter, Reference Blaxter2004; Moritz & Cicero, Reference Moritz and Cicero2004). This is a key problem when studying species, or populations, closely related to each other or recently diverged. The issue is commonly referred to as the species delimitation problem. Authors adopting the barcoding approach argue that a certain amount of genetic divergence between groups, contrasted to the within-groups divergence (barcoding gap) should be used as a guideline for species delimitation (Hebert et al., Reference Hebert, Stoeckle, Zemlak and Francis2004). This approach has been enthusiastically supported or criticized owing to many issues related to sampling effort, incomplete lineage sorting and hybridization of recently diverged species and so on (Tautz et al., Reference Tautz, Arctander, Minelli, Thomas and Vogler2003; Janzen, Reference Janzen2004; Moritz & Cicero, Reference Moritz and Cicero2004; De Salle et al., Reference DeSalle, Egan and Siddall2005; DeSalle, Reference DeSalle2006). Recent years have seen many discussions and contributions on this issue, producing several noteworthy methods (Wiens, Reference Wiens2007; Ence & Carstens, Reference Ence and Carstens2011; Fujita et al., Reference Fujita, Leaché, Burbrink, McGuire and Moritz2012). We have adopted three models/methods to analyse our datasets: (a) a classical phylogenetic approach by using both the NJ algorithm and the Bayesian inference implemented in Beast (Drummond et al., Reference Drummond, Suchard, Xie and Rambaut2012); (b) the Automatic Barcoding Gap Discovery (ABGD) approach(Puillandre et al., Reference Puillandre, Lambert, Brouillet and Achaz2012), as a fast and simple method to discover partitions in our datasets; and (c) the General Mixed Yule Coalescent (GMYC) model (Pons et al., Reference Pons, Barraclough, Gomez-Zurita, Cardoso, Duran, Hazell, Kamoun, Sumlin and Vogler2006; Fontaneto et al., Reference Fontaneto, Herniou, Boschetti, Caprioli, Melone, Ricci and Barraclough2007; Monaghan et al., Reference Monaghan, Wild, Elliot, Fujisawa, Balke, Inward, Lees, Ranaivosolo, Eggleton, Barraclough and Vogler2009; Fujisawa & Barraclough, Reference Fujisawa and Barraclough2013), which helps in seeking the threshold that marks the transition between evolutionary dynamics within and among species, thus suggesting those clusters to be considered as distinct species on a phylogenetic tree.
The ABGD method (Puillandre et al., Reference Puillandre, Lambert, Brouillet and Achaz2012) stems from the barcoding methodology, which was originally focused on the identification of biological samples using a standard nucleotide sequence (a 5′ fragment of the mitochondrial cox1 gene) compared with a reference dataset of previously characterized species. The method aims at defining partitions in a set of cox1 sequences that must be considered as hypotheses of prospective distinct species to further investigate in an integrative framework. The partitions are defined by analysing the distribution of all pairwise distances between sequences in order to locate the most reliable ‘barcode gap’ between the intraspecific and interspecific divergence. After the initial partitions are defined, the algorithm is performed in a recursive way until no new partitions are defined. Our analyses were carried out on the alignment of all 165 cox1 sequences of the analysed ingroup (T. horridus species complex) by using the ABGD method as available on the website http://wwwabi.snv.jussieu.fr/public/abgd/ (Puillandre et al., Reference Puillandre, Lambert, Brouillet and Achaz2012; last access 26/02/2015) with the following parameters: Pmin 0.001; Pmax 0.1; Steps 10; X (relative gap width) 1.5; Nb bins (for distance distribution) 20; Simple distance.
The GMYC method (Pons et al., Reference Pons, Barraclough, Gomez-Zurita, Cardoso, Duran, Hazell, Kamoun, Sumlin and Vogler2006; Fontaneto et al., Reference Fontaneto, Herniou, Boschetti, Caprioli, Melone, Ricci and Barraclough2007; Monaghan et al., Reference Monaghan, Wild, Elliot, Fujisawa, Balke, Inward, Lees, Ranaivosolo, Eggleton, Barraclough and Vogler2009; Fujisawa & Barraclough, Reference Fujisawa and Barraclough2013) is aimed at modelling in a probabilistic framework both the coalescence processes that occur within species at population level, as described by topology and length of the branches of a phylogenetic gene tree, and the speciation processes occurring at a certain level of divergence and identified as a threshold above which all nodes describe speciation events as defined by the Yule speciation model (Yule, Reference Yule1925). This approach thus combines standard coalescent models that consider the diversification within populations (Hudson, Reference Hudson, Futuyma and Antonivics1991; Wakeley, Reference Wakeley2008) with those models that describe the branching pattern of speciation events (Nee, Reference Nee1994, Reference Nee2001; Nee et al., Reference Nee, May and Harvey1994). The method evaluates, by means of a likelihood test, alternative scenarios by assessing several thresholds as a boundary between intra- and inter-specific dynamics, and fitting the best one for delimiting the species encompassed by the gene tree under analysis. The analyses were performed on the cox1 dataset by using the multiple-threshold version of the method (Monaghan et al., Reference Monaghan, Wild, Elliot, Fujisawa, Balke, Inward, Lees, Ranaivosolo, Eggleton, Barraclough and Vogler2009) implemented by the R package splits (Ezard et al., Reference Ezard, Fujisawa and Barraclough2009) version 1.0–18 with the following parameters: method = ‘multiple’, interval = c(0, 10).
Morphological analysis
In order to test the taxonomic pattern revealed by the molecular analyses, we performed a morphological analysis of the specimens used in molecular work. We also studied the T. mortadelo holotype, although we were not permitted to extract DNA from it for analysis. Morphological data collected by one of us (Enzo Colonnelli) over many years of observations from hundreds of specimens preserved in museums and private collections worldwide were also used. We found that the only available key (Alonso-Zarazaga & Sánchez-Ruiz, Reference Alonso-Zarazaga and Sánchez-Ruiz2002) to these Trichosirocalus species was unreliable to identify the three purported species of the T. horridus complex. In the following section we list the few characters that permit identification of the valid species. The morphological characters of specimens were primarily studied using a Wild M5 microscope with up to 50× magnification. Among the measures reported by Alonso-Zarazaga & Sánchez-Ruiz (Reference Alonso-Zarazaga and Sánchez-Ruiz2002), we selected and reported here only the total body length, as all other ratios quoted in the above paper, and verified by us upon studied specimens, were variable to such an extent as to be generally useless to discriminate the species of this complex. Only the body length measures were diagnostic for species discrimination. Photographs of the holotype of T. mortadelo were taken with a Nikon D90 camera fitted with an AF Micro Nikkor 60 mm lens and then enhanced using the programmes Helicon Focus and Adobe Photoshop PS4.
Results and discussion
Molecular genetic analyses
We obtained a fragment of nearly 650 bp from 168 individuals collected in the field for the cox1 marker and a fragment of nearly 880 bp from 134 specimens for the ef1α nuclear marker. Only the cox1 marker was successfully amplified from the outgroup taxon, T. troglodytes. The alignment was cut at the shortest aligned sequence, giving a final set of sequences each 621 bp long for cox1 and 760 bp for ef1α. The two collapsed alignments consisted of 45 and 10 unique haplotypes, respectively, for cox1 and ef1α, and Tables S2 and S3 (see supplementary material) list the distribution of the scored haplotypes for the two markers among all sequenced specimens and the accession numbers of the nucleotide sequences deposited in the NCBI/EMBL/DDBJ databanks.
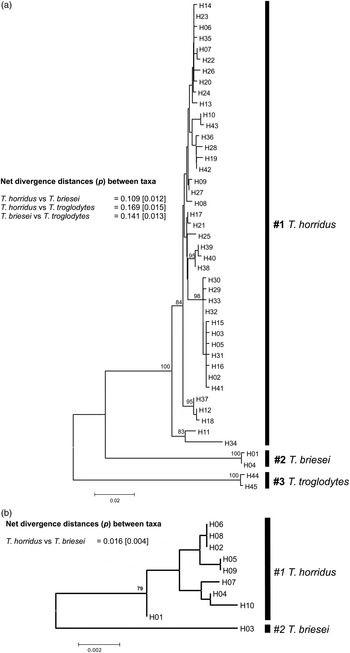
The topologies obtained by NJ, that performed on the data of the p uncorrected distance pairwise matrix, are illustrated in fig. 2a, b. Both trees (cox1 and ef1α) show two clear clusters in the analysed ingroup (T. horridus species complex) with good bootstrap support (100 on cox1 tree; 79 on ef1α). In fig. 2a, b, the p uncorrected distance values among the scored groups are listed. The p values between the two clusters, representing T. horridus and T. briesei, are 0.109 and 0.016 for cox1 and ef1α, respectively. The T. horridus cluster is somewhat variable (average within-p distance = 0.015 and 0.003 for cox1 and ef1α, respectively), showing a structure grossly related to the sampled geographical areas (i.e., Spain, France, Germany [including Canada, Australia and New Zealand], Italy [including the USA], Turkey and Georgia). On the other hand, the T. briesei cluster is relatively homogeneous, with low p values (average within distance = 0.002 and 0.000 for cox1 and ef1α, respectively), also mirroring the smaller extent of the geographical distribution of the sampled individuals.
NJ trees for (a) cox1 and (b) ef1a genes. Net divergence distances (p) between T. briesei, T. horridus and T. troglodytes. Numbers at nodes are bootstrap values. Tip labels refer to haplotypes scored and listed in Table S2 for cox1 and Table S3 for ef1a.

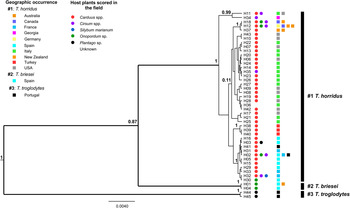
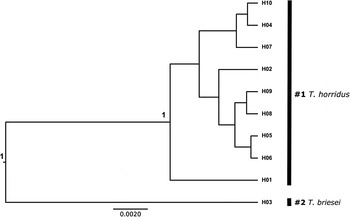
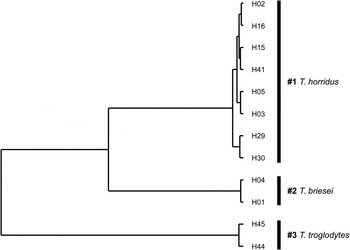
Maximum clade credibility trees from the Bayesian analyses are depicted in figs 3 and 4; again both trees display two clusters in the ingroup, with high support values (e.g., posterior probability 1.0 for both T. horridus and T. briesei cox1). As for the NJ trees, one of the two clusters encompasses a larger amount of genetic variation, probably due to a wider geographical distribution of the sampled individuals. The NJ and Bayesian topologies obtained from the analysis of all haplotypes of both markers do not differ substantially (figs 2a, b, 3 and 4), strengthening our results. The trees show quite clearly that there are two taxa in our ingroup (i.e., T. horridus and T. briesei), both with high support values (100 as bootstrap value for NJ trees and 1.0 as posterior probability in the Bayesian trees). This is also confirmed by the p distance values on the NJ tree (fig. 2a, b) and the results of the ABGD analysis (fig. 5; see below). The cluster labelled as T. horridus includes adult specimens (see Table S2 and S3 for details) collected feeding on Carduus or Cirsium and identified on morphological characters as T. horridus. It also includes a few larvae assigned to T. horridus on their genetic characters. The T. briesei cluster includes all the specimens morphologically identified as T. briesei that were collected feeding on Onopordum spp. in Spain and Australia. It is noteworthy that the specimens collected in New Zealand as larvae on the three most important host plants (C. nutans, Cirsium vulgare (Savi) Ten. and O. acanthium) were all included in the T. horridus cluster. This is contrary to the assertion by Alonso-Zarazaga & Sánchez-Ruiz (Reference Alonso-Zarazaga and Sánchez-Ruiz2002) that each of these host plants should have only one associated weevil species, T. mortadelo, T. horridus and T. briesei, respectively. This supports the previously reported conclusion of a survey carried out by Groenteman et al. (Reference Groenteman, Kelly, Fowler, Bourdôt, Julien, Sforza, Bon, Evans, Hatcher, Hinz and Rector2008) that currently only T. horridus occurs in New Zealand.
Bayesian consensus tree (50% Majority Rule) for the scored haplotypes of the cox1 gene; figures at nodes are posterior probabilities values; T. troglodytes was used as outgroup in statistical analyses; coloured squares refer to geographical distribution of haplotypes and coloured spots to the host plants on which adults were collected in the field (suggesting at least trophic association between the insect and the plant; no evaluation was made regarding the oviposition behaviour).

Consensus tree (50% Majority Rule) obtained by Bayesian analysis of ef1a haplotypes; figures at nodes are posterior probabilities values.

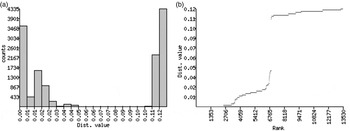
Automatic Barcoding Gap Discovery (ABGD) web results using simple distance measure of distance for cox1; (a) distribution of pairwise distances among all sampled individuals shows two modes (low and high distance values) related to intraspecific and interspecific distances, respectively; (b) the same values plotted in ranked order showing a steep slope at the barcoding gap value.

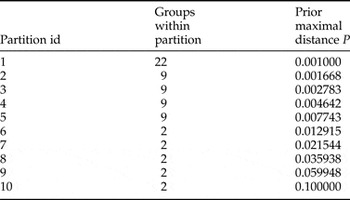
Results from the ABGD approach are depicted in fig. 5 and table 1. Figure 5a illustrates the distribution of the pairwise distances for the whole dataset, showing two modes that reflect intraspecific (low values) and interspecific (high values) distances, with a marked gap between them. The gap is mirrored in the steep slope in fig. 5b, in which the ranked pairwise distances are plotted. Table 1 lists the partitions found during the ten recursive steps in the ABGD analysis, lumping the cox1 sequences in groups as first-species-partition hypotheses (Puillandre et al., Reference Puillandre, Lambert, Brouillet and Achaz2012). Partitions 1–5 (P = 0.001000–0.007743) were excluded for the oversplitting of the sequences in a high number of first-species-partition hypotheses and the consequent incongruence with the results of the phylogenetic analyses and the ecological and morphological evidence. The incongruence was always located in the sequences assigned to T. horridus in other statistical analyses. Partitions 6–10 (P = 0.012915–0.100000) perfectly match the phylogenetic, GMYC, morphological and ecological evidence. Overall the ABGD results clearly suggest the existence of a marked barcoding gap, further strengthening the hypothesis that there are only two species in the T. horridus species complex.
Results of the ABGD method (P value representing prior maximum divergence of intraspecific diversity; in our analysis it ranging between 0.001 and 0.1).

The analyses of the relationships among the haplotypes, as depicted in the Bayesian tree of fig. 3, by using the GMYC method with multiple thresholds, resulted in an oversplitting of our dataset into more than ten putative species (fig. 6; see the figure legend for more explanation) that clearly do not correspond to evolutionary units at specific rank. Many authors have recently discussed the oversplitting behaviour of the GMYC model when sequences, or haplotypes, span a large geographical extent, suggesting poor performance of the model when isolation by distance is manifest (Bergsten et al., Reference Bergsten, Bilton, Fujisawa, Elliott, Monaghan, Balke, Hendrich, Geijer, Herrmann, Foster, Ribera, Nilsson, Barraclough and Vogler2012; Talavera et al., Reference Talavera, Dincă and Vila2013). Our group # 1 encompasses T. horridus, which we sampled from the Iberian Peninsula to Georgia. This sampling scheme captured the natural genetic variation among geographically separated populations of this taxon. We then decided to limit the influence of the divergence likely due to isolation by distance, by analysing a subset of our dataset, only including the haplotypes scored for the specimens that were sampled within the Iberian Peninsula (that includes the ingroup and the outgroup). We ran the Beast analyses with the Iberian subset of haplotypes and then applied the GMYC model. The new results, shown in fig. 7, clearly suggest, once more, to split the ingroup (T. horridus species complex) into two distinct evolutionary lineages, that is two species, which we refer to as T. horridus and T. briesei.
General Mixed Yule Coalescent (GMYC) results obtained by analysing the tree in fig. 3 that depicts the phylogenetic relationships among all haplotypes found within our cox1 dataset. Each light grey vertical bar groups haplotypes referring to putative species according to GMYC model. Likelihood values are: L 0 = 395.4515 for the null model; L GMYCmultiple = 403.1648 for the GMYC model; Likelihood Ratio Test P = 0.00045***; number of ML clusters 10 (confidence interval 3–12); number of ML entities 12 (confidence interval 3–15). The black vertical bars with species names emphasize the oversplitting likely due to the genetic variation within the T. horridus dataset.

General Mixed Yule Coalescent (GMYC) results obtained by analysing phylogenetic relationships among haplotypes scored only from the Iberian Peninsula, where T. horridus and T. briesei both occur. Black bars refer to putative species according to GMYC model. Likelihood values were: L 0 = 79.44406 for the null model; L GMYCmultiple = 84.23986 for the GMYC model; Likelihood Ratio Test P = 0.00826**.

Morphological analysis
Morphological characters of some 1550 adults were studied during a span of about 35 years, starting in the mid-1970s, when one of us (Enzo Colonnelli) was asked by the European Biological Control of Weeds Laboratory (EBCL) of the United States Department of Agriculture to identify specimens of Trichosirocalus reared chiefly from C. nutans and C. macrocephalus Desf. prior to the importation of adults weevils from Italy into the USA for biological control Musk Thistle (Kok, Reference Kok2001). EBCL scientists provided also precise collecting and biological data for Trichosirocalus (Boldt & Campobasso, Reference Boldt and Campobasso1978, Reference Boldt and Campobasso1981; Boldt et al., Reference Boldt, Campobasso and Colonnelli1980), until then poorly known apart from scattered records of adults or larvae and the plants on which they were found (Perris, Reference Perris1877; Kleine, Reference Kleine1910; Wagner, Reference Wagner1944; Hoffmann, Reference Hoffmann1955; Scherf, Reference Scherf1964; Dieckmann, Reference Dieckmann1972). The life history and host plants of the T. horridus complex were extensively studied before and after the release in the USA, Canada, Australia and New Zealand (Ward et al., Reference Ward, Pienkowski and Kok1974; Kok, Reference Kok1975; Trumble & Kok, Reference Trumble and Kok1979; Boldt et al., Reference Boldt, Campobasso and Colonnelli1980; Boldt & Campobasso, Reference Boldt and Campobasso1981; Rizza & Spencer, Reference Rizza and Spencer1981; Jessep, Reference Jessep1989; Kok & Mays, Reference Kok and Mays1989; Briese et al., Reference Briese, Sheppard, Zwölfer and Boldt1994, Reference Briese, Walker, Pettit and Sagliocco2002c ; Woodburn, Reference Woodburn1997). However, after the description of T. briesei and T. mortadelo by Alonso-Zarazaga & Sánchez-Ruiz (Reference Alonso-Zarazaga and Sánchez-Ruiz2002) there were very few records of either of these species, apart from the inclusion of their names in a world catalogue (Colonnelli, Reference Colonnelli2004) and in a Palaearctic catalogue (Colonnelli, Reference Colonnelli, Löbl and Smetana2013) of Ceutorhynchinae, and the mention by Groenteman et al. (Reference Groenteman, Kelly, Fowler, Bourdôt, Julien, Sforza, Bon, Evans, Hatcher, Hinz and Rector2008) of their possible presence in New Zealand. Trichosirocalus briesei was added by Pelletier (Reference Pelletier2012) to the fauna of Morocco based on the study by Alonso-Zarazaga & Sánchez-Ruiz (Reference Alonso-Zarazaga and Sánchez-Ruiz2002) and recorded from some additional Spanish localities reported by Alonso-Zarazaga et al. (Reference Alonso-Zarazaga, Sánchez-Ruiz and Domingo-Quero2006) and Alziar & Lemaire (Reference Alziar and Lemaire2012), whereas T. mortadelo was just recorded from Germany after Alonso-Zarazaga & Sánchez-Ruiz (Reference Alonso-Zarazaga and Sánchez-Ruiz2002) by Rheinheimer & Hassler (Reference Rheinheimer and Hassler2010), who also expressed, on page 782, some doubts about the distinctiveness of these two species. None of these reports was based on new material or a critical evaluation of the study by Alonso-Zarazaga & Sánchez-Ruiz (Reference Alonso-Zarazaga and Sánchez-Ruiz2002).
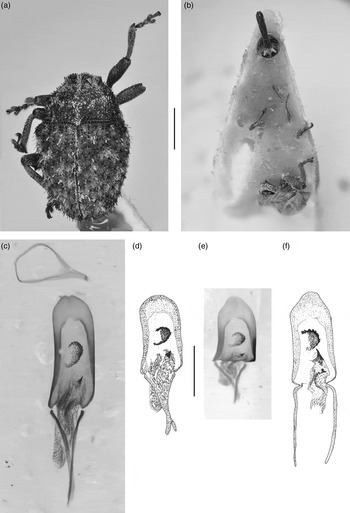
Our morphological study of the T. horridus complex revealed that some characters used by Alonso-Zarazaga & Sánchez-Ruiz (Reference Alonso-Zarazaga and Sánchez-Ruiz2002), including the different host plants, are either unreliable or erroneous, due to both the possibility of T. horridus developing on Cirsium, Carduus and Onopordum (Hoffmann, Reference Hoffmann1955; Scherf, Reference Scherf1964; Dieckmann, Reference Dieckmann1972; Groenteman et al., Reference Groenteman, Kelly, Fowler, Bourdôt, Julien, Sforza, Bon, Evans, Hatcher, Hinz and Rector2008) and the morphological variability of this species across its wide geographical range (EC, personal observation). In addition, due to morphological variability, the shape of spermatheca is not diagnostic, and the softness of the ovipositor subjects it to easy deformation. Our examination of the aedeagi of numerous specimens indicates that the differences between T. horridus and T. mortadelo, as stated by Alonso-Zarazaga & Sánchez-Ruiz (Reference Alonso-Zarazaga and Sánchez-Ruiz2002), are due to their depiction from slightly different angles of view. Unfortunately the aedeagus of the holotype of T. mortadelo is embedded in Dimethyl hydantoin formaldehyd (DMHF) and we did not have permission to dissolve this mounting medium in order to better examine the aedeagus. However, in apical view the apex of the penis is sinuous like those of all other T. horridus males we studied (fig. 8e). In addition, the temones (the pair of basal apodemes of the penis) are not really as short as depicted in their figures (fig. 8c, d). We thus conclude that the shape of the penis of the T. mortadelo holotype falls within the variation of T. horridus (fig. 8e, f) as described in Alonso-Zarazaga & Sánchez-Ruiz (Reference Alonso-Zarazaga and Sánchez-Ruiz2002) and that genital differences illustrated by these authors appear to be due to improper mounting, which changes the angle of view of the curved penis (fig. 8c, e). Also, the appearance of the internal sac of T. mortadelo, as sketched in fig. 17 of Alonso-Zarazaga & Sánchez-Ruiz (Reference Alonso-Zarazaga and Sánchez-Ruiz2002), depends on how the triangular spiculum is placed inside the soft internal sac of the studied individual. Therefore this character is also unreliable.
Photos of holotype of Trichosirocalus mortadelo Alonso-Zarazaga & Sánchez-Ruiz (a and b). Aedeagus embedded in DMHF in dorsal (c) and dorsoapical (e) view. Drawing of penis in dorsal view (d) by Alonso-Zarazaga & Sánchez-Ruiz (Reference Alonso-Zarazaga and Sánchez-Ruiz2002). Drawing of penis in dorsal view (f) of T. horridus (Panzer) by Alonso-Zarazaga & Sánchez-Ruiz (Reference Alonso-Zarazaga and Sánchez-Ruiz2002).

In conclusion, our morphological and genetic analyses support the recently established synonymy by Pullen et al. (Reference Pullen, Jennings and Oberprieler2014) of T. mortadelo Alonso-Zarazaga & Sánchez-Ruiz (Reference Alonso-Zarazaga and Sánchez-Ruiz2002) with T. horridus (Panzer, 1801). Our results also confirm the contention that only one species (T. horridus) was introduced to New Zealand (Groenteman et al., Reference Groenteman, Kelly, Fowler, Bourdôt, Julien, Sforza, Bon, Evans, Hatcher, Hinz and Rector2008; Cullen & Sheppard, Reference Cullen, Sheppard, Julien, McFadyen and Cullen2012; Sagliocco et al., Reference Sagliocco, Kwong, Morley, Julien, McFadyen and Cullen2012). We conclude that the T. horridus complex includes only two species, T. horridus (Panzer, 1801) and T. briesei Alonso-Zarazaga & Sánchez-Ruiz (Reference Alonso-Zarazaga and Sánchez-Ruiz2002).
Ecological data from the literature also do not support the existence of more than two different species in the T. horridus complex. In fact, Ward et al. (Reference Ward, Pienkowski and Kok1974) reported the possibility of neonate Italian T. horridus developing up to the third instar on Carduus and Cirsium, but not on Cynara, in larval transfer experiments. This scenario was described in previous experiments carried out by Zwölfer (Reference Zwölfer1965). Boldt et al. (Reference Boldt, Campobasso and Colonnelli1980) dissected plants growing in the field in Italy and found most larvae in C. nutans, with small numbers in C. pycnocephalus and Galactites tomentosa, but none in Onopordum, Silybum, Carthamus, Cynara or Sonchus. May (Reference May1993) described the larva of T. horridus completing its development on Carduus in New Zealand. Woodburn & Swirepik (Reference Woodburn, Swirepik, Spafford Jacob, Dodd and Moore2002) were able to establish T. horridus on Cirsium vulgare in Western Australia but concluded this host to be less suitable than C. nutans. Groenteman et al. (Reference Groenteman, Kelly, Fowler, Bourdôt, Julien, Sforza, Bon, Evans, Hatcher, Hinz and Rector2008) reported T. horridus from C. nutans, C. vulgare and O. acanthium in New Zealand, and the results of our genetic analyses confirm that all the specimens received from these three plants in that country are T. horridus. In the USA, Trichosirocalus weevils were released to control Carduus spp. but have been reported to attack also Cirsium discolor (Muhl. ex Willd.) Spreng. in Virginia (McAvoy et al., Reference McAvoy, Kok and Mays1987), Cirsium altissimum L. Hill in Nebraska (Takahashi et al., Reference Takahashi, Louda, Miller and O'Brien2009) and C. altissimum, C. carolinianum (Walt.) Fern & Schub., C. discolor, C. horridulum Michx. and C. muticum Michx. in Tennessee (Wiggins et al., Reference Wiggins, Grant, Lambdin, Ranney and Wilkerson2009). All specimens that we have morphologically and genetically analysed from the USA are T. horridus.
Finally, during our fieldwork adult specimens of T. horridus were collected on Carduus spp. and Cirsium spp. in complete syntopy (e.g., Perpignan, France [personal records]; Otago, New Zealand [Groentman, personal communications]), whereas T. briesei was only collected on Onopordum spp., often growing together in the same location with the other thistle species.
We agree with Alonso-Zarazaga & Sánchez-Ruiz (Reference Alonso-Zarazaga and Sánchez-Ruiz2002) that T. horridus is on average smaller (total body length 3.20–4.16 mm, almost all specimens less than 3.90 mm) than T. briesei (total body length 3.96–4.64 mm). Reliable morphological features that can be used to identify female specimens of T. briesei are the size, usually well above 4.10 mm (whereas we found only a few specimens of T. horridus larger than 4 mm), together with the longer second desmomere (funicular joint), at least five times longer than wide. Males of T. briesei are quite easy to identify using the external characters given by Alonso-Zarazaga & Sánchez-Ruiz (Reference Alonso-Zarazaga and Sánchez-Ruiz2002) in their key (see also their figures): protibial mucro not concealed by apical setae; sternite 2 tumid at middle and much more convex than on sides, hind margin prominent at middle over third sternite. However, the length of the second desmomere is quite variable in T. horridus, although all T. horridus specimens studied by us have this segment more or less distinctly shorter than it is in T. briesei.
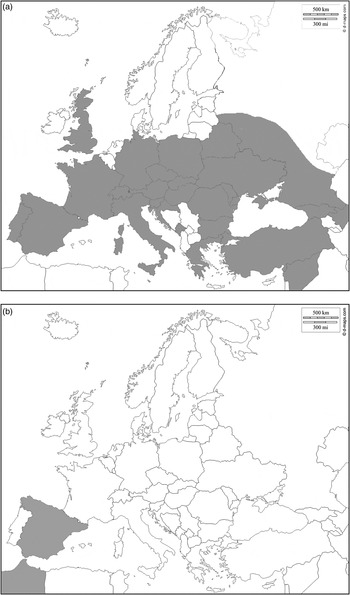
Regarding the geographical distribution of T. horridus and T. briesei, current data support the presence of T. briesei only in Spain, from where we studied several adults, and Morocco (Alonso-Zarazaga & Sánchez-Ruiz, Reference Alonso-Zarazaga and Sánchez-Ruiz2002). The single female from Austria cited by Alonso-Zarazaga & Sánchez-Ruiz (Reference Alonso-Zarazaga and Sánchez-Ruiz2002) was not seen by us but is probably a large individual of T. horridus. Of the latter species we studied material from Austria, Canada, France, Dagestan, Georgia, Germany, Italy, New Zealand, Portugal, Spain, Turkey and USA, and reliable literature records exist from Armenia, Azerbaijan, Belarus, Belgium, Bulgaria, Croatia, Czech Republic, Great Britain, Hungary, Moldavia, Montenegro, Poland, Romania, southern European Russia, Slovakia, Slovenia, Switzerland, Syria and Ukraine (Colonnelli, Reference Colonnelli2004, Reference Colonnelli, Löbl and Smetana2013). The distribution of T. horridus is shown in fig. 9a, that of T. briesei in fig. 9b.
Estimated native distribution of T. horridus (a) and T. briesei (b).

Conclusions
Our results indicate that T. horridus is a widespread, genetically and morphologically variable species that is associated with several thistle species in the tribe Cardueae (Carduus spp., Cirsium spp. and Onopordum spp.) and that occurs from Spain to the Caucasus, whereas T. briesei is restricted to Onopordum and naturally occurs only in Spain and Morocco. We found no evidence of the existence of a third species that would correspond to T. mortadelo, and we confirm that this name is a synonym of that of T. horridus, as established by Pullen et al. (Reference Pullen, Jennings and Oberprieler2014). The key of Alonzo-Zarazaga & Sánchez-Ruiz (Reference Alonso-Zarazaga and Sánchez-Ruiz2002) is suitable for distinguishing T. horridus and T. briesei. To date, specimens from North America and New Zealand correspond to only T. horridus, whereas both T. horridus and T. briesei are established in Australia. Given the diverse genetic structure of T. horridus (compared with the more restricted geographical distribution and genetically less differentiated T. briesei), it could be interesting to explore its population structure across the geographical distribution area in more depth, for biological control purposes. Finally, it would be interesting to investigate the possible evolution of host shifting in New Zealand populations of T. horridus associated with Onopordum.
Supplementary Material
The supplementary material for this article can be found at http://www.journals.cambridge.org/BER
Acknowledgements
We are grateful to all colleagues and friends who assisted our study in some way; many of them by collecting specimens and others in supporting our activities in various ways: Eric M. Coombs (Oregon Department of Agriculture, OR, USA), Rosemarie De Clerck-Floate (Lethbridge Research Centre, Lethbridge, AB, Canada), Marsha DeWolf (Ministry of Forests and Range, BC, Canada), Franca Di Cristina (BBCA Onlus, Rome, Italy), Andre Gassmann (CABI, Delemont, Switzerland), Richard A. Grantham (Oklahoma State University, OK, USA), Ronny Groenteman (Landcare Research, Lincoln, New Zealand), Michèle Guedj (BBCA Onlus, Rome, Italy), Francesca Lecce (ENEA Casaccia, Rome, Italy), John Lester (CSIRO, Canberra, Australia), Anna Metaponte (Rome, Italy), Alessandra Paolini (BBCA Onlus, Rome, Italy), Simona Primerano (Rome, Italy), Francisco Salgueira (Andoain, Spain), Gabriele Senia (Rome, Italy), Peter Sprick (Hannover, Germany), Thierry Thomann (CSIRO Entomology European Laboratory, Montferrier sur Lez, France), Greg Wiggins (University of Tennessee, Knoxville, TN, USA), and Iñigo Ugarte San Vicente (Agurain, Αlava, Spain). We are deeply indebted to Mercedes París García and Miguel Ángel Alonso-Zarazaga of the Museo Nacional de Ciencias Naturales of Madrid (Spain) for giving us the possibility to study the holotype of Trichosirocalus mortadelo. A special thanks goes to Francesco Sacco, who provided his expertize to photograph the holotype of T. mortadelo and of all genitalia. This work was carried out with the financial support from the Agreement between Sapienza Rome University (Italy) and BBCA Onlus (Rome, Italy) 2011–2013 ‘Genetic characterization of populations of species of phytophagous insects for the biological control programmes’. USDA is an equal opportunity provider and employer.