
1. Introduction
The ongoing progress in combustion systems for advanced propulsion, along with the numerical modelling of two-phase combustion, has spurred extensive research into the fundamental dynamics of shock wave interactions with multiphase flows. One of the important applications of flame–shock interaction includes scramjet combustors that operate with high-speed supersonic intake air as the oxidiser. These combustors contain complex flow features, including shock waves, expansion fans, boundary layers, etc., and the interaction of the flame with these features becomes the key in the development of scramjet engines (Roy & Edwards Reference Roy and Edwards2000). Liquid fuel, compared with gaseous fuels, offers an intrinsic advantage of higher volumetric energy density, which is desirable for propulsion applications (Anderson & Schetz Reference Anderson and Schetz2005; Patten et al. Reference Patten, Malik, Salauddin and Ahmed2023). Thus, the interaction between individual combusting fuel droplets (formed from spray atomisation) and the shock structures becomes essential for the combustion process.
Another application where the shock–flame interactions are relevant is the detonation-based engines, which offer higher theoretical efficiencies compared with deflagration engines. Studies have demonstrated that utilising detonations, rather than deflagrations, to release the fuel's energy can potentially enhance the specific impulse of an air-breathing engine (Kashdan et al. Reference Kashdan, Hanson, Piper, Davidson and Hanson2004). The phenomena of the deflagration to detonation transition (DDT) and shock wave-induced combustion in liquid fuels are highly relevant in such applications (Kashdan et al. Reference Kashdan, Hanson, Piper, Davidson and Hanson2004; Ciccarelli, Johansen & Parravani Reference Ciccarelli, Johansen and Parravani2010; Wei et al. Reference Wei, Xu, Zhou, Gao and Zhao2017; Dyson et al. Reference Dyson, Arakelyan, Berube, Briggs, Ramirez, Thurmond, Kim, Green, Udaykumar and Vasu2022; Patten et al. Reference Patten, Malik, Salauddin and Ahmed2023). Furthermore, fire-fighting applications also employ explosives for extinguishment of large-scale fires or oil well fires (high fuel flow rate), which are harder to extinguish by conventional methods (Chan et al. Reference Chan, Giannuzzi, Kabir, Hargather and Doig2016; Yoshida & Torikai Reference Yoshida and Torikai2024). This blast extinguishing method blows off the fire due to the fluid dynamical effects of the blast wave, and the flame–shock interactions are essential in such applications as well.
The interaction of a flame with a shock wave/acoustic wave is associated with various flame instabilities (Jiang et al. Reference Jiang, Takayama, Babinsky and Meguro1997; Khokhlov et al. Reference Khokhlov, Oran, Chtchelkanova and Wheeler1999; Maley et al. Reference Maley, Bhattacharjee, Lau-Chapdelaine and Radulescu2015; Tyaktev et al. Reference Tyaktev, Pavlenko, Anikin, Bugaenko and Piskunov2020) which affect the configuration and propagation of flames, especially in confined chambers. Wei et al. have also shown that the flame–shock interaction plays a significant role in flame heat release rate enhancement due to flame distortions (Wei et al. Reference Wei, Xu, Zhou, Gao and Zhao2017). Thomas, Bambrey & Brown (Reference Thomas, Bambrey and Brown2001) showed enhancement in combustion driven by chemi-acoustic interactions and gas-dynamics effects when laminar flame bubbles were perturbed successively by incident and reflected shock waves. The shock–flame interactions show that the spherical bubble transforms into a toroidal shape due to vorticity generation (Ju, Shimano & Inoue Reference Ju, Shimano and Inoue1998; Picone & Boris Reference Picone and Boris1988). It is also shown that, as the shock strength is increased, the local gas temperature and pressure increase, which results in a DDT in the immediate vicinity of the reaction front. Researchers like Wei et al. (Reference Wei, Xu, Zhou, Gao and Zhao2017) and Ciccarelli et al. (Reference Ciccarelli, Johansen and Parravani2010) studied flame–shock interaction in a confined chamber by obstructing the flame propagation using a perforated plate. Different combustion modes were reported, which involve flame acceleration, DDT and autoignition. Dong, Fan & Ye (Reference Dong, Fan and Ye2008) numerically investigated the interaction of a spherical flame bubble with an incident planar shock wave. They showed that the hydrodynamic processes play a more important role than the chemical processes. Numerical investigations by Khokhlov et al. (Reference Khokhlov, Oran, Chtchelkanova and Wheeler1999) showed that interaction between shocks and flames is responsible for maintaining highly turbulent flame through Richtmyer–Meshkov (RM) instability and is essential for DDT to occur by creating local hotspots. The results show that the RM instability contributes to the flame stability and enhancement of mixing.
A typical shock wave is a shock front that is followed by constant flow properties (steady flow), and a blast wave is a shock front with exponentially decaying flow properties (unsteady) behind it, which is characterised by a temporally decaying Mach number (Apazidis & Eliasson Reference Apazidis and Eliasson2019). It has been established that the blast wave initially exhibits a pseudo-steady shock front behaviour and shows minimal variation in shock Mach number and, thus, minor change in properties. However, as it propagates further, it exhibits nonlinearity, thus deviating from the linear steady shock behaviour, and it eventually approaches a weak blast wave limit, thus behaving as an acoustic wave (Almustafa & Nehdi Reference Almustafa and Nehdi2023). Wei & Hargather (Reference Wei and Hargather2021) developed a scaling based on dimensional analysis for estimating the shock trajectory. It is shown that, for a strong shock limit (Ms > 5), the temporal evolution of shock radius approximately follows a power law with an exponent 2/5, and for a weak shock limit ( ${M_s}\to 1$), the shock radius is a linear function of time. The decaying blast wave is shown to follow the strong shock limit in the early stages of a high energy blast wave (only valid for nuclear-scale explosions) and gradually transition into an intermediate phase, finally asymptotically approaching the acoustic limit in the far field (Díaz & Rigby Reference Díaz and Rigby2022). In the current experiments, the Mach number of blast wave is in the range of
 $(1.02 < {M_s} < 1.5)$ which is in the intermediate transition regime near the weak blast wave limit.
A blast wave is characterised by a discontinuity in properties such as peak overpressure, which continuously decays away from the blast wave. As the blast wave propagates, the pressure at a given point temporally decays initially from the maximum value (positive phase), which further decays below zero, thus attaining negative pressures in later stages. Regardless of source geometry, it is observed that the blast wave shock front eventually attains a notably spherical form after propagating sufficient distance (Almustafa & Nehdi Reference Almustafa and Nehdi2023). Researchers like Taylor (Reference Taylor1950), Sedov (Reference Sedov1957) showed that a self-similar solution is only valid for the strong shock regime (i.e.  $1/{M_s} \to 0$) that occurs during the initial stages of the blast wave. Later, for intermediate shock strengths, a departure from the self-similar solution due to counterpressure effects is observed, which is accounted for in the perturbation solution using the approximate linear velocity profile solution by Sakurai (Reference Sakurai1956) and the quasi-similar solution of Oshima (Reference Oshima1960).
In the analyses by Rae (Reference Rae1965) and Lee (Reference Lee1965), a power-law density profile behind the blast wave has been obtained whose exponent can be evaluated from the mass integral. Bach & Lee (Reference Bach and Lee1970) showed that the particle velocity profile behind the blast wave can be obtained using the density profile and the mass conservation differential equation. Thus, the obtained density and velocity profiles can be used to obtain pressure profiles using the momentum equation. Using the energy integral, the shock decay coefficient dependence with respect to the Mach number (Ms) can be obtained in the form of a first-order differential equation from which the shock profile can be estimated. This approximate analytical solution based on the power-law density profile assumption provided by Bach & Lee (Reference Bach and Lee1970) is observed to be in good agreement with the exact numerical solution by Goldstine & von Neuman (Reference Goldstine and von Neumann1963), even at the low shock strength regime ( ${M_s} \to 1$) along with the strong shock limit (
 $1/{M_s} \to 0$).
Current experiments focus on the flame and droplet response during their interaction with the flow imposed by the blast wave. Droplet combustion has been a significant area of research due to its relevance to spray combustion across a multitude of applications such as power generation and basic transportation to aero propulsion. Although droplet combustion cannot be directly extended to practical results for reacting sprays, it provides insights into the local phenomena such as flame stabilisation, forward extinction, blow-off, pollutant formation, etc., under well-controlled conditions (Williams Reference Williams1973). For a quiescent burning droplet, fuel vaporises at the droplet surface, and a diffusion flame is formed at the stoichiometric plane enveloping the droplet. The d 2-law law has been established as the droplet diameter (d) regression model, and researchers have investigated droplet combustion in both micro-gravity and gravitational environments (Law & Williams Reference Law and Williams1972; Hara & Kumagai Reference Hara and Kumagai1994; Huang & Chen Reference Huang and Chen1994). It has been reported that the relative motion between the droplet and surrounding gases alters the vaporisation characteristics and flame configuration. The flame undergoes local extinction at the forward stagnation point and transitions into the droplet wake under the influence of external flow, and such investigations provide insights into local extinction events that occur in spray combustors. The combustion experiments have been conducted by Balakrishnan, Sundararajan & Natarajan (Reference Balakrishnan, Sundararajan and Natarajan2001) to investigate the enveloped flame shape characteristics in a mixed convective environment. Researchers have also conducted pendant droplet experiments under different externally imposed flows and studied aspects like droplet regression rate, internal boiling and secondary atomisation, which enhances the heat release rate of the flame (Basu & Miglani Reference Basu and Miglani2016; Guerieri et al. Reference Guerieri, DeCarlo, Eichhorn, Connell, Yetter, Tang, Hicks, Bowen and Zachariah2015; Guerieri, DeLisio & Zachariah Reference Guerieri, DeLisio and Zachariah2017). Researchers like Pandey et al. (Reference Pandey, Basu, Vadlamudi, Potnis and Chattopadhyay2020), Vadlamudi, Thirumalaikumaran & Basu (Reference Vadlamudi, Thirumalaikumaran and Basu2021) and Vadlamudi, Aravind & Basu (Reference Vadlamudi, Aravind and Basu2023) have investigated the effect of continuously varying external flow on a combusting droplet in a free fall configuration using drop tower experiments. The flame stabilisation criteria, flame evolution and flame topology have been investigated for the Reynolds number range of 0 < Re < 200. Pandey et al. (Reference Pandey, Basu, Krishan and Vadlamudi2021) and Thirumalaikumaran et al. (Reference Thirumalaikumaran, Vadlamudi and Basu2022) performed pendant droplet experiments to investigate the flame-shedding phenomena based on the circulation buildup mechanism.
In current experiments, flame–shock interactions are investigated by studying the interaction of a combusting droplet with a temporally decaying blast wave (that propagates coaxially). Oshima (Reference Oshima1960) investigated the blast wave generated through the wire-explosion technique, in which a fine metal wire is burned out explosively by discharging a large-voltage pulse through it to generate a cylindrical blast wave. Sharma et al. (Reference Sharma, Singh, Rao, Kumar and Basu2021, Reference Sharma, Chandra, Basu and Kumar2023a,Reference Sharma, Chandra, Kumar and Basub) and Chandra et al. (Reference Chandra, Sharma, Basu and Kumar2023) conducted shock–droplet interaction experiments using the exploding wire technique using a miniature shock tube. It was shown that, during the shock interaction, the droplet dynamics broadly occurs in two stages: initial deformation and subsequent breakup. However, because of experimental limitations, normal shock assumptions were considered for the flow behind the blast wave, and the flow has not been fully characterised. However, the droplet dynamics and breakup criteria based on both the Weber number and Ohnesorge number showed that the shear-stripping mode of breakup occurs for droplet diameters significantly higher than the order of magnitude of the wavelength of the Kelvin–Helmholtz (KH) waves. The droplet breakup dynamics was shown to be qualitatively similar, even for liquid metal droplets if the surface oxidation can be restricted (which leads to flake-like breakup).
Researchers like Chan et al. (Reference Chan, Giannuzzi, Kabir, Hargather and Doig2016) studied the interaction of shock tube exhaust flow with non-premixed propane flame (perpendicular to the shock tube axis, transverse direction) and showed different types of interaction modes. The shock is generated using a conventional compressed air-driven shock tube generating low Mach numbers (Ms < 1.5) and is allowed to interact perpendicularly with a non-premixed jet flame. The non-premixed propane flame exhibited extinction either during interaction with the shock wave or with the blast wind vortex, with reignition occurring only when the flame is in the far field location. Current experiments investigate the interaction of shock waves with a combusting droplet (in the longitudinal direction), where both the flame dynamics and the droplet response have been studied. Since the experiments are conducted in the longitudinal direction, a wide range of phenomena, such as flame shedding, base lift-off, reattachment, partial extinction, reignition and full blowout, are observed.
In droplet combustion, the droplet flame is sustained on the available fuel vapour, which is dependent on the vaporisation rate at the droplet. Thus, the shock interaction with the droplet flame becomes a unique process where the shock interaction can affect the droplet dynamics as well as the fuel availability, which alters the flame dynamics. Unlike other shock–flame interaction studies in the literature, this results in simultaneous response of both droplet and flame independently of the imposed shock as well as influencing each other. In this study, a unique miniature shock generation apparatus is used to generate blast waves to achieve a wide range of Mach numbers (1.02 < Ms < 1.6) to study the interaction of blast waves with a combusting droplet. The present work focuses on the fluid dynamic (flow) aspect of the flame response during the interaction with the flow imposed by the blast wave. Building on the previous works, an attempt has been made to characterise the flow features and velocity scales imposed by the blast wave generated using the wire-explosion technique. The decaying profile behind the blast wave has been considered in the current study instead of the normal shock assumptions. Different sets of experiments were performed to better understand the flow features behind the blast wave. Additionally, the time scales involved in the two stages of the droplet dynamics were also explored in the current work, which has not been discussed in the literature. Furthermore, the interaction of combusting droplets with the flow imposed by the blast wave will be a unique and insightful addition to the existing shock–flame interaction literature as well as the droplet combustion literature.
2. Experimental methodology
A specially designed shock tube apparatus is used in current experiments where the shock wave is generated using the exploding wire technique. This technique allows the Mach number (Ms) to be controlled by altering the voltage applied for the wire explosion. The range of Mach numbers (Ms) achieved through this set-up in the current experiments is from 1.03 to 1.6. Researchers like Liverts et al. (Reference Liverts, Ram, Sadot, Apazidis and Ben-Dor2015) and Sembian et al. (Reference Sembian, Liverts, Tillmark and Apazidis2016) give a detailed overview of the exploding wire technique and its applications in shock wave generation. Compared with diaphragm-based shock tubes, this technique allows a smaller test facility size, better ease of operation and the generation of a wide range of Ms (Sembian et al. Reference Sembian, Liverts, Tillmark and Apazidis2016).
Figure 1 shows the schematic of the experimental set-up consisting of a shock generation set-up and flow visualisation camera to study the interaction of the blast wave with the combusting fuel droplet (in the longitudinal direction). The figure shows the shock generation consisting of an electrode chamber that is enclosed with a cover plate. A 2 kJ pulse power system (Zeonics Systech, India Z/46/12) is used to provide a high-voltage pulse across the electrodes by discharging a capacitor. To achieve the wire explosion, a copper wire of 35 standard wire gauge (SWG) is placed over the cover plate in electrical contact with the two electrodes (7.5 cm centre-to-centre distance) of the electrode chamber, which is, in turn, connected to a high-voltage power supply. An external BNC 745 T digital delay generator is used to synchronise and trigger all the recording devices and the shock generator by sending a trigger in the form of a transistor–transistor logic (TTL) signal at prespecified time delays. During the experiment, the capacitor is initially charged to a desired energy level (measured in kilovolts of charging) required to generate a specific shock Mach number (Ms), and the charging circuit is cut off. A 1 kV trigger signal is provided to the variable spark-gap switch as soon as an external TTL trigger signal is received to close the discharging circuit (containing the electrodes and the copper wire). As soon as the trigger signal is received and the discharging circuit is closed, the high-voltage pulse discharges through the electrodes and the copper wire, resulting in the rapid Joule heating and vaporisation of the thin copper wire. This generates a cylindrical blast wave, and this technique of producing a shock wave is known as the exploding-wire technique.
Experimental set-up: (a) simultaneous high-speed schlieren and flame imaging of the shock–droplet flame interaction performed for both open-field blast wave and shock tube focusing configurations (only open-field configuration is shown in the figure). (b) Simultaneous high-speed parallax schlieren and Mie-scattering flow visualisation of the central plane in shock tube focusing configuration. (c) The cross-sectional dimensions of the two shock tube channels. The concave mirrors (M1, M2) of different dimensions Lt, Ld are shown in the figure.

In this technique, experimentally, only the charging voltage of the capacitor (in kiloVolts) can be controlled but the energy associated with the blast wave cannot be accurately calculated due to the temporally varying wire resistance because of the continuously vaporising copper wire, due to rapid Joule heating. Thus, due to the passage of the high-voltage pulse through the wire, the melting of the metal wire followed by its vaporisation occurs. This results in an electric arc, creating a plasma that expands freely, creating a shock wave. As the shock wave pushes the liquid and vapour of the metal outwards (Sherman Reference Sherman1975; Barbaglia & Rodriguez Prieto Reference Barbaglia and Rodriguez Prieto2018; Prieto & Bilbao Reference Prieto and Bilbao2019; Shi et al. Reference Shi, Wu, Li, Murphy, Li, Li and Li2019), the circuit breaks, thus ending the process. Using the copper wire dimensions, the order of magnitude of energy associated with the heating and vaporisation of the copper wire is obtained to be ~O(102) J. Furthermore, the electrical energy supplied through the high-voltage pulse may be higher, and depends on the discharging voltage time scale of the pulse with varying resistance and current through the copper wire. The complex processes as mentioned before that are involved in wire-explosion event make it difficult to precisely calculate the copper wire's vaporisation time scale (for a specific discharge voltage pulse), which is crucial for calculating the corresponding energy associated with the blast wave. Nevertheless, the shock Mach number value is obtained to be consistent repeatably for a given charging voltage and shock tube configuration. Thus, in current study, the blast wave will be characterised using the shock Mach number (measured experimentally) for the shock wave obtained for different experimental parameters.
In the current experiments, to study the interaction of the shock wave with a combusting fuel droplet, a n-dodecane droplet of ~2 mm diameter (d) is suspended in pendant mode at a distance of 365 mm from the copper wire using a quartz rod of 0.4 mm diameter. A heater coil attached to a linear solenoid is used for igniting the droplet. The experiments were performed in two different configurations: open field (figure 1a) and shock tube focusing (figure 1b). In the open-field configuration, the wire explosion occurs in the open, and a cylindrical blast wave propagates radially outward from the exploding wire (see figure 1a). In the latter case, a rectangular flow channel (shock tube of length, Lt) is firmly mounted onto the cover plate of the electrode chamber (using bolts) to direct and focus the blast wave along the shock tube (see figure 1b). Two different rectangular flow channels (made of a high impact strength material – polycarbonate) designed with the internal cross-sectional dimensions of 100 mm × 20 mm and 40 mm × 20 mm (each of length 330 mm) were used as shock tubes in the experiments to obtain different Ms (figure 1c). The shock tube is firmly fixed to the electrode chamber cover plate (using a nut–bolt arrangement) to minimise leakage of the compressed air. It is to be noted that, in both open-field and shock tube focusing configurations, the droplet location from the wire is maintained at the same distance.
In the open-field configuration (no shock tube), the cylindrical blast wave propagates radially outward away from the origin (copper wire), whereas, in the presence of a shock tube, the cylindrical blast wave transforms into a planar shock inside the rectangular column due to the geometry of the flow channel (Sembian et al. Reference Sembian, Liverts, Tillmark and Apazidis2016). Due to the experimental limitations of igniting the fuel droplet, the pendant fuel droplet had to be placed at a distance of 35 mm (Ld) from the shock tube exit (to allow for the movement of the ignition heater). Thus, when the planar blast wave from the wire explosion propagating along the rectangular channel exits the shock tube, it expands into the open ambient similar to an expanding cylindrical blast wave as it reaches the combusting droplet.
Different charging voltages for the capacitor from 4 to 10 kV were used in the current experiments for each of the three experimental configurations: open field and the configuration with shock tube of two different dimensions (see figure 1c). The synchronisation of the droplet ignition, blast wave interaction and simultaneous high-speed recording of flow visualisation is achieved using the BNC 745 T digital delay generator within nanosecond accuracy. The droplet ignition is achieved using an Arduino circuit that releases the heater coil mounted on a pull-type linear solenoid. After a specified time delay, the linear solenoid is actuated, and thus the heater coil is retracted away from the droplet, simultaneously sending an output trigger TTL signal. As soon as the BNC digital delay generator receives this input TTL signal, it triggers all the devices connected to it after the predetermined time delay intervals. Since the phenomena observed during the experiments, i.e. blast wave propagation, flame interaction and droplet break up, occur on microsecond time scales, the integration and synchronisation of different components are crucial for experimentation. Three different sets of experiments were performed using high-speed schlieren imaging, high-speed Mie-scattering imaging for flow visualisation, high-speed OH* chemiluminescence and high-speed shadowgraphy imaging (side view) for the droplet breakup.
A schlieren system is used for the flow visualisation using two spherical concave mirrors (1.5 m focal length) and a high-speed non-coherent pulse diode laser of 640 nm wavelength (Cavitar Cavilux smart UHS, 400 W power) along with a knife edge. The light beam emitted by the Cavilux laser source is transformed into a point light source using a variable round iris aperture (Holmarc SSID-25) which is placed at the focal length of the first concave mirror (M1). This forms a parallel light beam which is directed towards the test section for recording the shock–droplet flame interaction. Another spherical concave mirror (M2) is placed on the other side, which is used to focus the incoming parallel light beam from the test section into a point at its focal length. A knife edge is used to block the incoming converging light from M2 (placed at the focal length of the M2 mirror) to visualise the density gradient variation in the flow field during the shock interaction phenomena. This schlieren arrangement facilitates the visualisation of complex wave structures due to the blast wave and the flow features around the droplet flame in terms of density gradients (see figure 1a,b). A high-speed Photron SA5 camera is used for recording the schlieren imaging at the acquisition rate of 75 000 fps, 256 × 312 pixels per frame (at a pixel resolution of 0.2375 mm px−1) at which the pulse laser is synchronised. Schlieren imaging is used to obtain the Mach number (Ms) and other flow features.
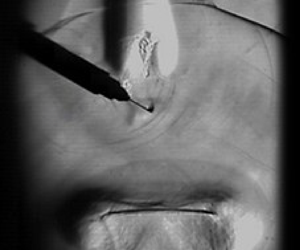
It is to be noted that the quartz rod is placed at a skewed angle to the focal plane of the schlieren camera, so that only the tip of the quartz rod (the droplet portion) is in the focal plane of the schlieren camera. The quartz rod is chosen over metal wire for holding the droplet in pendant mode to minimise the heat conduction effects as well as heterogeneous nucleation effects inside the droplet (which leads to internal boiling and bubble formation inside the droplet). The quartz rod diameter is also chosen to be as small as possible (dq ~ 0.4 mm) to minimise the effects of the quartz rod.
For high-speed shadowgraphy, a high-speed Cavilux pulse laser is used as the backlight by collimating the laser beam into a parallel light beam. A high-speed Photron SA5 camera synchronised with it is aligned in line with it for imaging. The droplet shape dynamics is recorded using high-speed shadowgraphy (at 75 000 fps, 256 × 312 pixels per frame at a pixel resolution of 0.05 mm px−1) to study its deformation and breakup phenomena.
High-speed flame imaging (OH* chemiluminescence) is also performed (see figure 1a) using a high-speed star Lavision SA5 Photron camera, coupling it with a high-speed intensifier (HS IRO, Lavision; IV Generation) alongside a Nikon Rayfact PF10445MF-UV lens and an OH* band pass filter (~310 nm). The focus of the current flame imaging experiments is limited to studying the flame response to the external flow imposed by the blast wave. The flame imaging is performed at 20 000 fps, 256 × 312 pixels per frame (at a pixel resolution of 0.081 mm px−1).
The Mie-scattering flow visualisation is performed by using a high-speed dual-pulsed Nd:YLF laser with a wavelength of 532 nm and pulse energy of 30 mJ per pulse as an illumination source to visualise the vortical structures behind the blast wave. The cylindrical output laser beam (5 mm diameter) is converted into a thin 1 mm thick sheet using sheet-making optics (see figure 1b). Diethyl hexa sebacate (1–3 μm, density ρ = 912 kg m−3) oil droplets are used as the seeding particles which are initially filled inside the shock tube which is closed at the open end with a lid. Just before triggering the system, the lid is removed from the shock tube exit, and then the system is triggered. A Lavision SA5 camera synchronised with the laser via a programmable tuning unit, operates in single-frame mode at an acquisition rate of 6000 fps with 1024 × 1024 pixel resolution. The optical axis of the camera is aligned orthogonally to the plane of the laser sheet and a 532 nm band-pass filter coupled with the camera lens is used for flow visualisation to capture the Mie-scattered light from seeder particles in the test section. The double-frame mode imaging is also performed at 3000 fps with a double pulse having 10 μs separation. The PIV Lab module in Matlab has been used for the post-processing to obtain the order of magnitude of the velocity scale of the induced flow vortical structures. Due to the experimental limitations, only the order of magnitude of the velocity of the vortical structures has been obtained, and they have not been used to reconstruct the velocity of the field. The Mie-scattering experiments were only performed for both the focused-shock configurations (with the shock tube). The schlieren imaging is also performed simultaneously along with the Mie-scattering flow visualisation and high-speed OH* chemiluminescence imaging (see figure 1b). Shadowgraphy imaging is performed simultaneously with flame imaging.
All of the experimental imaging (schlieren, shadowgraphy, flame imaging) was performed for all the three configurations: i.e. open field, 2 cm × 10 cm cross-section (c/s) channel and 2 cm × 4 cm c/s channel. Three experimental runs were conducted for each case in all the experimental set-ups. During the experiments, the charging voltage was varied from 5 to 10 kV and between 4 and 8 kV for open field and with shock tube configurations, respectively, to control the shock strength. The Mach number (Ms) is observed to vary with both the change in shock tube configuration as well as the charging voltages. The Mach number (Ms = Vs/c) is obtained using the blast wave propagation velocity (Vs), which is obtained by measuring the distance travelled by the cylindrical blast wave between two consecutive frames recorded at 75 000 fps along the centreline. The blast wave velocity is observed to decrease as it propagates downstream, which shows diminishing shock strength as the blast wave expands into the ambient after exiting the shock tube.
The bright flame tip, as well as the low-density hot gases at the flame, are visible in the schlieren imaging. Thus, the flame base and flame tip can be visually tracked using high-speed schlieren imaging. Additionally, schlieren experiments (75 000 fps) were also performed with a light source illuminating the test section only in three out of four subsequent frames (by using a logic gate circuit, shown in supplementary figure S7 available at https://doi.org/10.1017/jfm.2024.575). This allowed for better visualisation of the flame dimensions (especially the bright tip) alongside the schlieren imaging that shows the density gradient contrast due to the presence of hot gases at the flame. These data are corroborated using the simultaneous OH* chemiluminescence flame imaging (at 20 000 fps) to obtain the flame base and flame tip locations during its interaction with the shock. The flame images have been thresholded using the Otsu thresholding technique (in-built ImageJ). Otsu's thresholding algorithm computes a solitary intensity threshold (If) to partition all pixels within an image into two categories: foreground and background. This threshold (If) is established by minimising the intra-class intensity variance or, alternatively, by maximising inter-class variance. Thus, the flame boundary can be isolated to obtain the flame dimensions and flame base lift-off. Time series data of simultaneous OH* chemiluminescence have also been gathered using a Hamamatsu photomultiplier tube (H11526-110-NF) at a sampling rate of 75,000 Hz. Nonetheless, these data are beyond the scope of the present investigation and have not been utilised in the data analysis.
All the delays are preset based on repeatable testing (trial and error) to ensure reliable ignition of the droplet and the shock interaction is set to a specific delay after the ignition, which is ensured to be greater than the preheating time of the droplet. The heater delay for droplet ignition is set to around 500 ms using an Arduino circuit whereas the delay for shock generation post-droplet ignition (heater retraction) is set to a constant value of around 500 ms, which is long after the establishment of the quasi-steady flame (d 2-law regime), and this net delay is significantly higher than the preheating time of the droplet of around 200 ms, after which quasi-steady droplet combustion has been observed. The initial droplet size is maintained constant and the droplet size is experimentally (shadowgraphy) measured to be  $1.91 \pm 0.09\;\textrm{mm}$ for all the runs (cold flow condition) and once the droplet is ignited, the droplet size is maintained around a value of
 $1.35 \pm 0.095\;\textrm{mm}$ at the instant of shock interaction (after a fixed delay). These droplet conditions are maintained consistent in all the cases.
3. Results and discussions
3.1. Flow characterisation
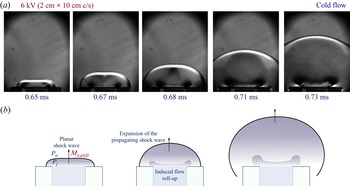
After the system is triggered, the blast wave generated travels away from the electrodes (origin) towards the combusting pendant droplet coaxially and reaches the flame location at t = ts. The blast wave is visualised through schlieren imaging as it passes by the droplet flame. The flame dynamics during the interaction is observed to vary drastically with the shock tube configuration (open field vs focused) and charging voltages. Also, Ms is observed to decay temporally as the blast wave propagates against the quiescent ambient medium. However, all cases are characterised by the value of the Mach number (Ms) near the location of the droplet that is measured along the centreline. The open-field blast wave showed the lowest Ms values as the blast wave expanded outwards in all directions from the point of the wire blast. However, a higher Ms is obtained in the case of blast focusing (with shock tube), where the blast wave is planar inside the shock tube flow channel (Sembian et al. Reference Sembian, Liverts, Tillmark and Apazidis2016) and starts to expand only after exiting the shock tube. Additionally, after the blast wave exits the shock tube and propagates downstream, an induced flow is observed behind the blast wave, which exits the shock tube and interacts with the combusting droplet after a time delay (see figure 2).
(a) Time series of the schlieren imaging of the blast wave propagation near the shock tube exit. (b) Schematic of the blast wave propagation near the shock tube exit.

Figure 2(a) shows the time series of the flow exiting the shock tube channel with an expanding blast wave. Figure 2(b) gives a schematic of the flow. As the planar propagating blast wave inside the shock tube exits into the quiescent ambient, the blast wave expands outward similar to a radially expanding blast wave, exhibiting significant curvature as it propagates. This radial expansion results in a continuous temporal decay of the shock strength and Ms as the blast wave propagates further. Since the blast wave is almost planar at that instant as it exits the shock tube, the shock Mach number at the exit (Ms ,e) is measured and normal shock relations can be used to evaluate the characteristics of the jet upstream of the blast wave. Table 1 gives the details of the initial upstream flow that is exiting the shock tube. On the other hand, in the case of the open-field configuration, a cylindrical blast wave propagates radially outward away from the copper wire having Mach numbers (Ms) of 1.03, 1.05, 1.055, 1.065 for the charging voltages of 5, 7, 7.8 and 10 kV, respectively. Thus, the flow imposed by the blast wave in either of the configurations has to be characterised to understand the interaction with the droplet flame.
Pressure ratio, jet velocity and Reynolds number upstream of the blast wave corresponding to different focused cases having different M s at the droplet.

Using a similar methodology as Bach & Lee (Reference Bach and Lee1970) (which is valid for the Ms range of current experiments, i.e. 1.02 < Ms < 1.6), a power-law density profile can be assumed behind the blast wave, and the velocity profile can be obtained from the mass conservation differential equation.
Initially, we define the non-dimensional parameters for velocity and density as follows:
 \begin{gather}\phi (\xi ,\eta ) = \frac{{u(r,t)}}{{{{\dot{R}}_s}(t)}},\end{gather}
 \begin{gather}\psi (\xi ,\eta ) = \frac{{\rho (r,t)}}{{{\rho _o}}},\end{gather}
where,  $\theta (\eta ) = {R_s}{\ddot{R}_s}/{\dot{R}_s}$,
 $\; \xi = r/{R_s}(t)$,
 $\eta = c_o^2/\dot{R}_s^2 = 1/M_s^2$,
 $y(\eta ) = {({R_s}/{R_o})^{j + 1}}$.
The conservation of mass for unsteady one-dimensional adiabatic motion of a perfect gas behind the expanding blast wave is considered
 \begin{equation}(\phi - \xi )\frac{{\partial \psi }}{{\partial \xi }} + \psi \frac{{\partial \phi }}{{\partial \xi }} + j\phi \frac{\psi }{\xi } = 2\theta \eta \partial \psi /\partial \eta .\end{equation}
Here, Ro is the characteristic explosion length, Rs is the instantaneous shock radius, u is the velocity field, ρ is the density field and co is the speed of sound. The boundary conditions at the shock front ξ = 1 are obtained from the standard normal shock relationship given by
 \begin{gather}\phi (1,\eta ) = \frac{{2(1 - \eta )}}{{\gamma + 1}},\end{gather}
 \begin{gather}\psi (1,\eta ) = \frac{{\gamma + 1}}{{\gamma - 1 + 2\eta }}.\end{gather}
Thus, following Bach & Lee's (Reference Bach and Lee1970) formulation, the density profile can be assumed as follows:
 \begin{equation}\psi (\xi ,\eta ) = \psi (1,\eta ){\xi ^{q(\eta )}}.\end{equation}
The value of the exponent ‘q’ can be obtained using the mass integral obtained from the conservation of the mass enclosed by the blast wave at a given instant
 \begin{equation}\int_0^1 {\psi {\xi ^j}\,\textrm{d}\xi } = \frac{1}{{j + 1}},\end{equation}
where the values j = 0, 1, 2 are for planar, cylindrical and spherical blast waves, respectively. Thus, the exponent of the density power law is obtained to be
 \begin{equation}q(\eta ) = (j + 1)[\psi (1,\eta ) - 1].\end{equation}
The density profile can be obtained from (3.5), (3.6) and (3.8) at any given instant for a specific Mach number (Ms). Thus, the mass conservation equation (3.3) can be rewritten using the density profile as follows:
 \begin{equation}\frac{{\partial \phi }}{{\partial \xi }} + (q + j)\left( {\frac{\phi }{\xi }} \right) = q + \frac{{2\theta \eta }}{{\psi (1,\eta )}}[1 + (j + 1)\psi (1,\eta )\,\textrm{ln}\,\xi )]\frac{{\partial \psi (1,\eta )}}{{\partial \eta }}.\end{equation}
Substituting the boundary condition at the origin as  $\phi (0,\eta ) = 0$, the velocity profile is obtained as
 \begin{equation}\phi = \phi (1,\eta )\xi (1 - \varTheta \,\ln \,\xi ),\end{equation}
where
 \begin{equation}\varTheta = \frac{{ - 2\theta \eta }}{{\phi (1,\eta )\psi (1,\eta )}}\frac{{\partial \psi (1,\eta )}}{{\partial \eta }}.\end{equation}
The  $\theta $ vs
 $\eta $ relation can be obtained by a similar methodology as shown by Bach & Lee (Reference Bach and Lee1970), and then (3.10) can be used to obtain the temporally decaying velocity profile at a given location ‘r’ behind the blast wave for a given Ms.
The shock trajectory can be experimentally obtained by tracking the shock location along the centreline using high-speed schlieren imaging. In the case of the open-field blast wave, the shock is observed to propagate away from the wire location cylindrically outward and this transitions into an ellipsoidal shape later (Chiu, Lee & Knystautas Reference Chiu, Lee and Knystautas1977). Hence, the wire location can be considered as the origin (r = 0) for the open-field blast wave and it can be considered as a cylindrical blast wave at the droplet location as within the time scale of ~O(10−1) ms, the curvature effects at the edges during the transition to ellipsoidal shape would not reach the centreline cylindrical blast flow. Hence, the cylindrical assumption can be used for the open-field case. The spherical blast wave assumption can also be considered at the droplet location with respect to copper wire dimensions  $({L_t} + {L_d} \gg w)$. Nevertheless, neither cylindrical nor spherical formulations can fully capture the three-dimensional effects of the ellipsoidal shape and the transition from cylindrical shape. On the other hand, when the shock tube focusing is used, the blast wave is focused inside the shock tube along its length, which gets modulated as a planar blast wave as it propagates inside the shock tube (see figure 3a). However, when the blast wave exits the tube, it expands radially outward at the tube opening into the ambient atmosphere, similar to a blast wave. Experimentally, it is evident that the shape of the blast wave transitions from planar to cylindrical as it exits the rectangular shock tube opening. This is evident from the temporal variation of the radius of curvature (Rs) of the blast wave, which is observed to approach the instantaneous centreline distance (x) from the shock tube exit as the blast wave expands outward (see figure 3l). This implies that the blast wave tends to expand outward cylindrically while approximately maintaining the centre of curvature at the shock tube exit location. That means the planar blast wave inside the shock tube transitions into a cylindrical blast wave with the shock tube exit location as its centre of curvature (origin). Hence, for simplicity, this expanding cylindrical blast wave can be assumed to be similar to a blast wave that has originated from the shock tube exit location as its virtual origin (r = 0) and is expanding radially outward into the ambient atmosphere, as shown in figure 3(a). Thus, this expanding blast wave is assumed to be equivalent to the hypothetical cylindrical blast wave (j = 1) originating from the shock tube opening, and the instant when the blast wave exits the shock tube opening is considered to be the reference time (
 $t_{v} = 0$, virtual time), as shown in figure 3(a). As shown in figure 3(a), the length of the shock tube is Lt, and the droplet is placed at a distance of Ld from the shock tube opening. Since the droplet position is maintained to be the same for both open and focused cases, the location of the droplet in the open-field case is r = Lt + Ld (with r = 0 at the copper wire location).
(a) Schematic of the blast wave propagation in open-field and focused configurations depicting the dimensions, droplet location and the cylindrical blast wave virtual origin (r = 0), reference time ( ${t_v} = 0$) for both cases. (b,d) Variation of the Mach number along its trajectory (radial distance from origin, r = 0) for focused and open-field blast wave cases, respectively. Here, ‘kV’ refers to the charging voltage for blast wave generation and ‘B’, ‘S’, ‘Open’ denote ‘big channel (2 cm × 10 cm c/s)’, ‘small channel (2 cm × 4 cm c/s)’ and ‘open-field’ configurations, respectively. (c,e) Temporal variation of the Mach number for focused and open-field blast wave cases, respectively. ( f–i) Theoretical and experimental plots of Mach number (Ms) vs virtual time (
 ${t_v}$) of the blast waves generated for 4 kV big channel, 6 kV, 8 kV small channel and 5 kV, 10 kV open-field configuration, respectively. (j) Log–log plot of shock radius vs time. (k) Temporal variation of the Mach number (Ms) for different cases plotted against time, t (in ms) with t = 0 at the time of the explosion. (l) Temporal variation of the deviation of instantaneous axial distance from shock tube exit (x) and instantaneous radius of curvature (Rs) of the blast wave that is exiting the shock tube. The error bars represent the maximum error arising due to the shock location measurement variation due to pixel resolution.

Figure 3(b,d) shows the variation of Mach number along the shock trajectory location (mm) measured experimentally as the shock propagates for focused (i.e. big channel (B) and small channel (S)) and open-field (Open) cases, respectively, designated based on different charging voltages (kV) and shock tube configuration. Higher charging voltages (kV) and smaller shock tube dimensions result in higher Mach numbers (Ms), and the open-field cases exhibited the lowest Mach numbers (Ms < 1.08) for the same kilovolts (kV). The droplet location Ld (in case of focused) and Lt + Ld (for open-field configuration) are indicated in figure 3(b,d) with the help of a vertical orange dotted line. This implies the droplet and flame starts to experience the imposed flow of the blast wave only to the right side of this line. Figure 3(c,e) shows the temporal variation of the Mach number (Ms) (measured experimentally) plotted against virtual time ( ${t_v}$, ms). The theoretical blast wave trajectory can be obtained using the following expression (Bach & Lee Reference Bach and Lee1970):
 \begin{equation}\frac{{{c_o}t}}{{{R_o}}} ={-} \frac{1}{2}\int_0^\eta {\frac{{{y^{1/(j + 1)}}\,\textrm{d}\eta }}{{\theta {\eta ^{1/2}}}}} .\end{equation}
Where  $\theta (\eta )$ is the shock decay coefficient and
 $y(\eta ) = {({R_s}/{R_o})^{j + 1}}$ is the dimensionless instantaneous shock radius.
The parameters  $\theta (\eta )$ and
 $y(\eta )$ were obtained by numerically solving the pair of first-order differential equations that are given by Bach & Lee (Reference Bach and Lee1970), which are obtained by substituting the profiles of different properties into the energy integral. The value of the characteristic explosion length (R o) is dependent on the initial energy input to the blast wave explosion. However, in the current experiments, the assumption of mass and energy conservation of Bach & Lee (Reference Bach and Lee1970) is not fully valid due to the entrainment effects that start to occur during the later stages of the shock propagation (>1 ms, from the explosion). Hence, the exact value of the equivalent explosion energy cannot be obtained for the current experiments. This limitation can be circumvented by using the shock arrival time at a specific location (r). Using the experimental value of the Mach number (Ms) at a specific location as a reference, the theoretical value of Ms is iteratively evaluated at that location using different values of Ro, and the value of Ro is obtained corresponding to a given experimental run. Thus, following Bach & Lee (Reference Bach and Lee1970) and Chandra et al. (Reference Chandra, Sharma, Basu and Kumar2023), the theoretical shock arrival time (tarr ,Th) is evaluated by substituting the value of Ro in (3.12), which is in agreement with the experimentally obtained shock arrival time (tarr ,exp) at the droplet location (see supplementary figure S1).
Thus, the shock trajectories, i.e. Rs(t) and Mach number (Ms) evolution, have been evaluated theoretically for the corresponding values of Ro using j = 1 for an open-field blast wave (cylindrical assumption at the droplet location). This has been plotted (solid lines) in figure 3(i) for the open-field blast wave cases (j = 1), with origin (r = 0) at the location of copper wire and time t = 0 at the time of the explosion. The experimentally measured shock trajectory evolution has also been plotted and is found to be in good agreement with the theory in the initial stages (~0–1 ms after the explosion). Similarly, the theoretical shock trajectories have also been obtained for the cylindrical blast waves (j = 1) exiting the shock tube (focused cases), taking the reference time of the hypothetical explosion ( ${t_v} = 0$) at the shock tube exit, which is assumed to create a similar blast wave that expands cylindrically outward, with the virtual origin at the shock tube exit (r = 0). Similarly, the theoretical shock trajectory of the planar blast wave (j = 0) travelling inside the shock tube from the time of explosion (t = 0) of the copper wire has been obtained using the arrival time of the planar shock at the shock tube opening. The experimentally measured shock trajectories (points), and the theoretically obtained shock trajectories (solid lines) are plotted in figure 3( f–h) for different focused cases against the virtual time
 ${t_v},\; in\;ms$ (where
 ${t_v} = 0$ is the instant the shock location is at the shock tube exit).
The experimental shock trajectories are in good agreement with the theoretical estimates (both planar and cylindrical regimes), showing the coefficient of determination obtained to be  ${R^2}\sim 0.88{-}0.97$ for the deviation of the theoretical shock trajectory and experimental measurement for all cases except 4kV_B, see figure 3( f–h). The deviation in the 4kV_B case can be attributed to the experimental limitation of lack of contrast in the schlieren images (absence of distinct shock boundary) resulting in higher error in shock location measurement for the 4kV_B case. However, the normalised root mean squared error of the data points of 4kV_B from theoretical prediction is found to be less than 1.5 %, which is within the acceptable range. From the plots, it can be clearly observed that the experimental shock trajectory initially follows the theoretical estimate of the planar shock trajectory (from the time of explosion) and then gradually shifts and deviates to follow the cylindrical shock trajectory estimate (with the shock tube exit as the virtual origin). This establishes the previously hypothesised planar to cylindrical (centre at shock tube exit) transition of the propagating blast wave after exiting the shock tube opening.
The temporal variation of the shock location is tracked using high-speed schlieren imaging and is plotted in figure 3(k) for all the cases. Figure 3(j) shows that all the plots merge into one single straight line in the log–log plot of shock radius (Rs) vs time ( ${t_v}$) and the slope of the line is found to be near unity. It is shown that the scaling for the strong blast wave propagation is
 ${R_s}\sim t_v^{2/5}$ (exponent ~2/5) and for the weak acoustic limit, the weak blast wave propagation scaling is linear
 ${R_s}\sim t$ with (exponent ~1) (Wei & Hargather Reference Wei and Hargather2021; Díaz & Rigby Reference Díaz and Rigby2022). This suggests that all the blast waves observed in the current experiments are near the weak blast wave acoustic limit (exponent near unity). However, the slopes of the individual cases (in the log–log plot) are found to vary between 0.89 and 0.99. This shows that the current experiment is in the transition regime between the strong blast wave and acoustic limit. The plots in figure 3(b–i) show the minimal variation in Ms for open-field cases, suggesting that they are near the acoustic limit. In contrast, the focused blast wave cases showed significant temporal variation of Ms.
3.2. Interaction with a combusting droplet
As mentioned before, the droplet is placed coaxially at a distance of  ${L_t}\; + \; {L_d}$ from the copper wire, i.e.
 ${L_d}$ from shock tube opening in both the open-field and focused configurations. After the pendant droplet is ignited and shock set-up is triggered, the blast wave expands radially outward and interacts with the droplet flame in the open-field case, whereas in the focused case, the blast is directed along the shock tube, and interacts with the droplet flame after it exits the shock tube. Figures 4(a,b) and 4(c–f) show the flame interaction with the blast wave generated in the open-field and focused configurations for different charging voltages. Since Ms varies temporally, the instantaneous value of Ms when the blast wave passes the droplet location is considered as the reference value to characterise different cases and is mentioned in figure 4, corresponding to each case. The subsequent discussion will categorise the different configurations of the shock tube at varying charging voltages as follows: ‘B’, ‘S’ and ‘Open’ for big, small sections and open-field configurations, respectively, accompanied by their corresponding kilovolt (kV) values. For instance, the notation ‘5kV_Open’ denotes a charging voltage of 5 kV in an open-field configuration.
Time series of the schlieren imaging depicting the overall interaction of the droplet flame with the shock flow for open-field configuration with charging voltage (a) 7 kV, (b) 10 kV; for bigger shock tube channel (2 cm × 10 cm c/s) with charging voltages (c) 4 kV, (d) 7 kV; and for the smaller shock tube channel (2 cm × 4 cm c/s) with charging voltages (e) 6 kV, ( f) 8 kV. Note: the schlieren snapshots taken at 7000 fps are chosen to be displayed to better represent the flame dynamics, extinction (due to brighter flame) for cases (b) and (c). Rest of the snapshots are obtained at 75 000 fps.

Along with the blast wave visualisation and density gradient contrast corresponding to the plume of hot gases around the flame, the bright flame tip is also visible in the schlieren images. Figure 4(a,b) depicts the time series of the schlieren images, showing the blast wave propagation and flame response for the open-field configuration at two charging voltages. The Mach numbers (Ms) for the open-field configuration are less than 1.1 and the flame response is observed to occur over a longer time scale of order  ${\sim} \; O({10^0} {-} {10^1})\;\textrm{ms}$. The flame is observed to lift-off in both the cases; however, as shown in figure 4(b), total extinction occurs at higher charging voltage, i.e. 10 kV, and partial extinction followed by reignition is observed in the case of 7 kV and lower.
The time series presented in figure 4(c–f) are the high-speed schlieren snapshots during the interaction of the droplet flame with the focused blast wave (using the shock tube). Figures 4(c,d) and 4(e, f) correspond to the focused cases using the shock tube with bigger (2 cm × 10 cm c/s) and smaller (2 cm × 4 cm c/s) cross-sectional dimensions, respectively. At the same charging voltage, higher Ms is obtained for the smaller section compared with the larger section. Except for the 4kV_B case, the Mach numbers obtained for all the focused cases are greater than 1.1. Furthermore, for similar Ms values, the flame response behaviour for the focused cases is consistent with that of the open-field configuration. This can be observed in the 4kV_B (big section) focused case with Ms < 1.1, where the flame responds over a longer time scales of order  ${\sim} \; O({10^{ - 1}} {-} {10^1})\;\textrm{ms}$ similar to the open-field configuration, see figure 4(c). However, the flame response is within the period of the shock decay (
 $t\sim 0{-}1\;\textrm{ms}$, time from explosion) for higher Ms (> 1.1). In all the focused cases figure 4(c–f), a compressible vortex ring (CVR) is observed to form and interact with the droplet and flame after some delay. This interaction is observed to result in droplet breakup, which will be discussed in the later sections.
From the blast wave literature (Sedov Reference Sedov1957; Goldstine & von Neuman Reference Goldstine and von Neumann1963; Bach & Lee Reference Bach and Lee1970), it is known that the velocity profile at a given location is imposed by a propagating blast wave decaying temporally. The decay of the velocity profile behind the blast wave occurs until a time scale of  $\mathrm{\sim }1\;\textrm{ms}$ (from the time of explosion), after which the velocity (
 ${v_s}$) decays down to zero and even to negative values (of lower magnitude). Interestingly, for the open-field configuration (see figure 4a,b and Movie 1, Movie 2), it can be observed that the time of the total flame interaction occurs in the range
 $\mathrm{\sim }O({10^0} {-} {10^1})\;\textrm{ms}$, which is one order slower when compared with the shock decay time period of
 $t\sim (0.6{-}1)\;\textrm{ms}$ (from the time of explosion). During the time period of
 $t\sim 0.6{-}1\;\textrm{ms}$ corresponding to the decaying velocity profile imposed by the blast wave, the droplet flame is initially lifted off away from the droplet surface and it subsequently recedes towards the droplet. This lift-off is the consequence of the interaction of the blast wave profile with the droplet flame and, subsequently, the flame starts to recede and reattach to the droplet as the decaying velocity profile (
 ${v_s}$) decays and approaches zero near the droplet. However, even beyond this time period of influence of the decay profile,
 ${v_s}$ (
 $t > 1\;\textrm{ms}$), see figure 4(a,b), where the velocity should have fully decayed to near zero, the flame is observed to exhibit a gradual lift off, albeit at a slower time scales of
 $\mathrm{\sim }O({10^0} {-} {10^2})\;\textrm{ms}$. This can be attributed to a slower induced flow velocity (
 $v_{ind}$) at the time scales of
 $\mathrm{\sim }O({10^0} {-} {10^2})\;\textrm{ms}$, which may occur as a result of the entrainment effects at the edge of the expanding blast wave and thus deviate from the local velocity variation obtained from the theoretical formulation in § 3.1 (mass conservation is violated). The static pressure profile behind the blast wave (P) also decays temporally and decays below the ambient pressure locally at t = td (see supplementary figure S2). These negative pressures (i.e. P < Patm) behind the blast wave can be attributed to the occurrence of air entrainment effects. Thus, for the time t < td, the decaying profile of the blast wave is dominant and after t > td, the magnitude of the local velocity (
 ${v_s}$) becomes small and negative pressures occur at the droplet location, drawing the bulk-induced flow (
 $v_{ind}$) near the droplet. It is to be noted that the pressure is not experimentally measured but the pressure variation obtained using the theoretical modelling is used to infer the pressure variation.
However, the effects of  $v_{ind}$ are only experienced at the droplet location after some delay beyond a certain time period (after t = td), depending on the velocity scale of the induced flow (
 $v_{ind}$). Based on the response time scales of the slower flame response for t > td, it can be concluded that the velocity scale of the induced flow (
 $v_{ind}$) is significantly slower compared with the shock flow. Thus, the induced flow will affect the droplet flame only after it travels from the blast wave edge and reaches the droplet location. Thus, it can be concluded that the velocity decay profile (
 ${v_s}$) behind the blast wave is only valid during the initial stages of the interaction before the induced flow (
 $v_{ind}$) reaches the droplet location. This induced flow (
 $v_{ind}$) is responsible for the slower flame lift-off beyond
 $t > 1\;\textrm{ms}$, as shown in figure 4(a,b). In all cases, under the influence of the imposed flow, the fuel vapour plume itself is swept downstream (see figure 4) in response to either the velocity profile at the droplet due to the blast wave velocity profile (
 ${v_s}$) or the induced velocity scale (
 $v_{ind}$). This advection of the fuel vapour plume corresponds to the aforementioned flame lift-off phenomenon.
The entrainment effects (near the shock tube mounting at the cover plate) are also present in the case of shock tube focusing, and along with this, the induced flow ( $v_{ind}$) encounters the ambient atmosphere as it exits the shock tube. This results in the curling of the induced flow (
 $v_{ind}$), forming vortical structures, as shown in figure 4(c–f) and Movies 3–6. These vortical structures show distinct contrast in the schlieren images, making them clearly visible (dark patches). This can be attributed to the compressible nature of these vortical structures. Thus, these vortical structures will be referred to as CVRs hereafter. The velocity scale (
 $v_{ind}$) of the CVR is also relatively slower compared with the shock flow, which is evident from the CVR arrival time at the droplet. The time from the explosion is normalised using the pressure decay time below ambient at the droplet (t = td) given by
 $\tau \; = \; t/{t_d}$. Thus, the blast wave reaches and interacts with the droplet flame at
 $\tau = {\tau _s}$ and the static pressure at the droplet decays below ambient at
 $\tau = 1$.
Figure 5 shows the overall schematic of the different phenomena simultaneously occurring during the interaction of the blast wave and the droplet flame. As shown at the top of figure 5, the entire process of the interaction with the droplet flame occurs in two phases. The first stage is the blast wave–flame interaction corresponding to the time scale of  ${\tau _s} < \tau < 1$ (approximately
 $t\sim 0.6{-}1\;\textrm{ms}$ after explosion). The second stage (
 $\tau > 1$) comprises the induced flow–flame interaction (
 $t\sim O({10^0} {-} {10^1})\;\textrm{ms}$ after explosion) and the simultaneous induced flow CVR–droplet interaction (
 $t\sim O({10^0})\;\textrm{ms}$ after explosion). During the blast wave–flame interaction, the droplet flame responds directly to the propagating blast wave; thus, the droplet flame initially (
 $\tau < 1$) interacts with the decaying velocity profile (
 ${v_s}$) that is imposed by the blast wave (Goldstine & von Neuman Reference Goldstine and von Neumann1963; Bach & Lee Reference Bach and Lee1970). Later, for
 $\tau > 1$, when the induced flow (
 $v_{ind}$) behind the blast wave reaches the test section, both the droplet as well as the droplet flame interact with the induced flow simultaneously. Since the blast wave effects have fully decayed beyond
 $\tau > 1$, the flame response is only due to the induced flow (
 $v_{ind}$). The order of magnitude of the induced flow (
 $v_{ind}$) can be reasonably assumed to be of the same order as that of the lift-off speed of the flame base (
 $v_{b,lft}$) during this second stage of interaction.
The schematic of temporal variation of the velocity during different stages of the interaction (top) plotted against normalised time,  $\tau = t/{t_d}$. Schematic of the simultaneous response of the flame and droplet to the blast wave profile (
 ${v_s}$) and induced flow (
 $v_{ind}$) at different stages of interaction. The coloured subfigures are the instantaneous snapshots obtained from high-speed flame imaging.

It is to be noted that, even though the induced flow–flame interaction regime and CVR–droplet interaction regimes are shown side by side separately in figure 5, these two interactions occur around a similar time scale ( $t\sim O({10^0} {-} {10^1})\;\textrm{ms}$ after explosion). The green region in the plot shown at figure 5 (top) shows the trend of the temporal variation of velocity (
 ${v_s}$) at a given location as the blast wave propagates. When the blast wave propagates past the droplet, locally, an instantaneous velocity peak (
 ${v_{peak}}$) is experienced due to the discontinuity imposed by the blast wave. Then, the local velocity due to the blast wave profile (
 ${v_s}$) decays as the blast wave propagates further downstream (Bach & Lee Reference Bach and Lee1970, Goldstine & von Neuman Reference Goldstine and von Neumann1955). However, an induced flow is entrained behind the blast wave, which reaches the droplet location after some delay during the later stages of the interaction, i.e.
 $\tau > 1$ (i.e.
 $t\sim O({10^0} {-} {10^1})\;\textrm{ms}$ after the explosion). This induced flow (
 $v_{ind}$) is depicted in the indicative plot of the velocity variation in figure 5 (top). The green, yellow and blue backgrounds in the plot represent the shock–flame interaction, induced flow–flame interaction (in the absence of shock tube) and droplet–induced flow CVR interaction (with shock tube), respectively. The approximate time scales corresponding to each of the interactions are mentioned in the figure. The schematic of the simultaneous response of both the flame and droplet during the different stages of interaction is depicted in figure 5.
Broadly the response of the flame and droplet to the imposed flow is divided into two regimes: low shock strengths (Ms < 1.1) and high shock strengths (Ms > 1.1), as shown in figure 5. Among the different experimental cases, all the open-field cases and the focused case: 4kV_B (charging voltage: 4 kV, big section, 2 cm × 10 cm c/s), fall under the Ms < 1.1 behaviour. The rest of the higher shock strengths in the focused case follow the high shock strength (Ms > 1.1) behaviour. In the low shock strength regime (Ms < 1.1), the flame is observed to be sustained beyond the initial blast wave–flame interaction stage ( $\tau > 1$, figure 5, top). Whereas, for the Ms > 1.1 regime, the flame is observed to fully extinguish during the interaction with the decaying velocity profile (
 ${v_s}$) imposed by the blast wave (
 $\tau < 1$), i.e. green zone (figure 5, top). This is depicted under the flame–shock interaction regime in figure 5. Within the Ms < 1.1 regime, the flame behaviour can be further divided based on whether flame extinction occurs or not.
For Ms < 1.04, during the initial blast wave profile ( ${v_s}$) interaction,
 $\tau < 1$ (green zone, figure 5), the flame lift-off is observed to be minimal (no forward extinction). However, for Ms > 1.04, the flame exhibits local extinction due to the critical strain rate at the forward stagnation point as a result of the externally imposed flow during this interaction stage (Pandey et al. Reference Pandey, Basu, Krishan and Vadlamudi2021). This is hereby referred to as ‘forward extinction’. In both the cases for the Ms < 1.1 regime, the flame is not extinguished during this initial stage. Subsequently, the flame starts to recede towards the droplet as soon as the velocity profile (
 ${v_s}$) at the flame decays and approaches zero around
 $t\sim 1\;\textrm{ms}$ (after the explosion), as depicted at the junction of the green and yellow regions in the plot shown in figure 4 (top). Subsequently, in the time period of
 $\tau > 1$ (yellow zone, figure 5), the slower induced flow (
 $v_{ind}$) reaches and interacts with the droplet flame, resulting in flame forward extinction and lift-off in the Ms < 1.1 regime. In the case of Ms < 1.04, the induced flow velocity (
 $v_{ind}$) results in minimal lift-off (hlft) of the flame base accompanied by flame tip stretching and shedding, followed by reattachment of the flame onto the droplet surface and enveloping around the time scale of
 $\mathrm{\sim }O({10^2})\;\textrm{ms}$ (depicted with brown background in figure 5). For Ms > 1.04, the flame tip shedding or stretching is not observed and the flame base undergoes slower but continuous lift-off, achieving higher lift-off (hlft > 2d) compared with the Ms < 1.04 regime. Furthermore, for 1.04 < Ms < 1.06, the continuous flame lift-off leads to partial extinction followed by subsequent reignition of the droplet around
 $t\sim O({10^2})\;\textrm{ms}$. However, for Ms > 1.06, full extinction without reignition is observed. All these subregimes are portrayed in the global schematic shown in figure 5. Consistency in flame behaviour based on Mach number (Ms) is observed, where the focused case 4kV_B (Ms = 1.07) exhibited full extinction similar to 10kV_Open (Ms = 1.065) as Ms in both cases falls under the same subregime of Ms > 1.06. Simultaneously, the droplet also interacts with the induced flow (
 $v_{ind}$), undergoing minimal deformation for the open configuration but does not exhibit any breakup due to low values of
 $v_{ind}$ (We ~ 0.05–5).
For Ms > 1.1, due to higher Ms, the velocity scale ( ${v_s}$) associated with the decay profile behind the blast wave is higher. Thus, the flame lift-off is more dominant in this regime, occurring at faster time scales of similar order to that of the shock decay time period (
 $t\sim 0.6{-}1\;\textrm{ms}$) for
 $\tau < 1$. Thus, the flame undergoes rapid continuous lift-off in response to
 ${v_s}$ imposed by the blast wave, ultimately leading to imminent extinction during the initial interaction stage, i.e.
 $\tau < 1$ (green zone, figure 5). After extinction, the hot gases are swept downstream and are observed to curl into a vortex ring (depicted in the droplet–flow interaction of figure 5) and advect downstream due to the vorticity generation effect of the blast wave interaction due to RM instability (Picone & Boris Reference Picone and Boris1988; Ju et al. Reference Ju, Shimano and Inoue1998), as shown in figure 4(c) (rightmost image). Experimentally, it has been observed that the flame fully extinguishes before the induced flow CVR interacts with the droplet flame. Simultaneously, while the flame is interacting with the decaying profile (
 ${v_s}$) of the blast wave (
 $\tau < 1$), the droplet also interacts with the
 ${v_s}$ profile and subsequently with the induced flow CVR (
 $v_{ind}$) while undergoing either shear-induced stripping or Rayleigh–Taylor (RT) piercing. In all cases, in response to the decaying velocity of the blast wave (
 ${v_s}$) for
 $\tau < 1$, the droplet exhibits continuous temporal deformation (increase in major axis length that is perpendicular to the flow direction). Additionally, perturbations on the windward surface of the droplet due to KH instability are observed for the Ms > 1.3 subregime due to the decaying velocity (
 ${v_s}$). Later for
 $\tau > 1$, after some delay when the induced flow CVR (
 $v_{ind}$) reaches the droplet and interacts with it, shear-induced stripping is observed due to further growth of KH waves. The induced flow CVR (
 $v_{ind}$) is observed to reach and interact with the droplet quicker as Ms is increased. For the Ms > 1.3 subregime, after the CVR (
 ${v_s}$) interacts with the droplet (WeCVR > 100), the KH waves grow and travel towards the equatorial plane, resulting in a sheet formation and a subsequent sheet breakup following the shear-stripping mechanism. However, in the case of the Ms < 1.3 subregime, the KH waves are not formed due to lower velocity scales (
 $v_{ind}$), i.e. 0 < WeCVR < 90; however, the droplet deformation continues, leading to RT piercing followed by bag breakup. This RT piercing breakup mode is experimentally observed to be approximately one order slower compared with the shear-induced stripping mode. It is to be noted that, for the case of 4 kV charging with a big section (Ms ~ 1.07), even though the flame follows a similar trend as shown in figure 5 for the Ms < 1.1 regime, due to the presence of the shock tube and focusing of the induced flow (
 $v_{ind}$) in the form of a CVR, the CVR interaction with the droplet results in RT piercing breakup based on the Weber number of the CVR incident on the droplet.
3.2.1. Shock–flame interaction ( ${\tau _s} < \tau < 1$)

This section will primarily discuss the interaction of the droplet flame for  $\tau < 1$ (faster time scales) with the decay velocity profile (
 ${v_s}$) imposed by the blast wave (green zone, figure 5). For all the cases, the droplet flame is observed to immediately start to respond to the propagating blast wave when it reaches the droplet location at
 $\tau = {\tau _s}$ (see figure 4). Figure 6 shows the temporal variation of the flame dimensions (in mm) during the interaction. The green background represents the first stage of interaction between the blast wave and the droplet flame. The orange data points represent the distance between the flame tip and the droplet, whereas the blue data points represent the distance between the flame base and the droplet (flame stand-off distance). This implies that the flame is vertically present in between the orange and blue data points, with droplet location on the x-axis. The red dotted line depicts the approximate instantaneous location of the propagating blast wave. In figure 6, the shock strength increases from left to right due to the increase in charging voltage for the same shock tube configuration. Figure 6(a–f) shows the temporal flame dimension variation for the open field, big channel shock tube (2 cm × 10 cm c/s) and small channel shock tube (2 cm × 4 cm c/s), respectively.
Temporal variation of the flame dimensions, i.e. flame tip (orange) and base (blue) distances (mm) from the droplet surface during the initial interaction between blast velocity profile,  ${v_s}$ (green region) and later interaction between the induced flow,
 $v_{ind}$ (yellow region) plotted for (a,b) open field, (c,d) bigger channel (2 cm × 10 cm c/s) and (e, f) smaller channel (2 cm × 4 cm c/s) at different charging voltages. The flame dimensions are plotted against normalised time (
 $\tau $). The simultaneous shock and vortex locations are shown in the plots with red and green dotted lines, respectively, and the corresponding values Ms are mentioned for each case.

During the first stage of shock–flame interaction ( ${\tau _s} < \tau < 1$), in the case of the open-field blast wave with Ms (< 1.04) (figure 6a), the flame lift-off from the droplet surface remains minimal, exhibiting flame tip stretching in the form of a quick jittery motion. As the blast wave passes by, the flame stretching is observed in the range
 ${\tau _s} < \tau < 1$ (almost immediately as the shock propagates) in response to the decaying velocity profile (
 ${v_s}$) imposed by the blast wave. No significant delay is observed between the flame response and the instant of shock interaction. Subsequently, the flame tip recedes towards the droplet (flame length reduces) as the velocity profile (
 ${v_s}$) decays at the flame, approaching near zero towards the end of the first stage interaction (green zone, figure 6). This is evident from the plot in figure 6(a), which shows a local peak in the flame tip distance (orange) in the green region (shock–flame interaction phase) corresponding to the flame tip stretching. Later, the drop in flame tip distance (orange) shows the receding of the flame tip distance after the shock passes. The plot also shows no significant flame lift-off (forward extinction) for this case (blue) in the green region. However, in case of a higher Mach number (Ms ~ 1.065) (figure 6a), the flame undergoes local extinction at the forward stagnation point due to critical strain rate as a result of the externally imposed flow, followed by significant flame lift-off (hlft > 3d). Similar to the low Ms case, the flame tip exhibits stretching followed by receding of the flame base and tip towards the droplet in response to the temporally decaying
 ${v_s}$ at the flame location. This flame tip stretching and receding is reflected in the plot in figure 6(b) in the form of a momentary spike in flame tip distance (orange) that is accompanied by the drastic increase in flame base lift-off (blue). The receding of the flame tip and base distance corresponds to the flame trying to reattach to the droplet after the blast velocity profile (
 ${v_s}$) decays significantly, approaching zero around
 $\tau \sim 1$ (at the end of the green zone).
As mentioned before, higher confinement (focusing) of the blast wave results in higher Ms. The green zones in figure 6(c–f) shows the plots of the temporal variation of the flame dimensions during  ${\tau _s} < \tau < 1$ (shock–flame interaction phase) for bigger and smaller shock tube channels, respectively. The subfigures in figure 6 (flame images with dark background) are the instantaneous snapshots obtained from high-speed flame imaging. Since the 4kV_B case (Ms ~ 1.07) (bigger channel) has a similar Ms as that of 10kV_Open (Ms ~ 1.065), a similar flame dynamics is observed in both cases. The flame shows forward extinction as well as significant lift-off (hlft > 3d) and flame tip stretching. The same can be seen in figure 6(c), which shows an initial rise in flame tip (orange) and flame base (blue) distances corresponding to flame stretching and flame lift-off, respectively, in the green region (shock–flame interaction phase, i.e.
 ${\tau _s} < \tau < 1$).
When the charging voltage is further increased in the big channel (2 cm × 10 cm c/s), the flame lift-off during  $\tau < 1$ (green zone) becomes more drastic as higher Ms (> 1.1) values are achieved. The flame lift-off distance (hlft) becomes more than five times the droplet diameter after interaction with the blast wave, leading to a blowout. The flame lift-off is observed to continuously increase in response to the imposed
 ${v_s}$. The same is reflected in the plot in figure 6(d), where the flame base distance (blue) continuously increases drastically (hlft > 10d) in the green region (
 ${\tau _s} < \tau < 1$) before the imminent blowout. The rate of increase in flame tip and flame base distances is observed to increase as the shock strength is increased. This entire phenomenon is observed to occur directly in response to the imposed decaying velocity profile (
 ${v_s}$) at the flame (
 ${\tau _s} < \tau < 1$, green region). For shock focusing with a smaller channel (2 cm × 4 cm c/s), higher Ms values are achieved at the same charging voltages (Ms > 1.1). Thus, the flame dynamics observed is qualitatively similar to the Ms > 1.1 cases of the bigger channel and the flame response is found to occur at even shorter time scales due to higher velocity scales (
 ${v_s}$), as seen in figure 6(e, f). In both the focused cases, for Ms > 1.1, full extinction of the flame is observed during this initial stage of interaction (
 ${\tau _s} < \tau < 1$).
3.2.2. Theoretical estimate of the flame response to the decaying velocity profile (${v_s}$)

The initial flame base lift-off (advection of the flame base in the downstream direction) in different cases in the time period of  ${\tau _s} < \tau < 1$ has been observed to be as a result of the interaction of velocity profile (
 ${v_s}$) with the droplet flame. Thus, the temporal variation of
 ${v_s}$ at the droplet location needs to be evaluated during this stage.
Thus, from the blast wave formulation (§ 3.1), (3.10) can be used to obtain the velocity variation at a given location (r) at any given instant if the instantaneous shock radius (Rs) and Mach number (Ms) are known. Since it has already been established previously that the shock trajectory and Ms are in good agreement with the theory (§ 3.1 and figure 3f–i), the instantaneous values Rs(t), Ms(t) are measured experimentally, and the local velocity,  ${v_s}$(t), at the droplet location, i.e. r = Lt + Ld (for open-field case) or r = Ld (for focused case) can be evaluated using (3.10). The blast wave location is tracked along the centreline using Otsu's thresholding (in built in ImageJ software) on the schlieren images (§ 2) to obtain the shock radius (Rs). Thus, the instantaneous velocity variation (
 ${v_s}$) at the droplet flame location, which is responsible for the advection of the flame base, needs to be evaluated. The instantaneous flame base location (hlft) has been extracted from the high-speed flame imaging using Otsu's thresholding and the advection velocity (
 $v_{b,lft}$) of the flame base is evaluated. The temporal variation of the local velocity at the droplet due to the blast wave profile (
 ${v_s}$,Th) based on theoretical shock trajectory (explained in § 3.1) is also evaluated.
The local velocity ( ${v_s}$) calculated using instantaneous Rs and Ms (from experiments), the temporal variation of the local velocity based on theoretical shock trajectory (
 ${v_s}$,Th) and the instantaneous flame base advection (lift-off) velocity (
 $v_{b,lft}$) are plotted in figure 7(a–f) for different cases. As seen in figure 7(a–f) (green region), the flame base advection velocity (
 $v_{b,lft}$) is obtained to be in decent agreement with the decaying velocity profile (
 ${v_s}$) obtained from the blast wave formulation in the initial stages of the shock–flame interaction (
 ${\tau _s} < \tau < 1$). As the time progresses (
 $\tau > 1$), the induced flow (
 $v_{ind}$) leads to the deviation of the actual flow velocity (corresponding to the flame response) from the theoretical velocity profile (
 ${v_s}$) of the blast wave.
(a–f) Temporal variation of the local velocity ( ${v_s}$) near the flame (based on instantaneous shock parameters), temporal variation of the theoretically obtained local velocity near the flame location (
 ${v_s}$,Th) and instantaneous flame base advection velocity (
 $v_{b,lft}$) plotted against time, t from the explosion for different cases 4kV_B (Movie 3), 8kV_B (Movie 4). 4kV_S (Movie 5), 8kV_S (Movie 6), 5kV_Open (Movie 1), 10kV_Open (Movie 2). The subfigures are the flame snapshots of OH* chemiluminescence depicting flame topology at a given time instant (for reference). (g) Schematic of droplet flame showing flame tip (system I) and flame base (system II), (h) effect of externally imposed flow on flame tip (shedding mechanism), (i) effect of externally imposed flow on flame base (extinction criteria). The error bars represent the maximum error arising due to the shock location measurement variation due to pixel resolution.

3.2.3. Induced flow–flame interaction ($\tau > 1$)

As explained in previous sections, in all the cases, for  $\tau > 1$, induced flow (
 $v_{ind}$) follows the propagating blast wave after some delay. In the case of the open-field blast wave experiments, a weak induced flow (
 $v_{ind}$) occurs behind the blast wave after a certain time delay (yellow region in figure 5), which cannot be distinctly visualised in schlieren imaging. However, the effect of the induced airflow is clearly evident in the flame dynamics. After the initial stage of the interaction between the blast wave and the droplet flame, the flame is observed to show a slower gradual flame lift-off in response to the induced flow (
 $v_{ind}$) for
 $\tau > 1$. This interaction between the induced flow and the droplet flame is hereby referred to as the second stage of the interaction that follows the initial shock–flame interaction. For the open-field cases, the blast wave reaches the droplet flame around t ~ 0.85 ms (
 $\tau = {\tau _s}$) whereas the induced flow (
 $v_{ind}$) effects are observed in the flame response after t ~ 1.5 ms, i.e. the induced flow reaches the droplet flame location after some delay (i.e.
 $\tau > 1.3$). This shows that the induced flow velocity scales (
 $v_{ind}$) are significantly slower when compared with the shock flow, as it takes longer for the induced flow to reach the droplet.
For the lower Ms (lower charging voltage) in the open-field configuration (figure 4a), initially for  ${\tau _s} < \tau < 1$, the flame tip stretches and recedes (see figure 6a,b green region). Later, after a certain time delay, as the relatively slower induced flow (
 $v_{ind}$) reaches the droplet flame (around
 $\tau > 1.3$), the flame again starts to lift off in response to the induced flow (
 $v_{ind}$) at slower time scales after 2 ms (see figure 6a yellow region). This lift-off is accompanied by a flame-shedding event for the Ms < 1.04 subregime, and the flame lifts off to greater heights (hlft > 3d) as Ms is increased due to higher
 $v_{ind}$. At lower Ms, this lifted flame reattaches to the droplet and eventually attains an enveloped state similar to pendant droplet flame prior to the interaction for Ms < 1.04. Furthermore, partial extinction (hlft > 3d) and reignition are observed for 1.04 < Ms < 1.06.
On the contrary, for higher Ms in the open-field cases (Ms > 1.06, see figure 4b), when the induced flow ( $v_{ind}$) reaches the droplet flame for
 $\tau > 1$ (figure 6b yellow region), the lifted flame exhibits lift-off similar to the lower Ms case. However, the gradual lift-off occurs continuously during the interaction with the induced flow (
 $v_{ind}$) and leads to an imminent blowout. This is also observed in the temporal variation of the flame base (blue) in figure 6(b) (yellow region) where the flame base distance from the droplet increases further during the induced flow interaction phase, which finally results in a blowout. This blowout during the interaction with the induced flow has been referred to as ‘gradual blowout’ in figure 6(b) as this extinction occurs after some time delay after the blast wave interaction.
All these events during induced flow interaction phase ( $\tau > 1$) in open-field cases are significantly slower (occurring at t ~ 2–30 ms) compared with the initial interaction with the shock, i.e.
 ${\tau _s} < \tau < 1$ (green region). While the time scale of the initial shock–flame interaction is of the order of O ~ 10−1 ms, the induced flow–flame interaction occurs at a time scale of order O ~ 100 ms, which is slower because of the lower velocity scales associated with the induced flow (
 $v_{ind}$) compared with the flow behind the shock.
The induced flow velocity ( $v_{ind}$) is depicted in figure 7(a,e, f) using light-blue solid line denoted by ‘
 $v_{ind}$’ for the corresponding runs. In these three cases, i.e. 4kV_B (Ms ~ 1.07), 5kV_Open (Ms ~ 1.03) and 10kV_Open (Ms ~ 1.065), the flame is sustained beyond the initial interaction with the blast wave decay profile (green region) and, subsequently, it interacts with the induced flow (yellow region). Since, the induced flow (
 $v_{ind}$) cannot be experimentally obtained for the open-field cases, and the flame only responds to the induced flow in the yellow region, the flame base advection velocity (
 $v_{b,lft}$) is assumed to be of the same order as that of the induced flow (
 $v_{ind}$). In case of 5kV_Open (see figure 7e), the flame base undergoes gradual lift-off accompanied by flame tip shedding in response to this induced flow (
 $v_{ind}$) and then subsequently reattaches to the droplet around t ~ O(102 ms). However, the 10 kV open-field case undergoes full extinction in response to higher
 $v_{ind}$ without reignition and reattachment. Both the 8 and 10 kV open-field cases do not show flame-shedding phenomena. It is to be noted that, for focused cases (Ms > 1.1), the flame extinction is observed to occur during the initial blast wave interaction (green region), and the flame does not survive to interact with the incoming induced flow (
 $v_{ind}$).
3.2.4. Shedding criteria of the flame
Experimentally, it has been observed that, for the current droplet flame considered, the flame shedding only occurs at the low Mach number (Ms < 1.04) for  $\tau > 1$ during the interaction with
 $v_{ind}$, which corresponds to the 5kV_Open case (no shock tube). The shedding events are observed to occur on a time scale of order t ~ O(101 ms) where the velocity scale due to the blast wave profile (
 ${v_s}$) has completely decayed, and the induced flow (
 $v_{ind}$ ~ O(101) m s−1) is the dominant velocity scale present during the shedding phenomena. Thus, compressible effects are minimal corresponding to the low velocity scales of
 $v_{ind}$ on this time scale of
 $\tau > 1$, where flame shedding is observed. The schematic of the flame-shedding mechanism is depicted in figure 7(h) (left), where, due to the buoyancy-induced instability, the hot gases around the flame accelerate along the flame length near the shear layer, leading to continuous vortex rollup. This leads to a continuous feeding of circulation from the locally perturbed region near the droplet (fuel source) along the flame length, which eventually reaches a critical value leading to flame puffing or shedding. As shown by Xia & Zhang (Reference Xia and Zhang2018), in the context of diffusion flames (
 $Ri \to \infty $), the gravitational (buoyancy) term is pivotal for the vorticity generation. Thus, the vorticity transport equation considered near the flame tip (system I) can be written as follows:
 \begin{equation}\frac{{\textrm{D}\omega }}{{\textrm{D}t}} = \; \frac{{{\rho _a}}}{{{\rho ^2}}}(\boldsymbol{\nabla }\rho \times g) + \nu {\nabla ^2}\omega ,\end{equation}
where  $\omega $ is the vorticity,
 $\rho $ is the local density at a given location,
 ${\rho _a}$ is the air density and
 $\nu $ is fluid viscosity. The last term on the right-hand side of the above equation represents the vorticity diffusion term and can be neglected when compared with the first term (baroclinic term due to buoyancy) (Xia & Zhang Reference Xia and Zhang2018). Proceeding in a similar approach as provided by Xia & Zhang (Reference Xia and Zhang2018), the temporal variation of the circulation in the control volume enclosing the shear boundary, as shown in figure 7(h) (right), is given by the summation of the initial circulation strength fed due to the local velocities on either side of the shear layer and the buoyancy-induced vorticity buildup, shown below
 \begin{equation}\frac{{\textrm{d}\varGamma }}{{\textrm{d}t}} = {\rho _a}g\left( {\frac{1}{{{\rho_a}}} - \frac{1}{{{\rho_f}}}} \right)\Delta h + \frac{{\textrm{d}{\varGamma _{initial}}}}{{\textrm{d}t}}.\end{equation}
In the above equation,  ${\rho _f}$ represents the density of the hot gases inside the flame,
 $\mathrm{\Delta }h$ represents the length scale associated with the control volume,
 $\varGamma $ represents circulation in the control volume at a given height and
 ${\varGamma _{initial}}$ represents the initial circulation present in the system due to the local velocity. Hence, for the droplet interacting with flow imposed by the blast wave in the current experiments,
 $\textrm{d}{\varGamma _{initial}} = ( - {v_{NC}} + {v_{ind}})\,\textrm{d}h\; $, as shown in figure 7(h), because
 $v_{ind}$ is the dominant velocity scale imposed. Since
 ${v_{ind}}$ has been observed to be the dominant convective velocity experimentally, dh can be scaled as
 $\textrm{d}h\sim ({v_{ind}} + {v_{NC}})\,\textrm{d}t$. Thus,
 $\textrm{d}{\varGamma _{initial}} = {( - {v_{NC}} + {v_{ind}})^2}\,\textrm{d}t$. Here,
 $v_{ind}$ is the induced flow velocity, which can be experimentally obtained.
Thus, the circulation buildup equation becomes
 \begin{equation}\frac{{\textrm{d}\varGamma }}{{\textrm{d}t}} = {\rho _a}g\left( {\frac{1}{{{\rho_a}}} - \frac{1}{{{\rho_f}}}} \right)\Delta h + v_{ind}^2 - v_{NC}^2.\end{equation}
Thus, the rate of circulation buildup depends on the buoyancy-induced instability and the externally imposed flow ( ${v_{ind}}$). The magnitude of
 $v_{ind}$ for the 5kV_Open case is of similar order as the velocity scale observed by Pandey et al. (Reference Pandey, Basu, Krishan and Vadlamudi2021). Thus, using the scaling for buoyant flickering, i.e.
 ${t_{shd}}\sim \sqrt {h/g} $ (Pandey et al. Reference Pandey, Basu, Krishan and Vadlamudi2021), substituting in the circulation buildup equation and integrating the (3.15) on both sides over one shedding cycle (where the critical circulation is reached for shedding to ensue)
 \begin{equation}{\varGamma _{critical}} = \frac{{{\rho _a}{g^{1/2}}k}}{3}\left( {\frac{1}{{{\rho_a}}} - \frac{1}{{{\rho_f}}}} \right)h_{sh}^{3/2} + k(v_{ind}^2 - v_{NC}^2){g^{ - 1/2}}h_{sh}^{1/2}.\end{equation}
Thus, flame shedding occurs at a height of  ${h_{sh}}$ where the circulation buildup will reach the critical value (
 ${\varGamma _{critical}}$) and the time scale of this shedding is
 ${t_{shd}}$. Experimentally, for 5kV_Open, the time scale of the flame shedding is observed to be around ~15 ms, which is of the order of ~O(101) ms during the interaction with
 $v_{ind}$ (
 $\tau > 1$). This is evident from figure 6(a) in the form of a spike in the flame tip distance (orange) in the yellow region. However, in all the other open-field cases where the flame extinction is observed, the time scale of extinction is found to be of the order of ~O(100) ms, which is one order faster compared with the flame-shedding time scale. Thus, there is not sufficient time for the circulation buildup to reach the critical value (that ensues shedding) before system II (flame base) reaches system I (flame tip), resulting in an extinction event due to the higher advection velocity of system II at higher Ms.
3.2.5. Extinction criteria of the flame
Figure 8(a) shows the temporal variation of the net local velocity ( $v_{comb}$) estimated at the droplet location as the blast wave propagates radially outward, plotted for different cases, where
 $v_{comb}$ =
 ${v_s}$ +
 $v_{ind}$. The initial spike in velocity corresponds to the velocity imposed at the droplet (
 ${v_s}$) in the range
 ${\tau _s} < \tau < 1$ and the secondary spike/discontinuity in the velocity corresponds to the arrival of the induced flow vortex having a velocity scale of
 $v_{ind}$ (obtained experimentally) that arrives at the droplet after some delay (
 $\tau > 1$). The droplet flame response to the externally imposed flow is observed to manifest at the flame base (lift off) and flame tip (shedding) independently. Thus, as shown in figure 7(g), the droplet flame tip and flame base are considered to be two independent systems: system I (flame tip) and system II (flame base). Figure 7(i) depicts the advection of the flame base (system II) towards system I. This advection (lift-off) of system II is dependent on the external flow imposed on the droplet flame. The solid green line figure 7(a–f) shows the theoretically obtained temporal variation of the decaying local velocity (
 ${v_s}$,Th) imposed by the blast wave at the droplet flame location. The flame lift-off (hlft) is influenced by only the blast wave profile for Ms > 1.1, however, for Ms < 1.1, the induced flow (
 $v_{ind}$) also affects the flame base advection velocity (
 $v_{b,lft}$). Thus, the combined velocity (
 $v_{comb}$) of the decay profile at the droplet flame location (
 ${v_s}$,Th) and the subsequent induced flow velocity (
 $v_{ind}$) determine the overall advection of the flame base (system II)
 \begin{equation}{v_{comb}}(t) = {v_{s,Th}}(t) + {v_{ind,inst}}(t).\end{equation}
(a) Temporal variation of the total velocity at the droplet location that is obtained by the summation of the instantaneous velocity estimated using the blast wave formulation and the induced flow. (b,c) Temporal variation of the flame tip and base dimensions depicting the partial extinction, reignition for 7kV_Open, and full extinction for 10kV_Open. The subfigures are the instantaneous snapshots obtained from high-speed flame imaging. (d) Extinction criteria: lift-off ratio vs time for different cases. (e) Time series snapshots of schlieren flow visualisation showing the shape deformation of the windward density interface of the plume of hot gases around the droplet flame during interaction with shock. ( f) Schematic of blast wave and the windward density interface of the hot gas plume around the droplet flame depicting the density and imposed pressure gradient directions that governs the baroclinic torque: RMI. (g) Schematic of the shape deformation phenomenon of the windward density interface of the hot gas plume during interaction with the blast wave.

Since it has been established that the flame base lift-off velocity is a direct response to the local velocity at the flame (see figure 7a–f), the cumulative area under the plot  $v_{comb}$(t) vs time gives the total distance travelled by the flame base (hlft ,max). Experimentally, it has been observed that flame extinction occurs when the advection velocity of system II (flame base) is sufficient to traverse the flame length and reach system I and, thus, interact with it. This interaction between system II and system I results in a critical strain rate, leading to flame extinction. Thus, the advection of system II towards downstream, reaching system I (flame tip), is the criterion for extinction. Thus, the ratio of hlft and htip (flame tip distance) is plotted against time in figure 8(d). Figure 8(d) shows that the lift-off ratio (hlft/htip) gradually increases with time as the flame interacts with the total local velocity imposed by the external flow. The vertical dotted line in figure 8(d) represents the approximate time instant when the velocity profile behind the blast wave decays and approaches zero (
 $\tau > 1$). The left side of the vertical dotted line represents the initial shock–flame interaction (
 ${\tau _s} < \tau < 1$) and the right side of the dotted line represents the induced flow–flame interaction (
 $\tau > 1$). The horizontal dotted line corresponds to the lift-off ratio approaching unity. It can be observed that, for focused blast wave cases at higher Ms > 1.1, the lift-off ratio (hlft/htip) crosses unity during the initial interaction with the decaying velocity profile. This implies that, for these cases, system II interacts with system I during the initial shock–flame interaction (
 ${\tau _s} < \tau < 1$), which is in agreement with the experiments.
On the contrary, for lower Ms < 1.1, the lift-off ratio (hlft/htip) does not approach unity during the initial interaction ( ${\tau _s} < \tau < 1$). That means the flame is sustained beyond
 $\tau \sim 1$, and it subsequently starts to interact with the induced flow (
 $v_{ind}$) for
 $\tau > 1$. During the induced flow–flame interaction (
 $\tau > 1$), the lift-off ratio (hlft/htip) is observed to reach unity for Ms > 1.04 (except 5kV_Open). This suggests that the flame extinction occurs during the interaction with the induced flow (
 $v_{ind}$) for lower Mach number cases except for the 5kV_open case, for which the lift-off ratio does not reach unity. This is consistent with the experimental observation of the absence of extinction occurrence in 5kV_Open. Furthermore, the lift-off ratio of 10kV_open (Ms ~ 1.065) approached unity with a steeper slope compared with 7kV_open (Ms ~ 1.05), 8kV_open (Ms ~ 1.055). This suggests that, even though the extinction occurs in all the cases, the velocity (
 $v_{b,lft}$) of the flame base (system II) advection is faster in the case of 10kV_open compared with 7kV_open and 8kV_open. This higher velocity of system II advection can be attributed to the occurrence of full extinction (due to the critical strain rate) in the case of 10kV_open (see figure 8c). Additionally, it can be hypothesised that the shallow slope of 7kV_open and 8kV_open indicates a lower advection velocity of system II resulting in lower strain rates during its interaction with system I (when the lift-off ratio reaches unity). This might be attributed to the occurrence of partial extinction in these two cases (7kV_Open, 8kV_Open), which resulted in reignition and reattachment of the flame subsequently (see figure 8b).
3.2.6. The RM instability during flame–shock interaction
Figure 8(e) shows the schlieren snapshot time series of the response of the hot plume (around the flame) during the interaction with the blast wave ( ${\tau _s} < \tau < 1$) for the case of 8kV_S. It is evident from the images that, during the initial blast wave interaction, the hot plume is swept downstream, which corresponds to the flame base lift-off event. Along with this, it can also be observed that the topology of the hot plume and the flame alter during the interaction with the blast wave. As shown in figure 7(a–d) (subfigures), the flame is observed to deform, forming a vortical structure for (Ms > 1.1) during the initial stage of interaction with the blast wave, which can be attributed to the vorticity generation in the flame region as a result of shock propagation (Picone & Boris Reference Picone and Boris1988; Ju et al. Reference Ju, Shimano and Inoue1998). The vorticity is generated in the flame region due to RM instability (RMI; a special case of RT instability) that occurs when the local pressure gradient (imposed by the shock) is misaligned with the density gradient across the plume interface. The pressure gradient is caused by the acceleration field (gravity) in RT instability, whereas, in the case of RMI, the pressure gradient is caused by the propagating shock wave (Zhou et al. Reference Zhou2021). Considering the vorticity transport equation at the windward side of the interface of the hot plume around the flame (see figure 8f)
 \begin{equation}\frac{{\textrm{D}\omega }}{{\textrm{D}t}} = u\boldsymbol{\cdot }\boldsymbol{\nabla }\omega - \omega \boldsymbol{\cdot }\boldsymbol{\nabla }u + \frac{{\boldsymbol{\nabla }\rho \times \boldsymbol{\nabla }P}}{{{\rho ^2}}} + \nu {\nabla ^2}\omega .\end{equation}
The third term on the right-hand side represents the baroclinic component of the vorticity transport equation that occurs due to the misalignment of the density and pressure gradients and predominantly contributes to the vorticity generation. Furthermore, this baroclinic term is shown to be most pertinent to the immediate discussion of RMI by Zhou et al. (Reference Zhou2021) compared with the first term (vortex stretching), second term (vorticity dilation) and the last term (vorticity dissipation) on the right-hand side even during shock wave interaction. Thus, this baroclinic vorticity term is activated when pressure and density gradients are misaligned, which deposits vorticity on the density interface upon passage of the shock wave. This vorticity causes the perturbations on the density interface to deform, which leads to RMI perturbation growth. Thus, depending on the curvature and geometry of the flame region (blob of density inhomogeneity), baroclinic vorticity is generated in the system, which eventually rolls up into vortex filaments or vortex rings (Picone & Boris Reference Picone and Boris1988), as shown in figure 7(a–d) (subfigures). As consequence of this RMI-induced vorticity generation, the plume around the flame also exhibits shape deformation during its interaction with the blast wave.
The general behaviour of RMI perturbation growth at an interface strongly depends on the Atwood number (A), which signifies the difference in density of the two mediums on either side of an interface and it is given by
 \begin{equation}A = \frac{{{\rho _2} - {\rho _1}}}{{{\rho _2} + {\rho _1}}},\end{equation}
where  ${\rho _1}$ and
 ${\rho _2}$ are the densities of the media on either side of the interface and the shock wave is considered to propagate from medium 1 (
 ${\rho _1}$) to medium 2 (
 ${\rho _2}$). If A > 0, then the interface perturbation spikes simply grow towards the lower-density material. However, for A < 0, phase inversion is observed where the perturbations begin to deform, forming inverted spikes that grow in the opposite direction into the low-density side (Sterbentz et al. Reference Sterbentz, Jekel, White, Aubry, Lorenzana and Belof2022).
When the shock propagates downstream across the interface, it interacts with the flame region containing a lower-density hot plume (around the flame). In the current experiments, the shock enters from a denser medium (air) to a rare medium (plume of hot gases), thus the Atwood number A < 0, which leads to phase inversion of the perturbations. It is also reflected in the experiments as shown in figure 8(e), where the shape of the windward density interface of the hot plume is initially convex upstream (downwards) and inverts, exhibiting a concavity (facing upstream) after the initial interaction with the blast wave (see figure 4c–f and supplementary figure S3). This phenomenon of the reversal of the interface curvature is due to RMI which occurs when the shock wave interacts with a density interface propagating from a denser (unburnt gases) to a rarer (burnt gases) medium, i.e. A < 0 (La Flèche Reference La Flèche2018; Sterbentz et al. Reference Sterbentz, Jekel, White, Aubry, Lorenzana and Belof2022; Yang et al. Reference Yang, Lin, Li and Lai2023). The schematic of this instability is depicted in figure 8(g), showing the phase inversion of the curvature of the density interface leading to the formation of a cusp-like structure. This cusp-like structure further grows into the lighter fluid side and subsequently curls up, forming vortical structures near the flame base. This leads to the aforementioned alteration in the flame topology forming vortical structures (as shown in figure 7a–d, subfigures) as the consequence of the RMI-induced vorticity generation.
Kramer et al. (Reference Kramer, Pullin, Meiron and Pantano2010) investigated the single-mode RMI and showed that, for weak and intermediate shocks, the impulsive model of the RT instability is adequate for the prediction of the perturbation growth rate. Hence, this is applicable to the current experiments where the blast wave is near the weak shock limit. The growth of the amplitude (a) due to RT instability of the single-mode perturbation on a discontinuous interface is given by (Zhou Reference Zhou2017; Zhou et al. Reference Zhou2021)
 \begin{equation}\frac{{{\textrm{d}^2}a}}{{\textrm{d}{t^2}}} = gkAa.\end{equation}
Where k = 2 ${\rm \pi}$/λ is the wavenumber, ‘g’ is acceleration and ‘a’ is perturbation amplitude.
Following Zhou (Reference Zhou2017) and Zhou et al. (Reference Zhou2021), for a varying acceleration, i.e.  $g(t) = \Delta u\delta (t)$, (using the Dirac delta function) the initial impulse corresponding to the velocity jump imparted by the shock is given by
 $\int {g(t)\,\textrm{d}t} = \Delta u$, which can be integrated to obtain the following equation for perturbation growth during shock interaction that is valid for the specific type of interaction observed in the current experiments:
 \begin{equation}\frac{{\textrm{d}a}}{{\textrm{d}t}} = kA\Delta u{a_o}.\end{equation}
Where ‘ao’ is the initial amplitude of the perturbation, ‘ $\Delta u$’ is the velocity jump imposed by the blast wave, i.e. (~
 $v_{peak}$) and ‘A’ is the post-shock condition Atwood number across the density interface.
3.3. Effect of shock focusing using a shock tube
Unlike the open-field case, in focused cases (with shock tube) the induced flow behind the blast wave has to exit from the shock tube into the surrounding ambient. This causes the flow to curl as it exits the shock tube, forming vortical structures. Researchers like Qin et al. (Reference Qin, Xiang, Lin and Liu2020), Zare-Behtash, Kontis & Gongora-Orozco (Reference Zare-Behtash, Kontis and Gongora-Orozco2008), Zare-Behtash et al. (Reference Zare-Behtash, Kontis, Gongora-Orozco and Takayama2009), Zhang et al. (Reference Zhang, Chen, Li and Jiang2014) and Ahmad, Hasan & Sanghi (Reference Ahmad, Hasan and Sanghi2020) investigated the CVRs exiting as shock tube. The formation dynamics of the CVRs has been investigated for different types of CVRs: shock-free, with embedded shock and with secondary vortices. It has been shown that the CVRs roll up and grow in size and pinch off from the shock tube exit as they propagate downstream. In the current experiments, the CVR is a consequence of a blast wave generation (using the wire-explosion technique) due to which the current CVR observed needs to be characterised experimentally. From the experiments, it is observed that, at lower Ms (lower charging voltage), the vortex formed tends to dissipate quickly as it propagates downstream. The induced flow vortex has to travel Ld ~ 35 mm outside the shock tube in order to interact with the droplet flame. This induced flow vortex is visually noticeable in the experimental images in figure 4(c–f). Similar to the blast wave, the induced flow vortex is observed to travel faster in the case of the smaller shock tube channel (2 cm × 4 cm c/s) compared with the bigger channel (2 cm × 10 cm c/s). It is to be noted that, unlike the literature, the CVR behind the blast wave in the current experiments did not exhibit any shock-cell structures in its trailing wake that are observed behind shock waves in the literature (Ahmad et al. Reference Ahmad, Hasan and Sanghi2020). This behaviour qualitatively matches with the observations of experiments by Chan et al. (Reference Chan, Giannuzzi, Kabir, Hargather and Doig2016), where the distinct shock-cell structures are observed in the CVR wake in case of a shock tube exhaust of a compressed-air-driven shock wave but no visible shock-cell structures are observed in the CVR wake in the case of a shock tube exhaust of an explosively driven shock wave.
As the charging voltage is increased in the case of a bigger channel (Ms > 1.1), the induced flow vortex behind the blast wave becomes more distinct, as shown in figure 4(d). However, by the time the induced flow reaches the droplet, the flame blowout would have already occurred during the initial shock–flame interaction phase due to higher Ms. Similar blowout during initial shock–flame interaction is observed in the case of a smaller channel as well, due to the higher focusing effect resulting in higher Ms (Ms > 1.1). This can be seen in figures 6(d) and 6(c) where the flame extinction has already occurred in the green region (shock–flame interaction) when the flame base (blue) is advected downstream rapidly to interact with the flame tip (orange). In all the cases, as the flame extinguishes, the hot gases at the flame rise up, and they curl to form a toroidal structure due to RT instability (see figure 4).
3.3.1. Induced flow vortex characterisation
As explained before, the induced flow begins to curl as it exits the shock tube channel forming a vortical structure. The vortical structures are visibly noticeable in the schlieren imaging, suggesting density variation in the vortical flow behind the blast wave. Thus, it can be concluded that it is a compressible vortex. Figure 9(a) shows the schematic of the flow exiting the open end of the shock tube. It can be seen in figure 9(a) that the blast wave first exits the shock tube followed by the induced flow that travels at lower velocity scales compared with the blast wave. As discussed before, the blast wave has a decaying velocity profile behind it which is depicted in the schematic. The propagating blast wave imposes a velocity jump ( ${v_s}$) or discontinuity (compared with the ambient downstream of it), and the velocity monotonically decays in amplitude behind the blast wave until the induced flow vortex arrives at the location.
(a) Schematic showing the blast wave, induced flow behind it and the CVR originating from the shock tube exit. Time series of the schlieren imaging of the shock flow for different cases: (b) 4kV_B, (c) 8kV_B, (e) 4kV_S, ( f) 8kV_S, (d) schematic of the three-dimensional evolution of the CVR exiting the shock tube.

Figure 9(b) shows the time series of the flow exiting the shock tube for low shock strength, i.e. 4kV_B case (Ms ~ 1.07). The shock exiting the shock tube initially is planar near the exit. However, as it propagates downstream, the blast wave attains curvature as it expands radially outward away from the shock tube. This is the planar to cylindrical transition of the blast wave depicted in figure 3(a), which has been explained in detail in § 3.1. The induced flow follows the blast wave and exits the shock tube with some delay, which is evident from the slow-moving vortex at the shock tube exit. The vortex ring is not strong enough and its translation velocity is significantly slower compared with the blast wave for the 4kV_B case. Furthermore, the vortex starts to dissipate before reaching the droplet (see figure 4c).
However, in the case of higher charging voltages with the bigger channel, i.e. 8kV_B case (figure 9c), the Mach number is higher, and the blast wave shows higher contrast, indicating a higher jump in the fluid property at the shock front. The CVR is more pronounced, exhibiting higher contrast, and the CVR translation velocity is also higher. As the induced flow exits the shock tube, expansion fan structures are formed due to flow expansion, as shown in figure 9(c). A trailing jet can be observed in the case of higher charging voltages. In the case of the smaller channel (figure 9e, f), at a similar Mach number, the translational velocity of the vortex is observed to be higher compared with the bigger channel.
At lower charging voltages, the CVR appears as a thin vortex loop, indicating a very thin localised region having compressible effects near the vortex core similar to figure 9( f). Multiple corrugations and oscillations were observed in the vortex ring as it travelled downstream. As the charging voltage is increased with the smaller channel, the velocity scales become significantly higher and the CVR appears even more pronounced with higher contrast. For high charging voltages, the CVR is observed to have embedded-shock structures. The figure also shows the presence of multiple smaller secondary vortices at the CVR (see figure 9e). Figure 9(d) shows the temporal schematic of the evolution of the three-dimensional macro-features of the CVR, which are also observed in the time series shown in figure 9( f). The further details of the CVR evolution are provided in the supplementary material.
3.4. Flow–droplet interaction ($\tau > 1$)

The droplet dynamics during the interaction with the shock tube exhaust flow occurs in two stages. During the initial stage of the interaction, continuous droplet deformation is observed, which occurs in the time scale of the decay of the velocity imposed by the blast wave ( ${v_s}$), i.e.
 ${\tau _s} < \tau < 1$, as shown in figure 10(a) (green region). Due to the local velocity imposed by the blast wave (
 ${v_s}$), a high-pressure region is developed at the forward stagnation point of the droplet (polar location). This difference between the stagnation pressure at the polar location and the static pressure at the equator of the droplet, i.e. (
 $\mathrm{\Delta }P = {P_p}\; - \; {P_{eq}}$) causes deformation of the droplet into an oblate shape, which results in a continuous increase in the droplet length scale in the equatorial plane. The surface tension forces on the droplet surface resist this deformation. Hence, the non-dimensional parameter that indicates the competing forces involved in deformation, i.e. the deformation Weber number, can be written as
 $W{e_d}\sim \Delta P \cdot {R_e}/\sigma$, which is the ratio of the deforming force and the restoring surface tension force, where Re is the equatorial radius of curvature (Sharma et al. Reference Sharma, Chandra, Basu and Kumar2023a). Hence, as the droplet starts to deform, the surface tension forces are overpowered by the deforming forces, as indicated by the increasing Weber number with deformation. Thus, the droplet continues to deform, leading to flattening into an oblate shape leading to bag-type breakup, as shown in figure 10(a,b) (green region).
(a) Time series plot depicting two stages of the interaction with the droplet: (i) Decaying velocity profile behind the blast wave interacts with the droplet (green region) and (ii) CVR formed from the induced flow exiting the shock tube interacting with the droplet (purple region). The simultaneous time series images of the droplet shadowgraphy (top) and schlieren (bottom) are shown in each of the interaction stages (with time stamps) for three different cases on the x-axis: 4kV_S, 6kV_B and 8kV_S, respectively. (b) Schematic of the droplet breakup modes at different Weber numbers. Green region represents the blast wave decay profile ( ${v_s}$) interaction and purple region represents the induced flow interaction (
 $v_{ind}$).

Furthermore, during the same time scale ( ${\tau _s} < \tau < 1$), simultaneously alongside this continuous deformation, KH instability-induced perturbations were also observed on the windward surface of the droplet at higher Ms (higher instantaneous Weber numbers based on
 ${v_s}$), as shown in figures 5 and 10(b) (green region). These perturbations temporally grow into KH waves along the windward surface of the droplet, leading to transport of the fluid towards the periphery in the equatorial plane. This results in the formation of a sheet at the equatorial location. A similar mechanism has been reported by Sharma et al. (Reference Sharma, Singh, Rao, Kumar and Basu2021), which has been observed in the current experiments, as shown in figure 10(a) (green region). It is to be noted that, since the quartz rod is holding the droplet in pendant mode, due to the presence of the rod, the droplet breakup will not be the same as that of the contactless droplet. However, the qualitative response of the droplet dynamics will remain similar so long as the droplet dynamics does not enter the wake of the quartz rod. Since in the initial deformation process, the KH wave formation and sheet formation are observed to occur upstream of the quartz rod, the droplet dynamics observed is qualitatively representative of that of contactless droplets.
3.5. Regime map
A regime map is depicted in figure 11, showing the overall picture of the flame and droplet dynamics during the interaction between a combusting droplet and shock tube exhaust flow. The regime map depicts three stages of the interaction phenomena in the current experiments, where the effect of Ms is depicted for different cases for all three stages of interaction. In figure 11, the cyan background is used to represent the open-field blast wave case (without shock tube), whereas the red background is used to represent the shock tube focusing cases. Data points are plotted for different charging voltages and shock tube configurations with respect to Ms. The representative images for those cases depicting the flame response are included in figure 11 accordingly. A time axis is shown in z-direction, depicting the time scale of occurrence of each stage of the interactions. The data points plotted in the regime map have different symbols with different colours to represent specific types of phenomena that occur at a specific stage of interaction. The regime map is broadly divided into two zones along the time axis: (i) interaction with the shock ( ${\tau _s} < \tau < 1$) and (ii) interaction with the induced flow (
 $\tau > 1$). The direct shock wave interaction is only seen with the droplet flame, whereas the droplet itself remains unaffected by it in the case of the open-field configuration. However, for the focused cases, the droplet shows deformation for all Ms and simultaneous KH wave perturbation growth is also observed in the case of high Ms. Furthermore, the induced flow in the open-field case affects only the flame and the induced flow CVR that forms at the shock tube exit, and only interacts with the droplet and not with the flame as the flame blowout would have already occurred for focused cases by the time the CVR arrives. The induced flow–droplet interaction is plotted with respect to the Weber number based on the velocity scale of the induced flow (
 $v_{ind}$) instead of Ms, in figure 11. For focused cases, the induced flow velocity scale is the same as the velocity scale associated with the CVR, i.e.
 $v_{CVR}$.
Regime map depicting phenomena in different configurations (open-field and two shock tube focusing cases) in three interaction regimes: shock–flame, induced flow–flame and induced flow CVR–droplet interactions with a time axis in the z-direction. The flame interaction regimes are plotted against Ms whereas the droplet interaction is plotted against the Weber number based on the induced flow and initial droplet diameter. The cyan region represents the open-field and the red region represents the shock tube focusing configurations, respectively. All the different phenomena occurring in different regimes are represented by different symbols and colour codes as shown in the legend.

4. Conclusion
The interaction between a combusting droplet and the flow imposed by a coaxially propagating blast wave is investigated experimentally with a wire-explosion-generated blast wave in both open-field and shock tube focused configurations. The addition of the shock tube directs and focuses the blast wave along the axial direction, leading to higher Mach numbers (Ms), thus facilitating a wide range of Mach numbers. An induced flow is observed behind the blast wave that reaches the droplet location after some time delay. The entire interaction with the droplet is found to occur in two stages: interaction with the velocity profile ( ${v_s}$) behind the blast wave (
 ${\tau _s} < \tau < 1$) and the interaction with the induced flow (
 $v_{ind}$) behind the blast wave (
 $\tau > 1$). The droplet flame is observed to interact with the blast wave velocity profile and subsequently with the induced flow, showing two stages of response on two different time scales. The theoretical model for blast wave propagation obtained with a power-law density profile assumption is used to obtain the velocity profiles imposed by the blast wave in the open-field configuration. Furthermore, the blast wave emerging from the shock tube opening is modelled to transition from planar to a cylindrical blast wave as it propagates downstream, which agrees with the experiments. However, this theoretical variation of local velocity at the droplet location is only valid during the initial stages, after which the entrainment effects start to affect the flow, which leads to induced flow. The local velocity at the droplet is initially due to the temporally decaying velocity profile behind the blast wave (
 ${v_s}$), which eventually approaches zero and, subsequently, the induced flow (
 $v_{ind}$) due to the entrainment effects reaches the droplet. The relatively slower induced flow is observed to form a CVR in a shock tube focused configuration, as it exits the shock tube. The vortex dynamics and shape evolution have been studied and the velocity scales involved were experimentally measured to get a comprehensive understanding of the flow qualitatively and quantitatively.
The droplet and flame are observed to respond to the imposed flow independently. The flame is observed to interact with the blast wave velocity profile ( ${v_s}$) during the initial stages, which results in forward extinction, flame lift-off, which leads to extinction for higher Ms. It has been shown that the flame lift-off directly responds to the velocity profile behind the blast wave. For Ms > 1.1, the flame is observed to fully extinguish during the initial interaction with the blast wave. However, for lower Ms, the flame survives beyond the initial blast wave interaction, and it starts to interact with the slower induced flow (
 $v_{ind}$) subsequently, at longer time scales. The flame is observed to interact with the induced flow (
 $v_{ind}$), exhibiting a wide range of responses such as forward extinction, shedding, lift-off, partial extinction and reignition, depending on the Mach number. The different subregimes of the flame behaviour have been identified and flame extinction criteria and flame-shedding criteria have been proposed based on the flow imposed. The flame base shape evolution during the initial interaction with the blast wave has been explained using RMI. The effect of the blast wave and the induced flow showed a significant effect on the droplet in focused configurations whereas minimal droplet deformation is observed for the open blast configuration. The droplet exhibited temporal deformation into an oblate shape for all these cases and the droplet dynamics was observed to occur in two stages: initial interaction with the blast wave and subsequent interaction with the CVR. At lower Ms , the droplet elongates equatorially and undergoes RT piercing, exhibiting a bag breakup mode of atomisation during the eventual interaction with the induced flow vortex (CVR). Unlike lower Ms, alongside continuous deformation, the droplet exhibited KH instability-induced perturbation growth on the windward surface. This leads to shear-induced stripping as the perturbations further grow, leading to sheet formation and rupture at the equator resulting in secondary atomisation. The Weber number ranges based on the induced flow velocity scale (
 $v_{ind}$) for different modes were observed to be in good agreement with the literature.
Supplementary material and movies
Supplementary material and movies are available at https://doi.org/10.1017/jfm.2024.575.
Funding
The authors are thankful to SERB (Science and Engineering Research Board) – CRG: CRG/2020/000055 for financial support. S.B. acknowledges funding through the Pratt and Whitney Chair Professorship. A.A. and S.J.R. acknowledges funding through the Prime Minister's Research Fellowship (PMRF).
Declaration of interests
The authors report no conflict of interest.