


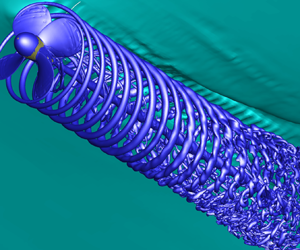



1. Introduction
The structure of propeller wakes received great attention in the past (Kerwin Reference Kerwin1986; Conlisk Reference Conlisk1997) and in recent years (Felli, Camussi & Di Felice Reference Felli, Camussi and Di Felice2011; Muscari, Di Mascio & Verzicco Reference Muscari, Di Mascio and Verzicco2013; Di Mascio, Muscari & Dubbioso Reference Di Mascio, Muscari and Dubbioso2014; Muscari, Dubbioso & Di Mascio Reference Muscari, Dubbioso and Di Mascio2017; Magionesi et al. Reference Magionesi, Dubbioso, Muscari and Di Mascio2018) because the evolution of the main vortical structures that emanate from the blade tips and the hub is tightly related to vibrations, noise and aerodynamic/hydrodynamic performances. Both experimental investigations (Felli et al. Reference Felli, Camussi and Di Felice2011) and numerical predictions by detached eddy simulation (Muscari et al. Reference Muscari, Di Mascio and Verzicco2013; Di Mascio et al. Reference Di Mascio, Muscari and Dubbioso2014) revealed that, under certain loading conditions, the tip vortices tend to pair in the near wake; moreover, vortex pairing can replicate further downstream and eventually can induce hub vortex instability, thus triggering the breakdown of the main coherent structures normally observed in the wake. When vortex pairing happens, the frequency of the most energetic mode halves; this phenomenon causes, for instance, a variation of the signature of the propeller in terms of noise.
The wake of a rotor has a very complex topology, with several vortical systems with various shapes and strengths. Three main structures are generally present: tip vortices, blade vortex sheets and hub vortex. For each blade, the tip vortex and the blade vortex sheet correspond to the trailing vortex system of a wing, whose local strength is proportional to the radial variation of blade circulation. Since the most significant circulation variation appears at the blade end, vorticity is markedly higher at the tip than in the rest of the blade vortex sheet, with a distinguishable concentrated tip vortex. The hub vortex system is a well-defined streamwise structure, where the vorticity is equal in strength and opposite in orientation to the sum of blade vortex systems (in a simplified portrait of inviscid flow plus horseshoe vortices, it consists of the sum of each horseshoe vortex for the blades).
In a more realistic picture of a viscous fluid, the blade vortex sheet also carries the vorticity generated in the boundary layer that detaches at the trailing edge. Moreover, horseshoe vortices are also present at each blade root. All these structures interact during downstream convection in a peculiar way that depends on the blade load (i.e. local incidence). For some loading conditions, the regular vortex system becomes unstable. In these conditions, helicoidal instabilities appear on the surface of vortex tubes first; then, tip vortices tend to pair and form a single vortex; when the loading further increases, a second pairing takes place further downstream. Higher blade loads can also lead to the destruction of coherent structures.
These basic mechanisms were investigated using experimental techniques based on flow velocimetry and visualizations (Felli, Camussi & Guj Reference Felli, Camussi and Guj2009), theoretical models (Okulov & Sørensen Reference Okulov and Sørensen2007) and numerical techniques based on detached-eddy simulations (Muscari et al. Reference Muscari, Di Mascio and Verzicco2013; Di Mascio et al. Reference Di Mascio, Muscari and Dubbioso2014) or large-eddy simulations (Kumar & Mahesh Reference Kumar and Mahesh2017; Posa et al. Reference Posa, Broglia, Felli, Falchi and Balaras2019; Wang et al. Reference Wang, Wu, Gong and Yang2021a,Reference Wang, Wu, Gong and Yangb).
According to the theoretical analysis in Okulov & Sørensen (Reference Okulov and Sørensen2007), wake destabilization is due to blade vortex sheet breakdown, which otherwise acts as a constraint for the tip and hub vortices. Flow visualizations (Felli et al. Reference Felli, Camussi and Di Felice2011), corroborated by numerical simulations (Muscari et al. Reference Muscari, Di Mascio and Verzicco2013; Ahmed, Croaker & Doolan Reference Ahmed, Croaker and Doolan2020; Wang et al. Reference Wang, Wu, Gong and Yang2021a,Reference Wang, Wu, Gong and Yangb), performed on the four-bladed E779A marine propeller, clearly highlighted the dynamics of the tip and hub vortices. The tip vortex is the first to experience helical instabilities associated with self- and coil-to-coil interaction due to self-induction. These perturbations propagate along the vortex tube and cause transverse oscillations of the cores. Further downstream, due to the weakening of the blade vortex sheet, the tip and hub vortices are no longer linked and evolve independently as separate structures. The hub vortex may experience complex oscillatory modes, from the early phases of its motion to its final breakdown in some circumstances (Magionesi et al. Reference Magionesi, Dubbioso, Muscari and Di Mascio2018). On the contrary, in the absence of the blade sheet (that damps tip vortex oscillations), the interactions between consecutive tip vortices are strengthened, giving rise to long-wave instabilities and promoting the merging of two adjacent tip vortices. Reduced-order analysis using proper orthogonal decomposition and dynamic mode decomposition of detached-eddy simulations proved that the merging process consists of a sequence of modes with an asymmetric evolution of the coupled tip vortices at the periphery of the slipstream (Magionesi et al. Reference Magionesi, Dubbioso, Muscari and Di Mascio2018). Consequently, the hub vortex experiences transverse oscillations that amplify downstream, driving a low-frequency precession motion of the outer structures.
These mechanisms amplify vortex stretching and tilting, with complete redistribution of the vorticity that leads to the complete loss of coherence in the wake and transition to almost homogeneous turbulence. Experimental observations and numerical simulations show that all vortex pairing mechanisms and instabilities move upstream when the blade load increases; this happens because the distance between tip vortices decreases, thus increasing the mutual interaction.
Researchers have extensively studied the wake structure for propellers operating in unbounded flow (open-water conditions); nevertheless, a ship propeller operates close to the water–air interface in realistic conditions. Of course, the interaction depends on both the depth and loading, it being mild when the propeller is far from the free surface or lightly loaded while it becomes relevant for high blade loads and reduced submergence. The scenario can be further complicated by air trapping in the flow (ventilation) or phase transition (cavitation). In all cases, the proximity of the free surface breaks the axial symmetry of the open-water conditions, with the onset of side loads on the propeller and often strong vibrations.
Many past experiments and numerical simulations aimed to quantify propeller loads (Califano & Steen Reference Califano and Steen2011; Kim, Lee & Seong Reference Kim, Lee and Seong2014; Li et al. Reference Li, Martin, Michael and Carrica2015; Paik Reference Paik2017; Lungu Reference Lungu2020; Wang et al. Reference Wang, Martin, Felli and Carrica2020; Sun et al. Reference Sun, Pan, Liu, Zhou and Zhao2022) or aimed at the development of predictive tools able to take into account blade–free-surface interaction (Kozlowska & Steen Reference Kozlowska and Steen2017; Kozlowska, Savio & Steen Reference Kozlowska, Savio and Steen2017). On the other hand, a detailed analysis of the propeller wake operating beneath a free surface is still lacking. The knowledge of propeller wake details is essential because, in some loading conditions, the vortical structures can persist in the far wake and determine the acoustic signature of the propeller, which is of paramount importance, e.g. in the context of anti-surface warfare where the prediction of propeller-radiated noise based on the nominal wake can lead to misleading conclusions. Recent analyses reported in Cianferra & Armenio (Reference Cianferra and Armenio2021) proved that the free surface plays an important role when scaling model-scale data to full scale, even though the air–water interface was considered flat and fixed.
Given the contribution of turbulent terms to noise, the investigation of the free-surface effects on the evolution of the vortex structures in the transition zone and the far field is fundamental for the development of silent propeller design procedures. Experiments about the interaction of vortices with the free surface by particle image velocimetry for a five-bladed propeller in isolated conditions can be found in Paik, Lee & Lee (Reference Paik, Lee and Lee2008), whereas in Paik, Lee & Lee (Reference Paik, Lee and Lee2005) measurements in the wake of a propeller installed behind a ship hull are reported. The study revealed that the free surface caused a momentum change of the flow passing through the upper half of the propeller; moreover, it affected the trajectory of the tip vortices. In both studies, the measurements were limited to the near field. Wang et al. (Reference Wang, Martin, Felli and Carrica2020) report analogous investigations about the wake past a propeller installed behind a submarine using experimental measurements and numerical simulations, also for the far field. The study showed that when the propeller operates with slight submergence and high load, the interaction with the free surface induces instabilities and vortex breakdown in the near field.
In the present paper, we investigate the wake evolution of a propeller operating beneath a free surface and compare it with identical nominal loading conditions in open water; the goal is to identify the effect of the water–air interface on the wake structure. For this purpose, we performed detached-eddy simulation for the INSEAN E779A propeller, the one used in Felli et al. (Reference Felli, Camussi and Di Felice2011), and for which experimental data are available. The geometry is the same as in previous numerical studies (Muscari et al. Reference Muscari, Di Mascio and Verzicco2013; Di Mascio et al. Reference Di Mascio, Muscari and Dubbioso2014; Muscari et al. Reference Muscari, Dubbioso and Di Mascio2017; Magionesi et al. Reference Magionesi, Dubbioso, Muscari and Di Mascio2018). In the chosen test conditions, the propeller axis is horizontal at a fixed distance  $h = 3D/4$ from the free surface, where
 $D$ is the propeller diameter. Three different advance coefficients
 $J=U_\infty /nD$ (where
 $U_\infty$ is the free-stream velocity,
 $n$ is the number of revolutions per second and
 $D$ is the diameter) were considered, namely
 $J=0.71$,
 $0.60$ and
 $0.525$. The selected loading values avoid the onset of ventilation on the blades or air ingestion with the wake.
The results show that the free surface's proximity completely changes the vortex dynamics in the wake compared with similar operating conditions in the unbounded flow. Some particular mechanisms like vortex pairing, observed in open-water conditions, are delayed and sometimes suppressed. Moreover, the asymmetry introduced by the free surface gives rise to significant side load and relevant oscillation, which can cause vibrations on the structures and additional radiated noise.
2. Mathematical and numerical models
In what follows, the fluid density  $\rho$, the propeller radius
 $R$ and the modulus of the propeller speed of rotation
 $\omega = |\boldsymbol {\omega }|$ are the reference quantities defining all the non-dimensional variables; therefore, in index notation
 $x_i= x^{dim}_i/R,\ i=1,2,3$ are the non-dimensional coordinates,
 $u_i = u^{dim}_i/(\omega R),\ i=1,2,3$ are the non-dimensional velocity components,
 $Re=\omega R^{2}/\nu$ (
 $\nu$ being the kinematic viscosity) is the Reynolds number and
 $Fr=\sqrt {R\omega ^{2}/g}$ is the Froude number,
 $g$ being the modulus of the acceleration of gravity, considered positive downward.
The Navier–Stokes equations for incompressible flow are written in a non-dimensional form with index notation in a fixed reference frame where the  $x=x_1$ axis coincides with the propeller axis, the
 $z=x_3$ axis is positive upwards and the right-hand rule determines the
 $y=x_2$ axis. The equations are
 \begin{equation}
\left.\begin{array}{l@{}} u_{k,k} = 0,\\ u_{i,t} + u_j
u_{i,j} + p_{,i} = [\nu_T (u_{i,j}+u_{j,i})]_{,j}\quad
i=1,2,3, \end{array}\right\}
\end{equation}
where the repeated indices mean summation, the commas mean differentiation, i.e.  $(\,\cdot \,)_{,j} = \partial (\,\cdot \,) / \partial x_j$,
 $(\,\cdot \,)_{,t} = \partial (\,\cdot \,) / \partial t$,
 $t$ is the time and
 $p$ is difference between the static and the hydrostatic pressure:
 \begin{equation} p = p' + \frac{x_3}{Fr^{2}} = \frac{p^{dim}}{\rho \omega^{2} R^{2}}+ \frac{g x^{dim}_3}{R^{2} \omega^{2}} . \end{equation}
Finally,  $\nu _T = 1/Re + \nu _{turb}$ is the total kinematic viscosity and
 $\nu _{turb}$ is the turbulent viscosity, computed by means of the detached-eddy simulation model of Spalart and Allmaras (Spalart et al. Reference Spalart, Jou, Strelets and Allmaras1997).
We performed the computation in an inertial frame of reference in translation with the same axial velocity of the propeller. As boundary conditions, uniform incoming flow  $U_\infty$ was enforced on the far upstream boundary, whereas the velocity gradient is zero at the far downstream boundary. On the propeller surface
 $S_p$ the fluid velocity is
 \begin{equation} \boldsymbol{u}(\boldsymbol{x}_P) = \boldsymbol{x}_P \times \boldsymbol{\omega},\quad \boldsymbol{x}_P \in S_p. \end{equation}
There is the additional free boundary for free-surface computation, on which we enforce the kinematic and dynamic boundary conditions. In particular, the free surface  $S_{FS}$, defined by the implicit function
 $F(t,x_1,x_2,x_3)=0$, is a material surface and then
 \begin{equation} F_{,t} + u_j F_{,j} = 0, \quad \boldsymbol{x}_P \in S_{FS}. \end{equation}
If the air above the water is neglected together with surface tension, the dynamic boundary conditions are
 \begin{equation} {-}p n_i + \nu_T (u_{i,j} + u_{j,i}) n_j ={-} n_i \frac{x_3}{Fr^{2}}, \quad \boldsymbol{x}_P \in S_{FS}. \end{equation}
A finite-difference scheme approximates the above equations on a block-structured grid with partial overlapping. We adopted the fourth-order approximation for convection and pressure terms because of its low dissipation properties and, in order to control odd–even oscillations, we add a nonlinear fourth-order dissipation term (similar to the one in Jameson, Schmidt & Turkel (Reference Jameson, Schmidt and Turkel1981)) to both divergence and momentum equations. We approximate the viscous terms with a second-order centred scheme and the time derivatives with a standard three points backward, fully implicit formula. Therefore, the global accuracy of the scheme is  $2$.
We discretized the eddy viscosity equation using the same numerical scheme adopted for divergence and momentum.
We used a single-phase level-set approach to deal with free-surface flows. More details about the implementation of the above numerical scheme on block-structured grids with partial overlapping and the solution of the discrete equations can be found, for example, in Di Mascio, Broglia & Muscari (Reference Di Mascio, Broglia and Muscari2007), Di Mascio et al. (Reference Di Mascio, Muscari and Dubbioso2014), Muscari et al. (Reference Muscari, Dubbioso and Di Mascio2017) and Magionesi et al. (Reference Magionesi, Dubbioso, Muscari and Di Mascio2018).
3. Numerical set-up
We implemented the discrete equations on a block-structured grid with partial overlapping; the most refined grid consists of about  $21.7$ million points. We built two coarser meshes for grid dependence verification by removing every other point from the next finer level: therefore, the medium grid consists of about
 $2.7$ million points and the coarsest of about
 $0.34$ million points. Figure 1(a) reports the grid on the propeller surface, while the background grid for the open-water computation is shown in figure 1(b). As also reported in table 1, the far-field boundary is placed at a distance of
 $20R$ on the side, at
 $25R$ upstream and
 $30R$ downstream. The grid is more refined around the propeller and in the wake region, as shown by the cross-section at the midline in figure 1 and reported in more detail in table 1. The grid is further refined near the propeller and in the wake behind it, in a region whose cross-section is 30 % larger than the propeller radius
 $R$.
Grid details: open-water computation. (a) Surface grid. (b) Grid on the far boundary. (c) Cross-section on the  $xz$ plane. (d) Cross-section on the
 $yz$ plane. (e) Grid in the near field. ( f) Rotating and fixed grid in the near field.

Domain and grid details.

A portion of the grid, within a cylinder that extends from  $1.6R$ upstream of the propeller to
 $0.75R$, rigidly rotates with it. In order to have a regular transition of the grid between the refined inner zone and the background grid in the far field, we added a buffer region with increasing cell size from the innermost to the outermost layers.
The grid adopted for free-surface computation is identical in the refined inner and buffer zone. Instead, we cut the outer background grid in the upper part and replaced it with one adequate for capturing the free-surface evolution in the whole domain and more refined close to the propeller, where the interface deformation is large. Figure 2 shows a global view and a cross-section for this grid. Details about the size of the subdomains and the number of grid points in each can be found in table 1.
Grid details: free-surface computation.

For all the computations, the non-dimensional propeller radius  $R$ is
 $1$. Similarly, the modulus of the non-dimensional propeller angular velocity
 $\omega$ is equal to
 $1$ so that the blade tip velocity is always
 $1$ in magnitude; the different loading conditions adopted in the simulations reported in the following sections, defined by the advance ratio
 $J=U_\infty /nD$, are therefore obtained by varying the non-dimensional value of
 $U_\infty$.
In all the simulations, the Reynolds number is  $Re = \omega R^{2} /\nu = 1.78 \times 10^{6}$, corresponding to the real model propeller used in Felli et al. (Reference Felli, Camussi and Di Felice2011). For free-surface computations, the Froude number is
 $Fr=\omega \sqrt {R/g} = 16.91$.
Given the choice of  $\omega$, the non-dimensional revolution period is always
 $T=2 {\rm \pi}$. The adopted time step for the computation on the finest grid is
 $\Delta T = 2 {\rm \pi}/360$, i.e. the propeller rotates at
 $1^{\circ }$ per time step.
For all the free-surface computations, the propeller axis is  $1.5 R$ below the water–air interface (see figure 3).
Position of the propeller below the free surface.

4. Uncertainty assessment
In order to assess the numerical uncertainty, we produced two coarser grid levels by removing every other grid point from the next finer. Also, we doubled the time step for each grid coarsening to retain the Courant–Friedrichs–Lewy condition value. For all the computations, the flow starts from rest on the coarsest grid and the propeller rotation gradually increases to its final value with a cubic time ramp, i.e. the angular velocity starts from zero and increases in time as
 \begin{equation} \omega(t)
=\left\{\begin{array}{@{}ll} \omega_0 \left[ 3
\left(\dfrac{t}{t_0}\right)^{2} - 2
\left(\dfrac{t}{t_0}\right)^{3} \right] & \mbox{for}\ 0 < t
< t_0 \\ \omega_0 & \mbox{for}\ t \ge t_0 .
\end{array}\right. \end{equation}
In the above equation,  $t_0$ is the period of the propeller rotation. The incoming flow starts from zero and accelerates to its final value using an identical time ramp. On the coarse grid, the initial transient dies out after
 $O$(20–30) propeller rotations, depending on the loading conditions. The integration continues for an additional 20 propeller revolution periods after the end of the transient phase. Then, we interpolate the solution on the medium grid, and again the flow continues for 20 propeller revolution periods after the end of the transient (when starting from the interpolated solution, the transient phase is much shorter, being
 $O$(5–10) revolution periods). Finally, we repeated the same procedure from the medium to the fine grid. This procedure has the double benefit of yielding coarse-grid solutions for uncertainty assessment and saving computing time.
4.1. Verification and validation for global quantities
In table 2 we report the values for the thrust coefficient  $K_T=F_x/(\rho n^{2} D^{4})$ and torque coefficient
 $K_Q=M_x/(\rho n^{2} D^{5})$ computed on three grid levels for several values of the advance coefficient; here,
 $F_x$ and
 $M_x$ are the
 $x$ component of force and moment, respectively. We computed the convergence rate and the uncertainty as suggested in Roache (Reference Roache1997). From the values in the table, the convergence rate is very close to the theoretical value for the thrust coefficient for all loading conditions for both open-water and free-surface simulations, while it is often lower and close that for the torque coefficient. Nevertheless, the estimated uncertainty is always low also for the torque. The observed departure of the convergence rate from the expected values for some cases is due to the inability of the coarse grid to capture some flow details adequately (in other words, the coarsest grid is not in the asymptotic range for the solution). However, the numerical uncertainty is always very low, even when the solution fails to exhibit the theoretical convergence with grid refinement.
Thrust and torque coefficients.

We compare the open-water computations with available experimental data (Felli et al. Reference Felli, Camussi and Di Felice2011) in figure 4(a) and are perfectly consistent with that already computed in Muscari et al. (Reference Muscari, Di Mascio and Verzicco2013), where some of the computations here reported were performed in the rotating reference frame with a different numerical scheme. We repeated the simulations by using the same grid in the near field and the same numerical schemes adopted for the free-surface computations, in order to remove the possible difference deriving from different numerics.
(a) Comparison between simulations and experiments for open-water computations. (b–d) Comparison of force coefficients between open water and free surface for  $J=0.525$.

From the data reported in table 2, there is a minimal variation in the average values of the global forces between open-water conditions and free-surface computation, the most significant difference being about  $2\,\%$ for thrust and torque at the higher loading condition
 $J= 0.525$. Despite this, we show that the wake structure can significantly change when the free surface interacts with the tip vortices. Moreover, although close in terms of average values, the free-surface computations reveal that there can be a relevant oscillation of the forces, especially for high blade load, as shown in figure 4(b–d) where the non-dimensional forces at
 $J=0.525$ for open-water and free-surface conditions are plotted in dashed and solid lines, respectively. Note that there are also relevant oscillating force components in the propeller plane (
 $K_Y = F_y/(\rho n^{2} D^{4})$ and
 $K_Z = F_z/(\rho n^{2} D^{4})$ in figure 4), whose averages are not zero; these forces cause bending and vibrations of the propeller shaft on actual ships.
More interesting is the comparison of the forces on a single blade. The side force coefficient is defined as  $K_\alpha = F_\alpha /(\rho n^{2} D^{4})$,
 $F_\alpha$ being the force in the peripheral direction, i.e. normal to the blade axis. It is given by
 \begin{equation} F_\alpha = F_y \cos \alpha - F_z \sin \alpha, \end{equation}
where  $F_y$ and
 $F_z$ are the force components along the
 $y$ and
 $z$ axes for the single blade. Figure 5(a,b) reports the thrust and side force coefficients as a function of the rotation angle in degrees
 $\alpha$; the red vector in figure 5(c) shows the side force on the single blade. The position
 $\alpha =0^{\circ }$ corresponds to the upper vertical position of the blade (i.e. when the blade is in its closest position to the free surface); moreover,
 $\alpha$ has the same sign as
 $\omega$, the angular position increasing in the clockwise direction when seen from the positive direction of the
 $x$ axis (i.e. from the rear of the propeller). On the single blade, the forces attain their extrema near the upper position, the maximum being around
 $\alpha \sim -45^{\circ }$ and the minimum around
 $\alpha \sim 20^{\circ }$. This seemingly strange behaviour derives from the local map of the difference between the actual incidence (determined by the instantaneous flow direction)
 $\beta$ and the nominal incidence
 $\beta _0$, given in degrees by
 \begin{align} \Delta \beta = \frac{180}{\rm \pi} (\beta - \beta_0) = \frac{180}{\rm \pi} \left[\arctan{\left(\frac{w\sin{\alpha} - v\cos{\alpha} + \omega r }{u} \right)} - \arctan{\left(\frac{\omega r }{U_\infty} \right)} \right], \end{align}
where  $r = \sqrt {y^{2}+z^{2}}$. As shown in figure 5(c), the flow approaching the blades has neither left–right nor up–down symmetry because of the blockage effect of the free surface, combined with the propeller rotation. The propeller accelerates the approaching flow because it generates a thrust, which causes an upstream pressure drop, making the free surface move downward. Therefore, the relative tangential velocity is higher during the upward motion for
 $y<0$ and lower when it moves downward for
 $y>0$. Because of the thrust, the upstream axial velocity also increases; this partially reduces the incidence variation (see (4.3)), but the asymmetry persists. The observed thrust and tangential force oscillated about
 $9\,\%$ for
 $J=0.525$ at the considered submergence.
Higher loading condition  $J=0.525$. (a,b) Comparison of the forces on a single blade during propeller revolution. (c) Difference between the local incidence and the design incidence upstream of the propeller; the red vector represents the side force for a single blade.

4.2. Assessment of grid resolution for large-eddy simulation in the wake
In order to verify the appropriateness of the adopted grid far from the propeller surface, where the turbulence model reduces to a large-eddy simulation, we evaluated the modelled kinetic energy and compared it with the total energy. To do that, we proceeded as follows. From the Boussinesq approximation, we can write the subgrid stresses in index notation as
 \begin{equation} R_{ij}^{SGS} = \overline{u}_i \overline{u}_j - \overline{u_i u_j} = \nu_{turb} (\overline{u}_{i,j} + \overline{u}_{j,i} ) -\tfrac{2}{3} K_{mod} \delta_{ij}, \end{equation}
where  $K_{mod}$ is the modelled kinetic energy:
 \begin{equation} K_{mod} = \tfrac{1}{2} R^{SGS}_{ii} = \tfrac{1}{2} \left(\overline{u_i u_i} - \overline{u}_i \overline{u}_i \right). \end{equation}
In order to estimate  $K_{mod}$ and its ratio to the total kinetic energy, we adopted a procedure similar to the one suggested in Pope (Reference Pope2000). For the sake of simplicity, we used a top-hat function for filtering; moreover, all the cells are supposed to be cubic with size
 $\varDelta$ (of course, there is no difficulty in generalizing the analysis to more general cell shape and other filters; here, the goal is to obtain an order-of-magnitude estimation of
 $K_{mod}$). Consider any velocity component
 $u_i$ at a point
 $\boldsymbol {x} = (x_1,x_2,x_3)$; from the definition of filtered velocity, with a top-hat filter, we have
 \begin{equation} \overline{u}_i (\boldsymbol{x}) = \frac{1}{\varDelta^{3}} \int^{x_3+\varDelta/2}_{x_3-\varDelta/2} \int^{x_2+\varDelta/2}_{x_2-\varDelta/2} \int^{x_1+\varDelta/2}_{x_1-\varDelta/2} u_i (\xi_1,\xi_2,\xi_3)\,{{\rm d}}\xi_1\,{{\rm d}}\xi_2\,{{\rm d}}\xi_3 . \end{equation}
If the integrand can be expanded in Taylor series up to a certain order  $N$, i.e.
 \begin{equation} u_i (\xi_1,\xi_2,\xi_3) = \sum_{n=0}^{N} \sum_{m=0}^{n} \left.\frac{\partial^{n} u_i}{\partial^{m} x_k \partial^{n-m} x_s}\right|_{\boldsymbol{x}} \frac{(\xi_k - x_k)^{m}(\xi_s - x_s)^{n-m}}{m! (n-m)!} + O(\varDelta^{N+1}), \end{equation}
then (4.6) can be rewritten as
 \begin{align} \overline{u}_i (\boldsymbol{x}) &= \sum_{n=0}^{N} \sum_{m=0}^{n} \left[\left.\frac{\partial^{n} u_i}{\partial^{m} x_k \partial^{n-m} x_s}\right|_{\boldsymbol{x}} \vphantom{\int^{x_2+\varDelta/2}_{x_2-\varDelta/2}}\right. \nonumber\\ &\quad \times \left.\frac{1}{\varDelta^{3}}\int^{x_3+\varDelta/2}_{x_3-\varDelta/2} \int^{x_2+\varDelta/2}_{x_2-\varDelta/2}\int^{x_1+\varDelta/2}_{x_1-\varDelta/2} \frac{(\xi_k - x_k)^{m}(\xi_s - x_s)^{n-m}}{m! (n-m)!} {{\rm d}}\xi_1 \,{{\rm d}}\xi_2 ,{{\rm d}}\xi_3\right] \nonumber\\ &\quad + O(\varDelta^{N+1}). \end{align}
It is easy to check that all the integrals containing terms with odd powers are null; therefore
 \begin{equation} \overline{u}_i = u_i + \frac{\varDelta^{2}}{12} u_{i,kk} + O(\varDelta^{4}) \end{equation}
and consequently
 \begin{equation} \overline{u}_i \overline{u}_i = u_i u_i + \frac{\varDelta^{2}}{12} 2 u_i u_{i,kk} + O(\varDelta^{4}). \end{equation}
Similarly
 \begin{equation} \overline{u_i u_i} = u_i u_i + \frac{\varDelta^{2}}{12} ( u_i u_i )_{,kk} + O(\varDelta^{4}). \end{equation}
Then
 \begin{equation} \overline{u_i u_i} - \overline{u}_i \overline{u}_i = \frac{\varDelta^{2}}{12} \left[ (u_i u_i)_{,kk} - 2 u_i u_{i,kk} \right] + O(\varDelta^{4}) = \frac{\varDelta^{2}}{12} u_{i,k} u_{i,k} + O(\varDelta^{4}), \end{equation}
from which
 \begin{equation} K_{mod} = \frac{\varDelta^{2}}{24} u_{i,k} u_{i,k} + O(\varDelta^{4}). \end{equation}
Moreover, from (4.9) we also have that
 \begin{equation} \overline{u}_{i,k} = u_{i,k} + \frac{\varDelta^{2}}{12} u_{i,kpp} + O(\varDelta^{4}) \end{equation}
and therefore, up to  $O(\varDelta ^{4})$,
 \begin{equation} K_{mod} = \frac{\varDelta^{2}}{24} \overline{u}_{i,k} \overline{u}_{i,k} + O(\varDelta^{4}). \end{equation}
We assumed  $\varDelta = \sqrt [3]{V}$,
 $V$ being the volume of the cell. As we adopted the DES approach as in Spalart et al. (Reference Spalart, Jou, Strelets and Allmaras1997), the above estimation makes sense only far from the walls because the model is such that the equations transform into Reynolds-averaged Navier–Stokes equations in the boundary layer.
For the sake of conciseness, only the estimated instantaneous ratio  $K_{mod}/(K_{mod}+K_{res}) = K_{mod}/K_{Tot}$ for the loading conditions
 $J=0.71$ and
 $J=0.525$ on the medium and fine grids is reported in figures 6 and 7. Here
 $K_{res}$ is the resolved kinetic energy, defined as
 \begin{equation} K_{res} = \frac{(\overline{u}_i - U_\infty \delta_{i,1})(\overline{u}_i - U_\infty \delta_{i,1})}{2} , \end{equation}
 $(U_\infty,0,0)$ being the velocity vector on the inflow section. Inspection of the results shows that this ratio is almost everywhere below 0.3 on both the fine and medium grids. This ratio becomes larger (
 $>0.3$) in the far wake for
 $x>9.0R$, where the cell size is too large, and in the boundary layer on the propeller, where we have a Reynolds-averaged Navier–Stokes equation simulation. As discussed in Pope (Reference Pope2000, Reference Pope2004), this ratio is a reasonable indicator of the amount of modelled kinetic energy and, therefore, of the appropriateness of grid resolution. In particular, the grid is acceptably refined when the above ratio is below the threshold value of
 $0.3$, as observed outside the boundary layer for all the computations reported in the following.
Advance coefficient  $J=0.71$;
 $K_{mod}/(K_{mod}+K_{res})$ on the
 $xz$ plane. (a) Medium grid. (b) Fine grid.

Advance coefficient  $J=0.525$;
 $K_{mod}/(K_{mod}+K_{res})$ on the
 $xz$ plane. (a) Medium grid. (b) Fine grid.

5. Results
We report the numerical results for increasing blade loading, which means decreasing values of the advance ratio  $J=U_\infty /nD$. We compare the flow fields computed with the free surface with the analogous computations in open-water conditions for each value of
 $J$.
In order to quantify the flow characteristics, we extracted the solution at each time step on the horizontal plane ( $xy$ in figure 8) and the vertical plane (
 $xz$). The instantaneous kinetic energy was then expressed by Fourier transform and reported at some discrete points (numerical probes A–L in the figure) close to the tip vortices and in the hub wake to investigate the frequency content.
Plane and probe positions on the horizontal and vertical planes.

5.1. Results for  $J = 0.71$

For this loading condition in open water, both experimental observations (Felli et al. Reference Felli, Camussi and Di Felice2011) and numerical simulations (see figure 9a) show that the wake structure is highly regular. In figure 9(a) the vortex system is described in terms of the  $Q$-criterion (Hunt, Wray & Moin Reference Hunt, Wray and Moin1988) by plotting the surface
 $Q = -2$, where
 \begin{equation} Q = u_{i,j} u_{j,i}. \end{equation}
The structure of the free-surface flow is very similar to that observed for the open-water condition and exhibits the same regular structure. Observing the  $y$ component of the vorticity on the vertical plane containing the propeller axis confirms this. The simulations show that the tip vortices, the root vortices and the hub vortex remain unchanged in the presence of the free surface. The only relevant difference is the spiralling surface instability of the hub vortex, which seems to have shifted downstream. This change of position is due to the deformation of the free surface (reported in figure 9e) because, although the ‘signature’ of the vortex system on the free surface is barely visible for this loading condition, the observed lowering of the surface behind the propeller induces an additional flow acceleration, as shown from the comparison of the velocity cuts on the plane
 $y=0$ at
 $z=\pm 1.1$ reported in figure 10. In open-water conditions, the average velocity outside the propeller slipstream must be lower than the velocity of the incoming flow because the current is accelerated inside the wake by the propeller's action, and then it must slow down outside the slipstream to have constant flow mass. On the contrary, in free-surface conditions, the constraint on the velocity magnitude reduces the flow deceleration outside the propeller wake, and the constant mass flow condition is attained by free-surface lowering. The velocity profiles differ only in the upper part of the slipstream and are almost identical in the lower portion (see figure 10). The increased outside velocity in a free-surface situation causes an increment of the propeller pitch (i.e. of the distance of the tip vortex coils, as shown in figure 11) and therefore the situation is analogous to that of a propeller operating in open water at a higher
 $J$ (lower blade load), at least in the flow close to the free surface. Note from figure 11 that the vertical position of the vortex cores follows the free-surface profile.
Results for  $J=0.71$; wake structure. (a) Isosurface
 $Q=-2$; open-water condition. (b) Isosurface
 $Q=-2$; free-surface condition. (c) The
 $y$ component of vorticity; open-water condition. (d) The
 $y$ component of vorticity; free-surface condition. (e) Free-surface elevation
 $\Delta z = z-z_0$.

Results for  $J=0.71$. Comparison of the velocity profiles on the vertical plane at
 $z=1.1$ (a) and
 $z=-1.1$ (b) between free-surface and open-water conditions.

Results for  $J=0.71$. Comparison of vortex core positions. The levels
 $Q=-3$ are reported as white spots for free-surface condition and with dark lines for open-water condition.

In figure 12 we report the spectrum of the kinetic energy recorded at three points along the tip vortex trajectories close to the surface ( $y=0,\ z=0.9R$) and in the opposite position with respect to the propeller axis (
 $y=0,\ z=-0.9R$) wake; the points are placed at
 $x=1,5, 8$ (points close to the free surface A, B, C and points far from the free surface G, H, I in figure 8). We compare all the spectra computed for free-surface flow with those for open-water conditions. We applied a fast Fourier transform to the time history of the resolved kinetic energy; the value
 $K$ reported in the plots is the magnitude of the complex Fourier coefficients as a function of the frequency
 $f$.
Results for  $J=0.71$. Comparison of the kinetic energy spectrum between open-water (OW, blue curves) conditions and free-surface (FS, red curves) conditions. Probes in the near wake
 $x=1$ (a,b), in the mid wake (c,d) and in the far wake (e, f). Parameters: (a)
 $x = R$;
 $y = 0$;
 $z = 0.9R$; (b)
 $x = R$;
 $y = 0$;
 $z = -0.9R$; (c)
 $x = 5R$;
 $y = 0$;
 $z = 0.9R$; (d)
 $x = 5R$;
 $y = 0$;
 $z = -0.9R$; (e)
 $x = 8R$;
 $y = 0$;
 $z = 0.9R$; ( f)
 $x = 8R$;
 $y = 0$;
 $z = -0.9R$.

An inspection of figure 12 shows that most of the energy content lies in the blade frequency component and its multiples, with some contributions coming from the component at a non-dimensional frequency  $2$ for point C for the open-water condition, which is due to incipient vortex pairing in the far wake (Felli et al. Reference Felli, Camussi and Di Felice2011; Muscari et al. Reference Muscari, Di Mascio and Verzicco2013).
The observed spectra at the same points for the free-surface condition confirm that the free boundary stabilizes the wake for this loading condition, as the peaks at non-dimensional frequency  $f=2$ almost disappear for all the points (like C, I) in the far wake at
 $x=8$ (see plots in figure 12e, f). Again, this stabilizing action is due to an equivalent open-water condition with a slightly higher advance coefficient
 $J$.
Curiously, the spectra exhibit a constant slope in the logarithmic plane for  $f>20$, with a value very close to that of Kolmogorov's spectrum
 $-5/3$, although the flow conditions are very far from homogeneous turbulence. This slope is a property of the spectra at a high frequency for both open water and free surface at all loading conditions (see the following subsections).
5.2. Results for $J = 0.60$

For this loading condition, vortex pairing in the far wake takes place for the propeller operating in open water. The plots in figure 13 show the flow in terms of the  $Q$-criterion (
 $Q=-2$) and
 $y$ component of the vorticity on the plane
 $y=0$. Vortex pairing can appear for
 $x>6$; here the tip vortices exhibit helicoidal instability, then merge and wrap around each other (clearly visible in terms of vorticity), in close agreement with the experimental observation. A similar spiralling instability on the hub vortex surface starts around
 $x=3$.
Results for  $J=0.60$; wake structure. (a) Isosurface
 $Q=-2$; open-water condition. (b) Isosurface
 $Q=-2$; free-surface condition. (c) The
 $y$ component of vorticity; open-water condition. (d) The
 $y$ component of vorticity; free-surface condition. (e) Free-surface elevation
 $\Delta z = z - z_0$.

The structure of the flow is deeply affected by the presence of the free surface. Although the helicoidal instability seems to be enhanced and triggered at a position closer to the propeller for the tip and hub vortices, the pairing process does not take place; instead, the tip vortices break in smaller vortices. The reason for this behaviour is due, as for the loading condition  $J=0.71$, to the interaction of the vortical structure with the free surface; in fact, the variation of the velocity on the free surface yields again a small increase of the horizontal velocity and, consequently, an increase in the propeller pitch takes place, as shown by the velocity profiles reported in figure 14 and by a comparison of the vortex core positions in the vertical plane, shown in figure 15. As for the previous loading conditions, the velocity profiles are close to each other in the lower portions, whereas they significantly differ in the region close to the free surface; in this case, though, they are entirely different for
 $x>6$ because of the different instability mechanisms. Like for
 $J=0.71$, the equivalent increased pitch induces a downstream shift of the vortex pairing process. Nevertheless, for this loading condition, the variation of blade loading with the angular position (due to the free-surface effects, as described in the previous section) is no longer negligible as it was for
 $J=0.71$, it being around
 $7\,\%$. This change in the blade load induces a circulation variation that perturbs the vortex cores, thus triggering the spiralling instability at a position closer to the propeller than in open-water conditions, where the blade loading is practically constant. This instability mechanism can be explained with the help of a simplified conceptual model.
Results for  $J=0.60$. Comparison of the velocity profiles on the vertical plane at
 $z=1.1$ (a) and
 $z=-1.1$ (b) between free-surface and open-water conditions.

Results for  $J=0.60$. Comparison of vortex core positions on the plane
 $y=0$. The levels
 $Q=-3$ are reported as white spots for free-surface condition and with dark lines for open-water condition.

Figure 16(a) reports the blade load as a function of the angular position; if a bound vortex represents the vortex system of the blade with time-varying circulation proportional to the loading, continuous shedding of trailing vorticity takes place to comply with Helmholtz's first theorem (figure 16b describes the process at some discrete instant  $t_i$). The mechanism is equivalent to that described in Di Mascio et al. (Reference Di Mascio, Muscari and Dubbioso2014) for a propeller operating in oblique flow. As the circulation varies along the vortex length, the velocity induced by adjacent tip vortices on each vortex element does not cancel as would happen with constant circulation (constant blade loading, as in open-water conditions), but it can be outward- or inward-directed, as shown in figure 17. The net result is a perturbation on each vortex with the same period of revolution. Another source of perturbation that distorts the vortices comes from the periodic shed trailing vortices that induces a deformation almost parallel to a cylindrical surface around the propeller axis. In summary, for this loading condition, two concurrent mechanisms appear: the first has a stabilizing effect on the vortex system and is related to the incremented velocity outside the slipstream; the second is a destabilizing action connected to the quasi-periodic change in the vortex core circulation. For this loading condition,
 $J=0.60$, the first mechanism seems to prevail over the second, with a global stabilizing effect that leads to vortex pairing suppression.
Blade load (a) and sketch of vorticity in the wake (b).

Sketch of mutual interaction.

The vortex signature on the free surface is much more evident than that for the previous loading condition and reveals the distortion of the tip vortex close to the surface, whose trajectories are bent backward. An inspection of the kinetic energy spectra in figure 18 for points A and G at  $x=R$ in the tip vortex trajectoriesshows that the energy distribution between modes is almost identical in open-water and free-surface conditions; some differences appear for
 $x=5R$ at points B and H in the mid wake, where the open-water flow shows the inception of a mode at frequency
 $f=2$ (incipient pairing), whereas the dominant frequency for the free-surface flow is still the blade frequency
 $f=4$. In the far wake at
 $x=8R$, the first vortex pairing is well developed and visible in the open-water flow. For the free-surface flow, on the contrary, a significant frequency component is visible at the hub frequency
 $f=1$ at point C close to the free surface, whereas at point I below the propeller axis a relevant component at
 $f=2$ (related to the first vortex pairing) appears, together with relevant components at frequencies higher than the blade frequency. As for the previous case, the slope of all the spectra for
 $f>20$ is very close to the
 $-5/3$ spectrum.
Results for  $J=0.60$. Comparison of the kinetic energy spectrum between open-water (OW, blue curves) conditions and free-surface (FS, red curves) conditions. Probes in the near wake
 $x=1$ (a,b), in the mid wake (c,d) and in the far wake (e, f). Parameters: (a)
 $x = R$;
 $y = 0$;
 $z = 0.9R$; (b)
 $x = R$;
 $y = 0$;
 $z = -0.9R$; (c)
 $x = 5R$;
 $y = 0$;
 $z = 0.9R$; (d)
 $x = 5R$;
 $y = 0$;
 $z = -0.9R$; (e)
 $x = 8R$;
 $y = 0$;
 $z = 0.9R$; ( f)
 $x = 8R$;
 $y = 0$;
 $z = -0.9R$.

5.3. Results for $J = 0.525$

For this loading condition, the helicoidal instabilities move upstream in open water and appear around  $x=3$ for the tip and hub vortices; a first vortex pairing at
 $x \sim 5$ and an additional pairing at
 $x \sim 7$ take place. Figure 19 reports these phenomena in terms of
 $Q$ surface and
 $y$ component of vorticity, vortex pairing being particularly clear from the vorticity contours.
Results for  $J=0.525$; wake structure. (a) Isosurface
 $Q=-2$; open-water condition. (b) Isosurface
 $Q=-2$; free-surface condition. (c) The
 $y$ component of vorticity; open-water condition. (d) The
 $y$ component of vorticity; free-surface condition. (e) Free-surface elevation
 $\Delta z = z -z_0$.

The spectra reported in figure 20 show that, as usual, the energy distribution among the frequency components is almost the same for both operating conditions for  $x=R$. In the mid-wake at
 $x=5R$, the dominant peak at
 $f=2$ of the open-water condition (closely related to the first pairing process for the tip vortices) is absent for free-surface conditions. In the far wake at
 $x=8R$, the spectrum for the open-water flow has two peaks for
 $f=1$ and
 $f=2$; on the contrary, the free-surface spectrum has only a maximum for
 $f=2$ close to the free surface, whereas kinetic energy components of comparable strength appear at all frequencies in the lower part; this last aspect is due to the almost complete vortex breakup in the far wake for this loading condition.
Results for  $J=0.525$. Comparison of the kinetic energy spectrum between open-water (OW, blue curves) conditions and free-surface (FS, red curves) conditions. Probes in the near wake
 $x=1$ (a,b), in the mid wake (c,d) and in the far wake (e, f). Parameters: (a)
 $x = R$;
 $y = 0$;
 $z = 0.9R$; (b)
 $x = R$;
 $y = 0$;
 $z = -0.9R$; (c)
 $x = 5R$;
 $y = 0$;
 $z = 0.9R$; (d)
 $x = 5R$;
 $y = 0$;
 $z = -0.9R$; (e)
 $x = 8R$;
 $y = 0$;
 $z = 0.9R$; ( f)
 $x = 8R$;
 $y = 0$;
 $z = -0.9R$.

When examining the wake for the free-surface conditions, the plots in figure 19 show that the mutual interaction between tip vortices and the free boundary is essential for this loading condition; in particular, the tip vortices are strongly backward-distorted close to the surface, with substantial deformation of the water–air interface. The top view in figure 21(b) shows the distortion of the vortex system close to the free surface; as for the vorticity variation along the vortex core, the abrupt change in the vortex orientation can be attributed to the change of the blade loading with the angular position, as reported in figure 5. The tip vortices are almost tangential to the local velocity vector in the rotating frame; therefore, the angle between the tangent to the vortex tube and the  $x$ plane is given by
 \begin{equation} \eta = \left. \arctan \left( \frac{ u }{v_\theta}\right) \right|_{r=R} = \left. \arctan \left( \frac{ u }{w\sin{\alpha} - v\cos{\alpha} + \omega r}\right) \right|_{r=R}, \end{equation}
where  $\alpha$ is the angle shown in figure 5 and
 $v_\theta$ is the tangential velocity in the rotating system. This angle is the complementary angle to the local incidence
 $\beta$ calculated in (4.3); therefore,
 $\eta$ is smaller where
 $\beta$ is larger and vice versa, i.e. it is larger for
 $y>0$ and smaller for
 $y<0$. The abrupt change in the slope at
 $y=0$ is related to the fast change in the local incidence around that point, revealed by the variation observed in the blade thrust.
Results for  $J=0.525$. (a) Free-surface conditions. (b) Top view of the vortex system.

In figure 22 the details of the free surface–vortex interaction are reported on the plane  $y=0$. The velocity field induced by the tip vortices causes a strong deformation of the free surface that tends to wrap around the vortex cores; moreover, a significant production of vorticity with opposite sign close to the surface occurs, similarly to that observed for steady two-dimensional flow, where the vorticity is proportional to the local surface curvature and the tangential velocity (Batchelor Reference Batchelor1967). The instability mechanism related to the variable vorticity, already observed for
 $J=0.60$, is more intense because of the increased blade load (which implies increased circulation) and the closer interaction with the deformed free surface that moves closer to the tip vortices in the upper region. For this case, the increase of coil-to-coil distance is more significant than before (see figure 23) near the interface. Nevertheless, the destabilizing mechanism due to variable blade loading due to free-surface effects seems to prevail, as the second pairing is almost absent, while the first moves downstream and is characterized by vortex breakdown. This fact appears from the plots of the spectra in figure 20: in fact, a relevant peak at
 $f=2$ (a symptom of the first vortex pairing) appears only for point C placed at
 $(8,0,0.9)$, whereas it is almost absent for all the probes at
 $(x,0,-0.9)$ (i.e. the farthest probes from the free surface).
Results for  $J=0.525$; free surface–vortex interaction on plane
 $y=0$.

Results for  $J=0.525$. Comparison of of vortex core positions. The levels
 $Q=-3$ are reported as white spots for free-surface condition and with dark lines for open-water condition.

6. Conclusion and perspectives
In the present paper, we analysed the vortex dynamics in the wake of a marine propeller operating underneath a free surface utilizing a detached-eddy simulation. The propeller used for the test cases is the INSEAN E779A propeller, for which an extensive database of experimental data is available for open-water conditions (Felli et al. Reference Felli, Camussi and Di Felice2011). We investigated the wake structure for three loading conditions, characterized by an advance ratio  $J = 0.525$,
 $0.60$ and
 $0.71$, with the propeller operating in unbounded flow. Then, we simulated the same loading conditions in the presence of a free surface and compared the results in terms of the
 $Q$-criterion (Hunt et al. Reference Hunt, Wray and Moin1988) and vorticity; we employed spectral analysis in conjunction with harmonic analysis in order to highlight the most relevant aspects of the flow under investigation.
The simulations in open water were able to reproduce the vortex pairing mechanisms observed by experimental measures in Felli et al. (Reference Felli, Camussi and Di Felice2011) and by numerical simulations carried out in the relative rotating frame reported in Muscari et al. (Reference Muscari, Di Mascio and Verzicco2013). Here we repeated the simulations in open water in the absolute reference frame to remove all the uncertainty and doubts derived from using different numerical set-ups.
The numerical simulations showed that the presence of the free surface radically changes the wake structure in an all but obvious way. There are two concurrent mechanisms, one having a stabilizing effect and the other being destabilizing. The first stabilizing mechanism is related to the presence of the free surface, which forces the velocity in the proximity of the slipstream to higher values than those observed for the analogous loading condition in open water. The higher velocity is equivalent to a higher propeller pitch (lower loading conditions), and therefore it tends to delay the inception of vortex pairing.
Instead, the second mechanism is related to the axial symmetry loss caused by the presence of the free surface. This effect produces a substantial variation of the blade's local incidence, which causes varying loading conditions for the single blade. We can interpret the varying condition as a circulation change with the angular position, with a consequent variation of the circulation alongside the tip vortices and the shedding of vorticity at the blade's trailing edge. The varying circulation induces a wavy velocity field in the surrounding flow; this, in turn, perturbs the vortex tubes and can lead to vortex breakdown before triggering the vortex pairing process observed in open-water conditions.
The simulations revealed that the first stabilizing mechanism prevails for mild loading conditions, whereas the second dominates when the blade loading increases. In particular, when the loading is high enough, vortex breakdown can completely overshadow vortex pairing.
Another peculiar aspect shown by the simulation is the variation of the blade loading close to the uppermost vertical position, with the maximum thrust observed for the blade approaching the free boundary and the minimum for the blade moving away from it. The transition from the maximum to the minimum is rather abrupt, with a likewise sudden change of the circulation and the local tip vortex pitch; the observation of the tip vortex tubes close to the surface confirms this deduction, at least for the higher loading.
Subsequent research will investigate higher loading conditions with a two-phase flow model. The liquid phase can entrap air when the load increases, with vortex structures and the free surface tightly intertwined. For these conditions, the water–air interface cuts the tip vortices that intersect it, and air can play a significant role in the wake dynamics, particularly when the gas-phase volume becomes relevant.
Another aspect worth investigating is the effect of cavitation on the pairing process and the global wake structure compared with single-phase flow. Also, we will investigate this aspect in future activities.
Declaration of interests
The authors report no conflict of interest.


 Open access

