Introduction
Biodiversity loss is one of the most urgent challenges facing humanity today (Turvey et al. Reference Turvey, Walsh, Hansford, Crees, Bielby and Duncan2019). This crisis coincides with the problem of climate change caused by anthropogenic activities, which is also a major concern (Sesana et al. Reference Sesana, Gagnon, Ciantelli, Cassar and Hughes2021). However, solutions that target one problem may inadvertently affect the other. For instance, the establishment of renewable energy complexes, such as wind farms, can have a negative impact on biodiversity (Fox and Petersen Reference Fox and Petersen2019). Wind farms can affect bird populations in a number of ways: they can act as barriers to migration, displace birds from optimal feeding areas, and increase the risk of collision mortality. The cumulative effect of maritime traffic and wind turbine operation is also a significant threat (Garthe et al. Reference Garthe, Schwemmer, Peschko, Markones, Müller and Schwemmer2023).
Recent studies highlight the importance of detailed monitoring and modelling to better understand and mitigate the impacts of offshore wind farms (OWFs), with particular focus on survey design to detect seabird displacement (Glasson et al. Reference Glasson, Durning, Welch and Olorundami2022; Hall and Black Reference Hall and Black2024). Studies have also examined operations and maintenance processes (Joschko et al. Reference Joschko, Widok, Appel, Greiner, Albers and Page2015) and bird collision risks, providing valuable insights into modelling and data requirements (Furness et al. Reference Furness, Garthe, Trinder, Matthiopoulos, Wanless and Jeglinski2018; Masden et al. Reference Masden, Cook, McCluskie, Bouten, Burton and Thaxter2021). Taken together, these findings highlight the need for comprehensive, data-driven approaches that are consistent with the objectives of our study.
The Baltic Sea, especially its southern and central parts, has long been recognised as an important wintering area for large numbers of seabirds, especially Arctic-nesting seaducks such as the Long-tailed Duck Clangula hyemalis and Velvet Scoter Melanitta fusca (Durinck et al. Reference Durinck, Skov, Jensen and Pihl1994; Nilsson Reference Nilsson1980). However, between the 1980s and the 2010s, the population of the entire community of waterbirds wintering in the Baltic Sea declined sharply (Skov et al. Reference Skov, Heinänen, Žydelis, Bellebaum, Bzoma and Dagys2011). Currently, the West Siberia/North Europe Long-tailed Duck population is estimated at 1,600,000 individuals (Hearn et al. Reference Hearn, Harrison and Cranswick2015; Wetlands International 2025), and the entire world population of Velvet Scoter is estimated at 450,075–500,100 (Dagys and Hearn Reference Dagys and Hearn2018; Wetlands International 2025). The exact causes of this decline remain unclear. Seabird bycatch in fishing gear may be a significant driver of population declines, with the Baltic Sea being one of the world’s hotspots for this threat (Žydelis et al. Reference Žydelis, Bellebaum, Österblom, Vetemaa, Schirmeister and Stipniece2009). In recent years, there has been a noticeable reduction in fishing effort (Marchowski Reference Marchowski2021), accompanied by signs of stabilisation and even recovery in the populations of key bird species (Chodkiewicz et al. Reference Chodkiewicz, Chylarecki, Sikora, Wardecki, Bobrek and Neubauer2019; Chylarecki et al. Reference Chylarecki, Chodkiewicz, Neubauer, Sikora, Meissner and Woźniak2018). Despite these improvements, the status of wintering bird populations in the Baltic Sea remains poor, as assessed by HELCOM in the latest Holas 3 project (HELCOM 2023). It is likely that additional factors affecting birds in the Baltic Sea have also contributed to the overall decline in numbers. These may include mortality from oil spills, hunting, and human-induced eutrophication, which affects the structure and function of food webs (HELCOM 2023). Climate change also plays an important role, as it is responsible for shifting bird ranges (Nilsson and Haas Reference Nilsson and Haas2016; Pavón-Jordán et al. Reference Pavón-Jordán, Fox, Clausen, Dagys, Deceuninck and Devos2015, Reference Pavón-Jordán, Clausen, Dagys, Devos, Encarnaçao and Fox2019). Also, increased predation pressure on the breeding grounds, caused by climate change, has been suggested to negatively affect the Long-tailed Duck population (Rintala et al. Reference Rintala, Hario, Laursen and Møller2022).
In this paper, we analyse the potential impacts of the development of the OWF industry on bird populations in the southern and central Baltic Sea, an important area for wintering populations of Long-tailed Duck and Velvet Scoter (Skov et al. Reference Skov, Heinänen, Žydelis, Bellebaum, Bzoma and Dagys2011). Specifically, we investigated the number and distribution of birds during the winter of 2020 within the Polish Exclusive Economic Zone (PEEZ) and adjacent parts of the Swedish Exclusive Economic Zone, including the Northern and Southern Middle Banks. The main research questions were: Do the proposed wind farms overlap with seabirds’ winter habitats, and if so, to what extent? In addition, do the proposed OWFs overlap with Natura 2000 sites and Important Bird and Biodiversity Areas (IBAs), and if so, to what extent?
For the above aims, we reviewed documentation from the Polish Ministry of Infrastructure on permits issued for OWFs. Based on this, we created a sensitivity map to identify potential areas of conflict between the wind farm industry and conservation goals for seabird populations. Unlike traditional methods, our approach took into account a wider range of environmental variables and used a sophisticated statistical framework to predict bird densities in areas without direct survey data. This improves the accuracy of impact assessments and provides a more comprehensive tool for environmental planning.
This paper presents an innovative methodological approach using machine learning for spatial analysis, as a case study of the Baltic Sea region in 2020. This method can be adapted for use in other maritime and terrestrial regions, providing a template for similar environmental impact assessments.
Methods
Geographical scope
This study focused on the PEEZ in the Baltic Sea. Data sets from both the Polish and, to a lesser extent, the Swedish Exclusive Economic Zones were used to assess bird numbers and densities within this area. The Southern Middle Bank and Northern Middle Bank, located in the central Baltic Sea, are collectively recognised as one of the main overwintering areas for the Long-tailed Duck (Skov et al. Reference Skov, Heinänen, Žydelis, Bellebaum, Bzoma and Dagys2011). To emphasise the importance of this region for the species, this study presents bird abundance results for both Middle Banks, with the Southern Middle Bank divided into Polish and Swedish jurisdictions (Figure 1).
Study area within Polish and Swedish Exclusive Economic Zones of the Baltic Sea with planned offshore wind farms (OWFs) (https://sipam.gov.pl/zasoby-gis/dane-gis/; accessed 4 April 2024 (Polish Ministry of Infrastructure 2024).

Field surveys and estimation of seabird abundance
The assessment of seabird abundance focused on the winter season. Following established survey protocols, field counts were predominantly conducted in January 2020 (Robertson and Cooke Reference Robertson and Cooke1999). Systematic surveys employed the distance sampling method, a robust statistical framework designed to estimate the population density and abundance of biological populations (Buckland et al. Reference Buckland, Rexstad, Marques and Oedekoven2015). This method aligns with standards for marine seabird population assessments (Komdeur et al. Reference Komdeur, Bertelsen and Cracknell1992) and adheres to shore-based bird count guidelines set by the International Waterbird Census (Wetlands International 2010).
The surveys involved three different approaches, each of which was carried out once in January 2020. Aerial transect surveys were conducted over the Southern Middle Bank and the Northern Middle Bank, while ship-based transect surveys were conducted within the PEEZ. In addition, shore-based counts were carried out along the PEEZ coastline, where an observer equipped with binoculars and a spotting scope systematically walked along the coastline and counted all seabirds observed on the water up to approximately 1 km from the shore. Each survey method was carefully planned to maximise coverage of the study area, while ensuring consistency with the distance sampling methodology (Buckland et al. Reference Buckland, Rexstad, Marques and Oedekoven2015).
To account for potential detection issues, we addressed the influence of survey platforms (ship or aircraft) on the visibility and behaviour of birds. For ship-based transects, detection of birds close to the vessel may be reduced due to disturbance, resulting in lower counts at shorter distances. This effect is accounted for in distance sampling by the detection function, which models the probability of detecting birds as a function of distance from the transect line. For aerial surveys, the area directly beneath the aircraft was excluded from analysis due to limited visibility and to prevent bias from reduced detection in this region. These adjustments ensure the robustness of the density and abundance estimates, despite potential platform-specific biases (Buckland et al. Reference Buckland, Rexstad, Marques and Oedekoven2015).
Data collection
Data were obtained from two main sources: offshore and coastal surveys. Offshore surveys were carried out from a ship along 56 pre-defined transects ranging in length from 3.89 km to 28.65 km (Polish data, available at: https://monitoringptakow.gios.gov.pl/PM-GIS/), and aircraft surveys on 15 transects in the Southern and Northern Middle Banks (Swedish data – the Swedish Bird Survey, obtained from: https://www.fageltaxering.lu.se/) in 2020. These transects were designed to cover important seabird foraging habitats. The transect survey as well as the distance sampling followed the guidelines presented in HELCOM (Reference HELCOM2021).
The data collected in this way covered 15 bird species; these were diving birds divided into two morpho-ecological groups, i.e. benthos-eaters and fish-eaters. The most numerous species belonged to the benthos-eaters, mainly seaducks (Mergini), which represented 97% of the total group of birds wintering in this area (Chodkiewicz et al. Reference Chodkiewicz, Chylarecki, Sikora, Wardecki, Bobrek and Neubauer2019). The most abundant of these were the Long-tailed Duck and Velvet Scoter, which together make up 75% of the entire seabird community (Marchowski Reference Marchowski2024).
In total, data from 15 seabird species were collected. Within the study area, the most numerous – and by far the most influential – species were the Long‑tailed Duck and Velvet Scoter, which are also dominant in the regions earmarked for OWFs investment plans. In addition, the Black Guillemot Cepphus grylle, a species known to be particularly vulnerable to displacement by OWFs (Furness et al. Reference Furness, Wade and Masden2013), was analysed separately in most sub‑areas.
In two specific sub‑areas, however, all seabird species were grouped together for analysis. In these cases, the dominant species within the combined group were the Long‑tailed Duck and Velvet Scoter.
The spatial analysis presented in this paper estimates seabird abundances based on different species groupings that vary by sub-area. In most sub-areas, the populations of Long-tailed Duck, Velvet Scoter, and Black Guillemot are treated as separate categories. The remaining species are combined into an “other species” group, which primarily includes Black-throated Diver Gavia arctica, Red-throated Diver Gavia stellata, Slavonian Grebe Podiceps auritus, Red-necked Grebe Podiceps grisegena, Common Scoter Melanitta nigra, Razorbill Alca torda, and Common Murre Uria aalge, as well as several species typically associated with lagoon habitats, such as Greater Scaup Aythya marila, Tufted Duck Aythya fuligula, Common Pochard Aythya ferina, Goosander Mergus merganser, and Smew Mergellus albellus (Wardecki et al. Reference Wardecki, Chodkiewicz, Beuch, Smyk, Sikora and Neubauer2021).
Ethical considerations and permissions
All field surveys were conducted in accordance with ethical guidelines for wildlife research and with the permission of the relevant local and national wildlife authorities. Efforts were made to minimise disturbance to seabird populations and their habitats during the survey periods.
Statistical analysis
The collected data were statistically analysed using distance sampling, with a focus on evaluating key parametric functions such as uniform, half-normal, and hazard rate models. The best-fitting function was selected based on the smallest Akaike information criterion (AIC) values, among other model selection criteria such as the outcomes of goodness‑of‑fit tests (e.g. chi‑squared tests), as well as visual inspection of detection function plots (Burnham and Anderson Reference Burnham and Anderson2004). The analytical process was conducted using the Distance package in the R programming environment (Miller et al. Reference Miller, Rexstad, Thomas, Marshall and Laake2019), which is specifically designed for analysing distance-sampling data. The statistical analysis aimed to provide an accurate estimate of seabird density and abundance, taking into account detectability issues and incorporating habitat variability across the study area. Bird density estimates were based on the selection of species-specific models.
Estimates of bird abundance were made for individual sub-areas of the study area: Szczecin Lagoon, Pomeranian Bay, Central Polish Waters, Słupsk Bank, Gulf of Gdańsk, Vistula Lagoon, Southern Middle Bank, and Northern Middle Bank (Figure 1). Spatial densities were then visualised by calculating bird densities using distance sampling at a resolution of 20 × 20 km. The mean depth and distance from the shore were measured from the geometric centre for all squares, both with and without transects. Random Forest modelling was then applied in the R environment using the randomForest package version 4.7-1.2 to estimate predicted bird densities in quadrats without transects (Liaw and Wiener Reference Liaw and Wiener2002). The square grid mentioned above, superimposed on the study area, contained 98 20 × 20 km squares, of which 53 (54%) had density data.
To estimate densities, bird data were first split into training and test data sets, the latter specifically for quadrats without transect counts. The model was then trained on actual densities, depth, and distance from the shore variables to predict bird densities in missing quadrats (Akinyelu and Adewumi Reference Akinyelu and Adewumi2014). This methodological approach allowed the estimation of bird numbers in unobserved areas, using the model’s variable importance metrics and root mean square error (RMSE) to assess performance, thereby improving our understanding of spatial distribution patterns in the study regions (Liaw and Wiener Reference Liaw and Wiener2002).
The values predicted by the model were then interpolated on to a map of the area using the Inverse Distance Weighting (IDW) method (Bartier and Keller Reference Bartier and Keller1996; Watson Reference Watson1992) in QGIS ver. 3.28.9. IDW estimates values at unknown locations by averaging the values of nearby points, with closer points having greater influence than those further away. This approach was used to visualise the spatial distribution and density of seabirds in the area.
Wind farms and birds overlap areas
To explore the overlap of OWF development on the Baltic Sea ecosystems, we conducted a spatial analysis using QGIS v. 3.28.9. The analysis focused on calculating the percentage of area occupied by wind farms within a selected Baltic Sea square with a real area of approximately 400 km² (20 × 20 km), the same as described above used for the Random Forest analysis. Here the ETRS89/Poland CS92 (EPSG:2180) coordinate system was used.
A polygon layer showing wind farms was obtained from the website of the Polish Ministry of Infrastructure (https://sipam.gov.pl/zasoby-gis/dane-gis/; accessed 4 April 2024). The polygons show areas where permits have been given to establish wind farms, not the exact locations where individual wind turbines are planned to be constructed. This layer together with the research square grid (20 × 20 km) were then imported into QGIS.
To determine the proportion of wind farm areas within specific sections of the study area, a GIS-based intersection analysis was conducted. First, the Intersect tool from the Geoprocessing Tools menu was used to overlay the wind farm layer on to a square grid layer, where each square covered an area of 400 km². This operation resulted in a new layer containing only the portions of wind farms that fell within the boundaries of individual grid squares.
Next, the area of each wind farm fragment within a square was calculated in square kilometres using the Field Calculator tool. These calculated areas were then summed separately for each grid cell to determine the total wind farm area within that specific square. Finally, the total wind farm area within each grid cell was divided by the total area of the square (400 km²) to compute the percentage of land occupied by wind farms in each section of the grid. This allowed for an assessment of the spatial distribution and intensity of wind farm coverage across the study area.
To integrate wind farm data with bird abundance for mapping sensitivity areas, we first scaled the percentage of wind farm coverage to a 0–10 scale, aligning it with the logarithmically transformed bird abundance scale. This standardised scale facilitates direct comparison and integration of both data sets. Subsequently, we performed a spatial analysis using QGIS software to overlay wind farm coverage on to bird abundance areas. By multiplying the adjusted wind farm coverage by bird abundance values, we could identify and visualise areas of high sensitivity, where significant bird populations coincide with extensive wind farm developments. The multiplied values were interpolated on to the map of the area using the IDW method (Bartier and Keller Reference Bartier and Keller1996; Watson Reference Watson1992) in QGIS ver. 3.28.9.
In addition, for each proposed wind farm, key variables relevant to avian habitat requirements, i.e. depth and proximity to the coastline, were identified. Unlike the abundance grid, these variables specifically pertain to designated wind farm areas and are used in a separate analysis to assess their potential alignment with bird habitat preferences. Depth measurements were obtained from bathymetric data available in the CBDG GIS database (https://baza.pgi.gov.pl/geoportal/uslugi/gis; accessed 4 August 2024), which provided the depth ranges for each designated area. For the proximity variable, the shortest distance from shore to the nearest point of the wind farm polygon was calculated using the QGIS distance measurement tool.
The data available on the Ministry of Infrastructure website sometimes lacked information on the capacity of the planned wind farm and number of turbines (Polish Ministry of Infrastructure 2024). To estimate the missing values for the power capacity (MW) of planned OWFs and the corresponding number of turbines, predictive models were used based on the available data in the data set. A linear regression model was developed to infer the power capacity from the area of each wind farm. This approach is based on the assumption of a proportional relationship between the area of the farm and its potential power output. Similarly, a separate linear regression model was constructed to predict the number of turbines, using power capacity as the independent variable. These models were applied only to the data sets with missing entries, providing a systematic method of approximating the unrecorded data (4 missing values for the number of turbines and 16 missing values for the predicted power). The calculated values were then added to the data set to complete the analysis. This methodology provided a comprehensive assessment of the wind farm characteristics, which was essential for the subsequent environmental impact analysis.
Normalised Overlap Index
To evaluate the prospective overlap of wind farms with avian populations, the area encompassed by varying predicted bird densities (by IDW method – see above) within each planned wind farm’s boundaries was calculated. Spatial modelling assigned these densities to exponentially weighted categories. The lowest category signified an absence of birds (weight = 0), and subsequent categories reflected increasing densities with weights growing exponentially from 2^1 to 2^7 for the highest density. This assignment of weights allowed for a non-linear escalation in the evaluation of overlap corresponding to higher bird densities. The weighted density (WD) was thus computed using the formula:
 $$ WD={\sum}_{i=0}^7\left({w}_i\ast {p}_i\right) $$
where wi is the exponential weight for the i-th bird density category starting with 0 for no birds and increasing exponentially thereafter, and pi is the percentage coverage of the i-th category within the wind farm area.
This formula calculates the sum of the product of each bird density category weight and its corresponding area percentage within the wind farm, with the sum encompassing all bird density categories. The overlap index, referred to as the Normalised Overlap Index (NOI), was derived by multiplying the WD by the farm’s area (a), providing a size-normalised overlap index. To ensure comparability, the results were expressed on a 0–100 scale, and the NOI was calculated using the following formula:
 $$ NOI=\left(\frac{WD\ast a}{\mathit{\max}\left( WD\ast a\right)}\right)\ast 100 $$
This normalisation allows for the standardised interpretation of the overlap index, where 0 represents no overlap and 100 represents the maximum predicted overlap.
Overlap of planned wind farms with protected areas
The Natura 2000 network layer (https://natura2000.eea.europa.eu/; accessed 4 December 2024) was used to assess whether the designated areas for proposed OWF overlapped with protected areas. In addition, data on IBAs were obtained from the BirdLife International database (BirdLife International 2025). IBAs are globally recognised sites identified using scientific criteria based on the proportion of a species’ population occurring in a given area (Donald et al. Reference Donald, Fishpool, Ajagbe, Bennun, Bunting and Burfield2019). In Poland, marine IBAs were delineated using available scientific data as described in Wilk et al. (Reference Wilk, Jujka, Krogulec and Chylarecki2010). For Sweden, data were obtained from BirdLife International (2025), specifically the IBA factsheet for the Southern Midsjö Bank. An analysis was then carried out using QGIS version 3.28.9 to determine the extent of overlap between the proposed OWF sites and areas of importance for bird conservation.
Results
Seabirds
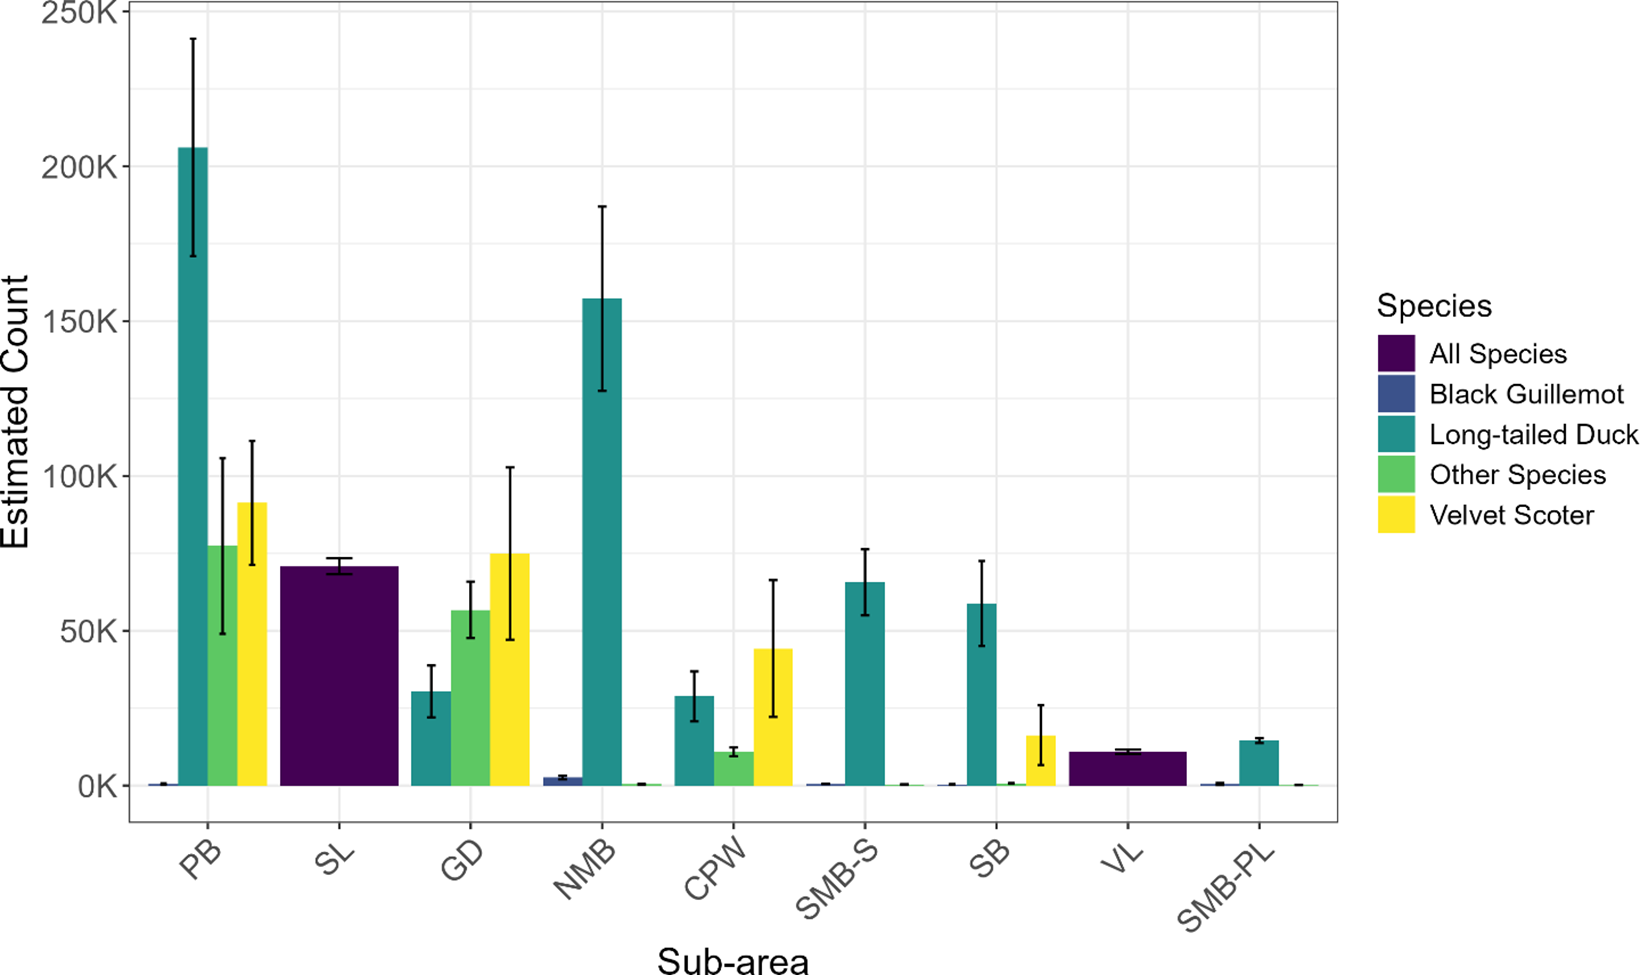
In the winter of 2020, an estimated 1,021,748 seabird individuals were present in the study area. The most abundant species was the Long-tailed Duck with a total estimated population of 561,511, followed by the Velvet Scoter with 226,756 individuals. The Black Guillemot reached a population of 4,467 individuals (Figure 2 and Supplementary material Table S1). It was estimated that 35% of the biogeographical population of the Long-tailed Duck was present in the study area during the winter of 2020. For the Velvet Scoter, 41% of the global population of this species was found in the study area while 8% of the Black Guillemot Baltic population was present in the study area in 2020 (Wetlands International 2024).
Estimated numbers of the studied species in the southern and central Baltic Sea in winter 2020 with standard errors. PB = Pomerania Bay, SL = Szczecin Lagoon, GD = Gulf of Gdańsk, NMB = Northern Middle Bank, CPW = Central Polish Waters, SMB-S = Swedish side of the Southern Middle Bank, SB = Słupsk Bank, VL = Vistula Lagoon, SMB-PL = Polish side of the Southern Middle Bank.

In 2020, the distribution of birds across the study area was uneven, with the highest densities recorded in Pomeranian Bay (Figure 2 and Table S1). High densities were also observed in the Middle Banks as well as in the Gulf of Gdańsk and the Słupsk Bank sub-areas (Figure 3).
Density and distribution of seabirds in the southern and central Baltic Sea in the winter of 2020 together with the planned offshore wind farm (OWF) areas and Important Bird and Biodiversity Areas (IBAs) of international importance.

Offshore wind farms
A total of 21 OWF permits have been issued in the PEEZ (as of 4 April 2024), covering an area of 2,095 km². The estimated number of wind turbines is 1,164, with a total planned capacity of 17.6 GW. The largest planned OWF is located near the Słupsk Bank, with a capacity of 1,500 MW and 100 turbines covering an area of 190 km², situated 32 km from the Polish coastline (Table 1).
Planned offshore wind farms (OWFs) in the Polish Exclusive Economic Zone (PEET), current issued building permits, as of 4 April 2024. Cap. (MW) and no. turbines = total planned capacity in megawatts of the OWF and number of turbines; NOI = Normalised Overlap Index values; Area km² = area that the OWF will occupy; Depth range (m) = water depth of range within the area of the planned OWF; Dist. to shore (km) = distance to the shore; the name of the investor and coordinates of the central point of the planned OWF are also provided

* Estimated value predicted in the model
** EW Elektrownia Wiatrowa (OWF) PGE Group (Polish Energy Group).
The regions with the highest overlap between OWFs and bird densities were identified as the Pomeranian Bay and Southern Middle Bank (Figures 3 and 4). The highest NOI was calculated for farm #20 situated in the Pomeranian Bay, with a value of 100 (Table 1). A high degree of overlap was also calculated in the Southern Middle Bank, where planned OWFs #6 and #10 have an NOI of 81.30 and 81.20, respectively (Table 1). In contrast, the lowest overlap value 0.00 was estimated for farm #15 (Table 1 and Figure 4). Areas of lower conflict were observed within the Słupsk Bank region (Figures 3 and 4).
Sensitivity map, areas of potential conflict between the planned offshore wind farms (OWFs) in the southern Baltic Sea in the Polish Exclusive Economic Zone (PEET) and the density of wintering seabirds, according to the density from the 2020 winter season.

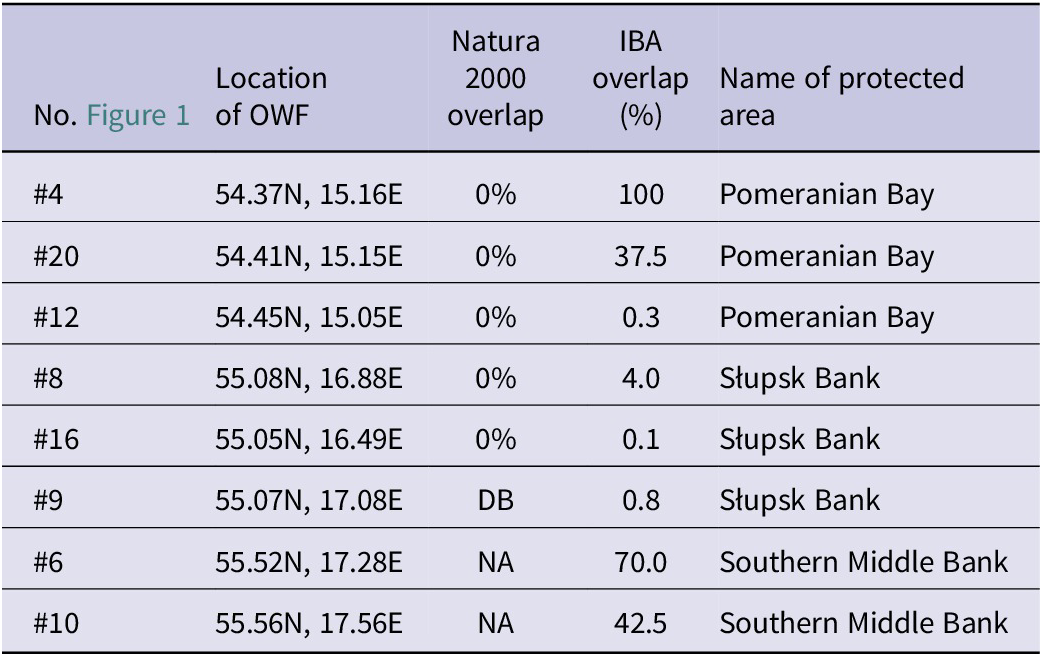
In the context of the Natura 2000 network, none of the planned wind farms overlap with protected areas, with one exception: the boundary of planned wind farm #9 coincides with the boundary of the Słupsk Bank Natura 2000 site. Regarding the IBA network, farm #4, although very small with only one estimated wind turbine, covers 100% of an IBA. Among the larger farms, notable overlaps include farm #6 with 70% of its area within the Southern Middle Bank IBA, farm #10 with 43% overlap with the Southern Middle Bank IBA, and farm #20 in the Pomeranian Bay with 38% overlap with an IBA.
Discussion
Seabirds
The results of this study underline the ecological importance of the PEEZ and the central Baltic Sea as a critical wintering area for seabirds, in particular the Long-tailed Duck and Velvet Scoter. Over a million seabirds were observed in winter 2020, with the Long-tailed Duck and Velvet Scoter accounting for significant proportions of their respective populations. Long-tailed Duck represented 35% of its biogeographical population, while Velvet Scoter contributed 41% of its global population (Wetlands International 2024). Black Guillemot, although less numerous, accounted for 8% of its Baltic population. This highlights the role of the area in supporting vulnerable seabird populations during the critical winter period (Durinck et al. Reference Durinck, Skov, Jensen and Pihl1994; Skov et al. Reference Skov, Heinänen, Žydelis, Bellebaum, Bzoma and Dagys2011).
The spatial distribution of these species shows their different habitat preferences. Long-tailed Duck was the most prevalent in marine areas, except in brackish lagoons, while Velvet Scoter favoured coastal areas, including the Central Polish Waters and the Gulf of Gdańsk, but was absent from the central Baltic Sea. Black Guillemot, an offshore species, was concentrated on the Northern Middle Bank, with smaller populations on the Southern Middle Bank and Pomeranian Bay. The different habitat preferences among these three species underscore the importance of diverse habitats within the PEEZ (Figure 2 and Table S1).
The results of this study emphasise the need for targeted conservation measures. For Velvet Scoter, a globally “Vulnerable” species according to the International Union for Conservation of Nature (IUCN) (BirdLife International 2020), the presence of 45–50% of its global population (Dagys and Hearn Reference Dagys and Hearn2018) in the study area highlights its vulnerability to threats specific to this region. Recent trends suggest that the rate of population decline has decreased (N. Markones in litt. 2023), possibly due to reduced bycatch in gillnets (Marchowski Reference Marchowski2021). However, on-going habitat pressures and emerging threats, such as OWFs could jeopardise this progress. Similarly, long-term population trends of Long-tailed Duck and Black Guillemot remain of concern and warrant continued monitoring and adaptive conservation strategies (Chodkiewicz et al. Reference Chodkiewicz, Chylarecki, Sikora, Wardecki, Bobrek and Neubauer2019; Skov et al. Reference Skov, Heinänen, Žydelis, Bellebaum, Bzoma and Dagys2011; Wetlands International 2024).
Considering that the approach presented in this paper serves as a methodological example for an initial analysis of threats to seabirds, it is important to emphasise that the next step should involve a deeper analysis focused on priority species, such as the Velvet Scoter, whose global population survival is highly dependent on the areas studied in this paper (BirdLife International 2020; Chodkiewicz et al. Reference Chodkiewicz, Chylarecki, Sikora, Wardecki, Bobrek and Neubauer2019). Further research should address additional threats, particularly bycatch in fishing nets, which is a major pressure in the study area (Marchowski Reference Marchowski2021; Marchowski et al. Reference Marchowski, Jankowiak, Ławicki, Wysocki and Chylarecki2020).
Offshore wind farms
The development of OWFs in the PEEZ, with a planned capacity of almost 18 GW (Polish Ministry of Infrastructure 2024), presents both opportunities and challenges. While contributing to renewable energy goals, these developments overlap with key seabird habitats, as identified in this paper.
Despite technological advances allowing the installation of larger turbines in deeper waters (Díaz and Guedes Soares Reference Díaz and Guedes Soares2020), the environmental impacts of such developments remain poorly understood (Bailey et al. Reference Bailey, Brookes and Thompson2014). While some studies have assessed the sensitivity of various species to displacement and collision risks (Desholm and Kahlert Reference Desholm and Kahlert2005; Kelsey et al. Reference Kelsey, Felis, Czapanskiy, Pereksta and Adams2018; Lamb et al. Reference Lamb, Gulka, Adams, Cook and Williams2024; Peschko et al. Reference Peschko, Mendel, Müller, Markones, Mercker and Garthe2020), there is a notable gap in understanding the wider ecological consequences of OWFs. Specifically, the long-term effects of these installations on population dynamics and ecosystem health remain underexplored (Bailey et al. Reference Bailey, Brookes and Thompson2014).
It is important to identify areas that may be affected by wind farms and to understand the links between key populations and the development sites. Impacts need to be assessed in the context of their significance at the population level to establish their biological significance (Allison et al. Reference Allison, Jedrey and Perkins2008; Bailey et al. Reference Bailey, Brookes and Thompson2014).
Our analysis shows significant overlaps between planned OWFs and IBAs, including the Southern Middle Bank and Pomeranian Bay. Notably, OWF #20 overlaps 38% of an IBA in Pomeranian Bay, while OWFs #6 and #10 overlap 70% and 43% with the Southern Middle Bank IBA, respectively (Table 2). However, the impact of these wind farms may be less, as we have used the entire area for which a permit for OWFs has been given, not the exact locations of the wind turbine development. In addition, for wind farm #9, its boundary adjacent to the Natura 2000 site has been shifted, moving approximately 16.5 km² from the power plant development area (SMDI 2015). Furthermore, 4 km-wide corridors are planned between the largest wind farms, which also helps reduce the overlap index to some extent. Nevertheless, the high NOI values of these sites may indicate significant potential conflicts (Table 1).
Percentage coverage of protected areas and planned offshore wind farms (OWFs) in the Polish Exclusive Economic Zone (PEET). IBA = Important Bird and Biodiversity Area; NA = if there is no protected area of a given type established in this place; DB = direct borders, when the border of the planned OWF is also the border of the protected area
The methodology employed in this study, including the generation of sensitivity maps and the calculation of NOI, provides a robust framework for evaluating OWF overlap and seabird activity as a first step in assessing their impact on a population level. By integrating seabird density data with spatial planning tools, the study identifies high-risk areas where conservation efforts should be prioritised. The sensitivity maps reveal that some planned OWFs are located adjacent to, or within, critical habitats, raising concerns about habitat displacement and collision risks (Furness et al. Reference Furness, Garthe, Trinder, Matthiopoulos, Wanless and Jeglinski2018; Masden et al. Reference Masden, Cook, McCluskie, Bouten, Burton and Thaxter2021).
A comparison with Danish OWFs highlights key differences in site selection and potential impacts. Danish OWFs are typically located in shallower waters (average depth 5 m) compared with the PEEZ (average depth 39 m) (Fox and Petersen Reference Fox and Petersen2019), primarily because Denmark started establishing OWFs at an early stage when available technology and economic feasibility favoured construction in shallower waters. This disparity reflects differences in ecological settings and planning strategies, emphasising the need for context-specific approaches to OWF development. In the PEEZ, the exclusion of shallow areas, which are often protected under the Natura 2000 network, has shifted OWF development to deeper locations. While this reduces direct conflicts with protected areas, it increases the risk of impacts on adjacent IBAs and other critical habitats.
Implications for conservation and renewable energy development
Large areas occupied by OWFs can act as barriers to bird movement, as waterfowl tend to avoid turbines within a range of 100 m to 10,000 m in response to offshore infrastructure development (Christensen et al. Reference Christensen, Hounisen, Clausager and Petersen2004; Furness et al. Reference Furness, Wade and Masden2013; Garthe et al. Reference Garthe, Schwemmer, Peschko, Markones, Müller and Schwemmer2023; Petterson Reference Pettersson2005). This avoidance significantly reduces seabird densities around wind farms (Lamb et al. Reference Lamb, Gulka, Adams, Cook and Williams2024). However, some species not covered in this analysis, such as cormorants and gulls, may exhibit attraction to wind farms due to their use of structures for roosting, drying plumage or increased food availability (Dierschke et al. Reference Dierschke, Furness and Garthe2016).
However, seabird species vary considerably in their sensitivity to OWFs. The Black Guillemot is particularly sensitive to displacement caused by wind farms, while Long-tailed Duck and Velvet Scoter are slightly less sensitive (Furness et al. Reference Furness, Wade and Masden2013). Therefore, assessments of impact of OWFs should not only consider seabirds as a whole, but focus should also be on species with high sensitivity.
Balancing renewable energy development with biodiversity conservation is inherently complex and challenging. This study highlights the high densities of seabirds in areas designated for OWF development, highlighting the critical need for integrated planning approaches (Dickinson et al. Reference Dickinson, Rutherford and Gunton2010). Incorporating sensitivity maps into environmental decision-making processes can mitigate conflicts and guide sustainable OWF development (Bradbury et al. Reference Bradbury, Trinder, Furness, Banks, Caldow and McDonald2017; Trinder et al. Reference Trinder, O’Brien and Deimel2024).
One limitation of this study is its reliance on bird survey data from a single winter season. While the 2020 data provide valuable insights, longer-term data sets would increase the reliability of impact assessments and inform adaptive management strategies. The single survey in January 2020 only captures a snapshot of bird distribution during a limited part of the annual cycle. This approach is insufficient to represent the full range of seabird presence throughout the year, including critical periods such as autumn and spring migration or moulting (Mendel et al. Reference Mendel, Sonntag, Wahl, Schwemmer, Dries and Guse2008), and fails to account for inter-annual variation. However, previous long-term studies (Chylarecki et al. Reference Chylarecki, Chodkiewicz, Neubauer, Sikora, Meissner and Woźniak2018; Chodkiewicz et al. Reference Chodkiewicz, Chylarecki, Sikora, Wardecki, Bobrek and Neubauer2019; Durinck et al. Reference Durinck, Skov, Jensen and Pihl1994; Skov et al. Reference Skov, Heinänen, Žydelis, Bellebaum, Bzoma and Dagys2011) indicate that distribution of wintering bird is generally consistent and in line with the results presented here. Nevertheless, a multi-year average would provide a more robust basis for determining areas where high biological values overlap with OWFs.
Furthermore, this study should be seen as a methodological template for similar research in the Baltic Sea and comparable areas. It is not intended to assess the direct impacts or risks of OWFs on seabirds, such as mortality, displacement or habitat loss, but rather serves as a first step towards more detailed investigations (Dias et al. Reference Dias, Martin, Pearmain, Burfield, Small and Phillips2019).
The methodological framework developed here also has broader applications beyond the Baltic Sea. Sensitivity mapping and NOI calculations can be adapted to other marine and terrestrial environments facing similar conservation challenges. This study proposes a preliminary assessment of potential risks at a large population scale prior to construction, which could serve as a guideline for planning the development of maritime areas.
Such an approach is innovative and not widely adopted, as assessments are typically conducted for individual wind farms (Pérez-Lapeña et al. Reference Pérez Lapeña, Wijnberg, Hulscher and Stein2010). While single wind farms may have a limited impact on bird populations, the cumulative effect of multiple farms near bird habitats can be substantial, as demonstrated in this paper.
Conclusions
The findings of this study underline the ecological significance of the PEEZ (southern and central Baltic Sea) as a wintering area for seabirds and highlight the potential conflicts arising from OWF development (Figure 4). This potential threat arises despite the assumption that decision-making processes in Poland intentionally exclude the most ecologically valuable areas for birds, such as those designated under the Natura 2000 network.
This highlights the unique role of the Baltic Sea as one of the most important wintering areas for Arctic-breeding seabirds worldwide (Durinck et al. Reference Durinck, Skov, Jensen and Pihl1994). The significance of the Baltic Sea lies in its shallow waters, allowing diving birds to use extensive offshore areas rather than being confined to coastal zones, as is typical in other marine environments (Skov et al. Reference Skov, Heinänen, Žydelis, Bellebaum, Bzoma and Dagys2011). These shallow waters also hold substantial value for the OWF industry, as constructing turbines in shallow areas remains more cost-effective despite advances in technology enabling development in deeper waters (Díaz et al. Reference Díaz and Guedes Soares2020). This inherent overlap creates a source of conflict. It may be wise to consider the pre-emptive exclusion of certain areas of the Baltic Sea from OWF development in order to mitigate potential environmental impacts.
As the number and size of OWFs built and planned increases, so does the need to consider the population-level and cumulative impacts of these activities on marine species on a larger scale. Therefore, strategic data collection and modelling targeted at issues related to the permitting process will allow decisions to be made based on the best available information (Dias et al. Reference Dias, Martin, Pearmain, Burfield, Small and Phillips2019).
The sensitivity maps and NOI framework developed here provide valuable tools for assessing and mitigating the impacts of the OWF industry, thereby supporting the sustainable expansion of renewable energy. By integrating scientific data into planning processes, this study provides a way to balance energy development with biodiversity conservation, ensuring the long-term preservation of critical habitats and the species they support. Finding the right balance between renewable energy development and environmental compliance is essential.
Acknowledgements
We thank all field ornithologists in Poland and Sweden whose dedicated work made the data analysed in this article possible. In Poland, bird count data were collected as part of the national waterbird monitoring programme coordinated by the Chief Inspectorate of Environmental Protection (GIOS). In Sweden, data collection was carried out within the framework of the Swedish Bird Survey (Svensk Fågeltaxering), coordinated by Lund University. We are also grateful to the Joint Working Group on Birds (JWGBIRD), operating under the framework of HELCOM, OSPAR, and ICES, for initiating the international 2020 waterbird census which served as the basis for the data presented in this study.
Supplementary material
The supplementary material for this article can be found at http://doi.org/10.1017/S0959270925000097.
Authors’ contribution
D. Marchowski: writing – original draft and editing, methodology, investigation, conceptualisation, and formal analysis; F. Haas: writing – review and editing, methodology, investigation, and conceptualisation; T. Chodkiewicz: writing – review and editing, methodology, investigation, conceptualisation, coordination; W. Meissner: writing – review and editing, methodology, investigation, conceptualisation, and coordination.
Data availability statement
Data used in this article are available at: https://natura2000.eea.europa.eu/; http://datazone.birdlife.org/sowb/spotIBAs; https://baza.pgi.gov.pl/geoportal/uslugi/gis; https://sipam.gov.pl/zasoby-gis/dane-gis/; http://fageltaxering.se/; https://monitoringptakow.gios.gov.pl/PM-GIS/. Data access assistance available on request.