


Introduction
Transport of snow under the influence of wind occurs either simultaneously with precipitation or, during dry conditions, with pure blowing snow. Caused by the rough terrain, strong winds in Alpine regions show a marked eddy turbulence. Deposition patterns are predominantly determined by this complex flow. Avalanche activity has been directly related to strong winds in more than 40% of all events recorded in the Davos area (Reference Quervain and Meisterde Quervain and Meister, 1987).
Weather conditions giving rise to blowing snow are common in mountainous regions, and skiers are aware of their influence when they are following tracks drawn shortly before in an undisturbed snow field. Drift-flux measurements have been made not only in Antarctic regions (Reference Budd, Dingle, Radok and RubinBudd and others, 1966) but also in numerous other areas of flat terrain associated with drift problems. Reference SchmidtSchmidt (1986) analysed transport rates of drifting snow and pointed out their relationship to aerodynamic roughness length. Mountain observations (Reference FöhnFöhn, 1980; Reference MeisterMeister, 1987) are complicated by the bulged vertical wind-speed profile at crest lines and by small obstacles just before the traps. Snow-depth distribution could easily be measured by aerial photogrammetric techniques, but these depend on there being low snow reflectivity (contrast) which is rather rare. Microwave remote-sensing techniques to monitor avalanche-critical snow parameters have been presented by Mätzler (1987), but are still not in practical use.
Reference Föhn and MeisterFöhn and Meister (1982) showed how indirect snow-cover data may influence calculated avalanche run-out distances. The most important steps in this procedure are (1) determination of the snow-pack increment layer caused by snowfalls in the area, (2) evaluation of the maximum possible snow-slab height by the Coulomb-Mohr criterion, and (3) estimation of the most likely snow-slab area. In the present paper the first and last steps are examined in relation to mountain winds.
Mountain Wind Observations
The Davos area represents an inner Alpine mountainous region with rather reduced wind speeds. Further to the north, at the first pre-Alpine ridge crest, the mean daily wind speed exceeds a 15 m/s threshold value during 6% of all days of the year. This is documented by readings of the station at Säntis (2520 m a.s.l.). At Weissfluhjoch (2690 m a.s.l.), this threshold is reached on only 1% of all days. The Alpine wind field is influenced in a marked way by local topography and altitude. At Testa Grigia near Zermatt, for example, at an altitude of 3480 m, the mean hourly wind speed exceeds 20 m/s for 100 h of the year.
Local wind analysis for Davos
Four sites were selected for the simultaneous monitoring of wind direction and speed. Figure 1 represents a typical mountain situation with a main valley drained to the south-west and creeks with different side slopes structuring the terrain and hence determining potential avalanche starting areas.
Local map of the Davos area, with urban region cross-hatched, showing lake in the valley bottom, and position of four sites (WJ, VF, MA and DA) used for local wind analysis. Qualitative wind roses show the main wind directions.

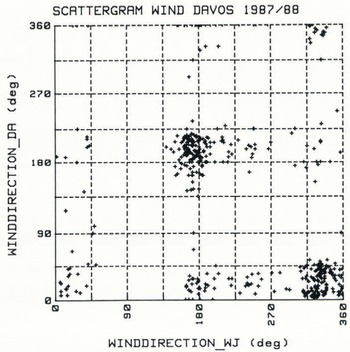
Comparison of free-field wind direction (WJ) and wind direction in valley bottom (DA). 435 × 1 hourly readings selected from data collected between January and March 1988.
The instrumentation used for the winter readings in 1987–88 was as follows:
WJ: “Weissfluhjoch”: crest position at 2693 m near the Institute. A Pitot gauge with rotatable flag, both mounted on a 10 m mast, measured peaks of 2 s gusts and 10 min means.
VF: “Versuchsfeld” (study site): plateau station at 2544 m in a small valley. A set of five anemometers, P1–P5, installed 2 m above snow surface measuring the wind-speed conditions around a small hill. P5, at the hilltop, also measured wind direction. The readings were taken during the same sequences as WJ. Daily conventional snow-cover observations were also at the user’s disposal.
MA: “Mattenwald”: sheltered forest site at 1980 m. From a cup anemometer 10 min mean wind signals were transmitted by radio over a distance of 6 km to the Institute. This wind station monitored rupture-zone conditions of a gully avalanche path of 28° steepness.
DA: “Davos”: valley station at 1560 m. Operated from an open field near Davos lake and undisturbed by buildings, the meteorological centre offers the same dataset as at crest position.
Crest readings obtained using the instruments described above yield the main wind direction and the dominant velocity features for winter conditions. Monthly mean values of 4–7 m/s are typical. As shown qualitatively in Figure 1, where sectoral wind directions and mean wind speeds were
Test area around “Versuchsfeld” (VF) near Davos. P1–P5 are positions of five cup anemometers, HS is snow-depth stick; Pluv.: pluviograph. Distribution of snow depth on 30 March 1988 is qualitatively represented, showing areas with less snow than at HS (shaded parallel to the east direction) and areas with more snow than at HS (shaded parallel to the north direction).

plotted, the local topography determines both direction and speed of wind at lower stations. A clear correlation could be found for wind direction between the peak station (WJ) and the valley plane (DA), as shown in Figure 2. The 435 hourly mean wind directions chosen randomly from 26 periods between 4 January and 10 March 1988 indicate a marked diversion of the north-west winds at the crest to the north-east in the valley ground. The other dominant wind direction is south-east at crest position, and winds blowing from that direction were frequently pressed close to the main axes of the valley, although about 25% of all observations did not conform to this pattern. With forest-site observations no specific dependence of wind direction relative to the other stations could be found.
Wind speeds at the two lower stations differ considerably from those observed at the crest. This is indicated by the low correlation coefficients shown in Table I. Only a few situations have been found in which north-east wind gusts penetrate the lightly covered larch site (MA) just below the treeline; some 300 m to the south-east three open channels are regularly filled with wind-transported snow. This indicates strong wind influence near that site and, from wind readings, gives warning of places unsuitable for walkers and skiers.
A second problem, which had also been noticed in previous winters, arises from the different time spans of the snow storms, which had different onsets and different intensities at the range of sites studied.
Wind-speed observations in the davos area (435 1 h means, randomly selected from the period 4 january 1988 to 10 march 1988). for local scale situation see figure 1
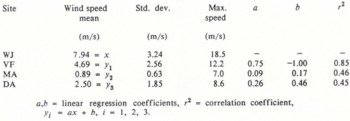
a,b = linear regression coefficients, r2 = correlation coefficient, yi = ax + b, i = 1, 2, 3.
In winter, much more than in summertime when there is relatively well-understood convectional behaviour, the valley winds are determined by barrage pressure differences, frontal air streams, precipitation patterns, and air stratifications, which together with the influence of the complex Alpine terrain lead to complex wind-field patterns.
Microscale wind field
An attempt was made in winter 1987–88 to find flow patterns around a small hill, with h = 5–10 m, just beside VF and some 500 m below the Institute. Figure 3 shows the positions of the five cup anemometers (P1–P5) relative to the hilltop. The advantage of the nearby experimental plot and the sheltered huts must be emphasized. Because of the risk of disturbance from ski pistes, P3 could not be moved further to the east and P1 was influenced, at least at the beginning of the winter, by the presence of the elongated hut. All anemometers were mounted approximately 2 m above the snow-cover surface and therefore their arrangement required periodical adjustment. One wind flag only was mounted at P5, but for the days analyzed here this disadvantage was not limiting because the 10 min means at the index wind position P5 showed representative behaviour. For gust analyses including turbulence spectra it would be of interest to be able to identify all five wind directions. Our observations show that the incoming air flow is deflected to both sides of the hill and that the effects of flow separation were more pronounced under neutral lapse rates with south-east winds than with winds from other directions, whilst shed vortices also occurred in stable-density stratification. In low wind conditions of <2 m/s the air stream tended to flow around the side of the hill and in these conditions P5 measured the lowest mean wind speed of all.
The scattergram for wind direction presented in Figure 4 indicates two main sectors which are most affected by the valley topography. The readings presented were randomly selected from data for the period from January to March 1988. Splitting the data set with respect to the two main wind sectors, some basic results can be derived for mean values and statistical indices in Table II. Speed-up on the line P1–P5–P4 is practically the same for each of the two main wind directions and P2–P3 is perpendicular to these directions. Taken as a whole, the mean ratios of the 10 min readings remain more-or-less constant in the range of 100–300 m altitude around gentle hills.
Scattergram of wind-direction and wind-speed readings at P5 (VF) with 1410 × 10 min readings randomly selected from data collected between January and March 1988.

Drift Transport
The distribution of wind-blown snow in an air stream depends essentially on wind speed, snow-surface conditions, grain-size, air temperature, and humidity. Detailed theories on drifting separate total drift rate in bed load and suspended load transport, the first containing the greater proportion of the transported mass (Reference SchmidtSchmidt, 1986). Applying the same principles as are used for river suspended sediment transport (Reference KennedyKennedy, 1988) or sand transport by winds (Reference BagnoldBagnold, 1956), the snow flux per unit width of stream may be calculated using
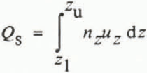
where nz is the drift density at height z above surface and uz is the corresponding horizontal wind speed. The one-dimensional diffusion equation yields

The index r is a reference height, u* is the the friction velocity, and k = 0.4 (von Karman constant).
These equations, together with a known profile of the vertical wind velocity component, would lead in a direct manner to the total transport. Problems arise with the lower integration height z1 which does not vanish near the ground for a logarithmical wind profile, and also because vs, the mean fall velocity of suspended particles, is unknown and must be estimated.
Near to the bed, mass transport occurs by creeping, rolling and saltating. The quasi-hydrostatic lift perpendicular to the mean velocity direction causes a deformation of the stream lines just above the bed layer. Small vortices are moved in a sinusoidal manner and seem to create conditions which then allow displacement of single particles. The greatest importance must be attached to the mutual contact areas between neighbouring grains, since the snow-surface conditions for drift are determined by those grains which can be moved freely without previously needing to displace their neighbours.
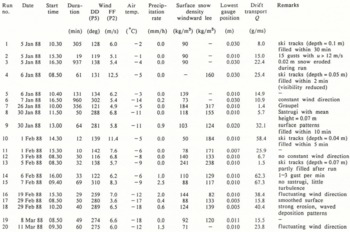
A fresh attempt was made during winter 1987–88 to clarify the situation which arises during Alpine snowstorms, in particular with respect to the significance of precipitation. During dry conditions, which at the chosen test field near Weissfluhjoch occur mostly with south-east winds, drift may be reduced to bed-load transport, suspended particles higher than 0.5 m above snow surface being rather rare. Comparison with the situation at an Alpine ridge crest (Reference Schmidt, Meister and GublerSchmidt and others, 1984) showed a bulged vertical mass-flux profile, with a maximum 0.5–1.5 m above the snow surface. Some doubts were raised about the nature of the drift density in the 0.2 m region of the drift closest to the ground. In order especially to examine these lower levels, the whole installation with masts and equipment was moved to VF to eliminate the influence of flow separation at the sharp crest. P2 (Fig. 3) offers optimal conditions for the monitoring of all wind directions and speeds. In addition to the five freely turnable Mellor rocket tubes (inlet orifice F = 100 mm2) three glass funnels (F = 26 mm2) were mounted on a small mast in order to move them down to the 10 mm level. A filter-fabric sock (F = 2400 mm2) completed the equipment. The results of 20 runs are presented in Table III.
Precipitation rate was estimated with the help of a heated precipitation gauge (Joss–Tognini type ISM), a pluviograph and of an electronic snow-depth gauge at the nearby study site. Surface-snow density readings were performed before or during the runs on the windward side, but always after the runs on the lee side. Drift transport, Q, in the lowest 5 m above the terrain was estimated by the use of the Equations (1) and (2) for each run with stepwise profile integration, the lower limit z1 chosen as z0 = roughness length, and the upper limit zu chosen as 5.0 m.
The most interesting observations made during the exposure times were:
No. 4 and 5: these storm events occurred with clear sky,
File “E” (winds from sector 45–214°, number of observations = 768)
Wind observations around a small hill at versuchsfeld (vf), davos, 2540 m a.s.l. (1410 randomly selected 10 min means recorded from january to march 1988). for topographical situation see figure 3
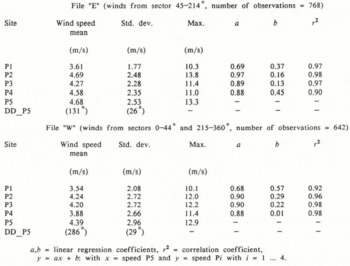
a,b = linear regression coefficients, r2 = correlation coefficient, y = ax + b: with x = speed P5 and y = speed Pi with i = 1 … 4.
Snowdrift measurements at versuchsfeld (vf) site p2, winter 1987–88
Snow-drift densities, nz, as a function of height, z, above snow surface: (a) south-east winds without precipitation, (b) north-west winds with mean precipitation rate of 2.5 mm/h.

and erosion was as pronounced as at the test site (loss of 0.15 m of total snow depth between 08.00 and 12.00 h of 6 January 1988).
No. 7: preceded by a short shower with graupel 2–3 mm in size; this is rare in wintertime.
No. 8: most snow transport took place during 20 gusts with wind speed greater than 15 m/s, flux was only moderate between gusts.
No. 9: estimated mass ratios of crystal types (new large crystals: felt-like grains: rounded grains) was 3:1:1 at the 1.20 m level and 1:1:2 at the 0.03 m level.
No. 10: at the 0.05 m level small rounded fragments approximately 0.2 mm in diameter were dominant. Smooth surface and erosion from weak, unsettled, newly fallen snow.
No. 11: lower wind speed and hard windward snow produced less snow transport than previous run, but bed load in lowest 0.08 m was higher (see Fig. 5a).
No. 12: turbulence in wind direction was very pronounced; unstable conditions diminished trap efficiency.
No. 13: hardened snow surface, snow transport only in 25 gusts with speeds of more than 12 m/s, grain-type distribution ratio 1:1:8 at the level of 0.01 m.
No. 15: Fluffy, weak, new snow was easily erodable. Initially erosion was 0.02 m at the mast but later small sastrugi were filled and terrain became smoother again. Grain-type distribution at 1.15 m = 8:2:0; at 0.38 m = 5:5:0; at 0.02 m = 5:4:1 (see Fig. 5b).
No. 18: Erosion with hard sastrugi on windward side and greater than 50 m on the lee side; deposition up to 100 m.
Figure 5 presents outstanding differences in density profiles in relation to free-field precipitation rate. Pure drifting occurs at wind speeds of about 8 m/s only in the first 0.5 m above snow surface, but with precipitation there is an asymptotic approach to precipitation rate (Reference FöhnFöhn, 1980). Assuming a mean fall velocity of 1 m/s, the precipitation rate of 2.5 mm/h or 2500 g/m2 h is equivalent to an undisturbed drift flux of 0.7 g/m2 s at ground level.
Subtracting the drift transport originating from free-field precipitation (Q prec) from the measured drift-transport rate (Qs) gives an indication of the additional snow-transport rate, which may also be verified by the snow redistribution around the hill. A representative equation

for drift-transport rates has been used, and in Figure 6 all 20 drift-transport rates, Qrest, obtained from the readings of VF tests during the winter 1987–88 have been plotted, together with data from the 75 runs collected in previous winters (1978–79 to 1984–85) at the crest position, and then compared with mean wind speed at a reference height chosen as 2.0 m in order to facilitate comparison with the two data sets. For crest readings, this comparison implied a bulged profile type adaptation. The large scattering cannot be explained by inaccuracies in precipitation measurements alone, but is more likely to have resulted from snow surface conditions such as snow density or sintering behaviour.
Snow Deposition And Redistribution
We make the assumption that all lifted material is deposited within a limited distance behind the crest or behind obstacles such as buildings or blocks. The most important factor is the acceleration rate near the ground, represented by

Drift transport rate, Qrest, in lowest 5 m above snow surface as a function of mean reference wind speed, Ur. Numbers indicate integers of corresponding precipitation rates (mm/h).

with u(x) adapted from a potential flow model (Reference Föhn and MeisterFöhn and Meister, 1983). In a drift flow, erosion or resuspension occurs when a(x) < 0 and deposition when a(x) > 0. Threshold wind speed for transport of snow is determined primarily by the degree of cohesive bonding (Reference SchmidtSchmidt, 1980). All material passing the crest line as additional load, Qrest, will be deposited at a distance which will be determined by terrain roughness, aspect, and wind velocity. Reference WelzenbachWelzenbach (1930) has distinguished two cornice types in relation to speed and kinematic viscosity of the air. He has mentioned a pressure-influenced type, in which grains adhere at the windward site, and a rolling type in which particles deposited in a static section are afterwards rolled together as an ensemble. It is the second type of cornice or snow accumulation that is of interest to us.
Around small two-dimensional obstacles, Reference TablerTabler (1975) was able to obtain good results with a stepwise calculation of the development of an equilibrium snow profile. This model has been tested in Alpine terrain, but has the problem that one of the most important unknown parameters is the settlement of the relatively loose wind-blown snow. Over sharp-edged borders along roadsides one can observe the typical deposition features which adjust the streamline direction during the drift process. The upper border of the mixing zone lengthens the forward-lying terrain; small crevasses can be filled in this manner, but with the low viscosity of the deposited snow the snow mass settles and streamline equilibration must begin again in the next storm. At the beginning of winter, small terrain irregularities are filled during the first storms and for these also a settlement effect has to be taken into account. Wind-hardened slabs usually have high viscosities (Reference MeisterMeister, 1985), so that loose layers below will settle more easily due to radiation effects. This is a situation which can lead to additional stresses.
Surveying snow depth around ridge slopes (Reference Föhn and MeisterFöhn and Meister, 1983) has helped make it possible to measure the total snow transport in windy periods. The relevant equation is

which showed that the snow mass transported to the leeside in a given time equals half the difference between the increment of water equivalent (in mm) on the lee slope (ΔW1) and the windward slope (ΔWW). The equation holds only if the ridge system as a whole catches the same total mass as a reference plot in the same vicinity. Earlier surveys have helped investigators to explore the additional deposition to the leeside of alpine ridges. Additional deposition is equivalent to drift transport, Qrest, and deposition length depends on slope angle, wind speed and drift density.
Reference Dyunin and KotlyakovDyunin and Kotlyakov (1980) have presented a snow-storm loading and total solid discharge of drifting snow which, according to their observations, grows with the third power of wind speed. With a refinement related to precipitation rate, pr (mm/h), mean wind speed at reference height Ur (m/s), and threshold wind speed vtr (m/s), we get a mass of wind-transported snow ΔM to lee slopes of

Threshold wind speed, vtr, is found to be 5 m/s. The reliability of this equation was tested with winter readings from 1978–79 to 1981–82; the best agreement was found after splitting wind direction into two main sectors (north-west and south-east), and obtaining mean wind speeds for Δt = 8 h. This was found by power-spectrum analysis to give a first-order peak in energy exchange (Reference MeisterMeister, 1987).
For winter 1987–88, Equation (6) underestimated additional snow load at the leeward point, P4, shown in Figure 3 by a factor of 2.8. At that site, situated some 40 m to the lee of the small hill, a total water-equivalent of 1152 mm accumulated in the period up to 30 March 1988. Starting with the onset of snow on 11 November 1987, the experimental plot (VF) showed 824 mm; calculation using Equation (6) gives a total for wind-blown additional surplus snow of 116 mm for eastward facing slopes; mean depletion distance of wind-transported snow at ridge crests was in the range of 100–200 m. Snow-depth distributions at VF for 30 March 1988 have been plotted on Figure 3. Unshaded areas indicate regions with a snow depth of 2–3 m; the reference level (HS_VF) was 2.94 m for that day. Areas with less snow (1–2 m and 0–1 m) are shaded parallel to the abscissa and areas with more snow shaded (2–3 m, 3–4 m, 4–5 m) are at right-angles to it. Although the mean wind vector amounts only to 1.2 m/s, accumulation areas are situated in the south-east of the hill and erosion zones lie to the west. It is deduced that the greatest catch of drifting snow must occur in periods with precipitation. The data relating to deposition zones point to flow separation by shed vortices.
The question arises whether there are some dominant terrain zones on which snow accumulation happens in a similar manner each winter. The total input mass of snow plays an important role; it can range from 400 to 1500 mm of water equivalent at an altitude of 2500 m. Wind regimes also vary from winter to winter. Small troughs are usually filled during the first storm as are lee slope and cornice accumulations above about 2000m. This can be observed in springtime with ablation features.
Avalanche Activity
The influence of snow transport on avalanche activity has to be considered from two different aspects: (a) temperature-gradient snow metamorphism depends mainly on total snow depth, and thus it differs between places with heaped snow and those with swept humps; (b) surplus stresses in rupture zones are due mainly to wind-transported snow masses. The most critical situations for wind-dependent avalanche occurrences are during and in the 24 h following storms. The build-up phase of accumulation in combination with precipitation and drift is of major importance.
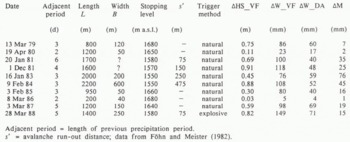
A dangerous track in the Davos area is Salezer Tobel, situated just west of Davos lake (Fig. 1). Using data from the ten most important events in the past 10 years at that path, which are presented in Table IV and Figure 7, the smoothing effects were estimated by Equation (6), in relation to avalanche length and snow-depth increments (ΔW1) in the adjacent precipitation period, after taking account of the mass (ΔM) of the wind-transported snow. Avalanche width and gully effect were also parameterized. The readings at the valley station (ΔW_DA) make no sense. The 1979–80 avalanche event occurred in spring, when the whole snow-pack was weakened because of its moisture. The unusual avalanche at 28 March 1988 was triggered by explosives after evacuating people in exposed buildings. According to the snow-depth increments, the rupture height amounted to more than 1.5 m but the avalanche, which did not start in the uppermost zone, had a relatively short total length because of wet snow in the run-out zone. The question arises as to whether that same avalanche would naturally have started some hours later.
Conclusions
These studies have been exclusively concerned with the Davos area, yet for practical purposes conclusions may be drawn which apply equally for different mountain regions.
With the observed large differences of ridge crest and valley winds on a local scale, no application of diagnostic modelling as reported elswhere (Reference TescheTesche, in press) can at the moment be recommended for Alpine topography. More meteorological analyses are necessary. Drift transport sets in at a threshold wind speed of 4–5 m/s, but depends on turbulent fluctuation in the near-surface air and on the density of the uppermost snow layer. Density profiles of wind-transported snow in the lowest 5 m above a level snow surface show that most load is embedded in the lowest 0.5 m above terrain. With precipitation, the density adjusts to the free-field rate above 5 m, but vanishes above 1–2 m without precipitation. Deposition patterns of snow are predominantly conditioned by terrain irregularities. The settlement of the total snow depth prevents an adjustment to equilibrium conditions. To improve rupture-height evalution in potential avalanche zones, a simple model
Salezertobel, davos: most important avalanche events in the winters 1978–79 to 1987–88
Adjacent period = length of previous precipitation period.
s′ = avalanche run-out distance; data from Reference Föhn and MeisterFöhn and Meister (1982).
Salezer Tobel avalanche path. Total avalanche length, L, of maximum events for winters 1978–79 to 1987–88 shown in relation to snow-depth increments (W1) of the adjacent precipitation periods. ΔW_DA is accumulated water equivalent of new snow at the site Davos (1560 m); ΔW_VF is accumulated water equivalent of new snow at VF (2540 m); ΔΜ is accumulated additional drift of new snow as calculated using Equation (6).

brings additional snow loads to leeward areas. Wind speed, divided into three 8 h periods per day, main wind sectors, and precipitation rates refine the model input. For the purposes of improving forecasting methods valley readings of wind speed and snow depths are unsuitable data, but the best results were gained with crest wind measurements and snow-depth readings in sheltered places near the avalanche rupture zones.
Acknowledgements
This work was part of project No. 101 at FISAR, sub-titled “Snow transport”. The author wishes to thank all members of the Institute for helpful support either in field campaigns or in evaluation work. Special thanks go to Director Jaccard for revising the text, P. Weilenmann who provided computer software, and E. Hug for secretarial work.



