I. INTRODUCTION
The unique electronic properties of grapheneReference Peres1 have lead it to be touted as a candidate material for post-complementary metal–oxide–semiconductor (CMOS) electronics. To realize this potential, a method for producing wafer-scale graphene sheets is required to allow for large-scale manufacture of graphene-based electronics. The thermal decomposition of silicon carbideReference Berger, Song, Li, Li, Ogbazghi, Feng, Dai, Marchenkov, Conrad, First and de Heer2 is one method that has shown promise in fulfilling this requirement. In this process, a commercial SiC wafer is annealed at high temperatures (at least 1200 °C but often higher). At these high temperatures, the Si atoms preferentially evaporate away from the substrate, thus leaving behind a C-rich surface. This C-rich surface is mobile at high temperatures and can reconstruct to form a sp 2-bonded epitaxial graphene (EG) layer.
Annealing processes can be carried out under either ultrahigh vacuum (UHV) conditionsReference Berger, Song, Li, Li, Ogbazghi, Feng, Dai, Marchenkov, Conrad, First and de Heer2, Reference Forbeaux, Themlin and Debever3 or inert gas atmospheresReference Emtsev, Bostwick, Horn, Jobst, Kellogg, Ley, McChesney, Ohta, Reshanov, Rohrl, Rotenberg, Schmid, Waldmann, Weber and Seyller4, Reference Virojanadara, Syvajarvi, Yakimova, Johansson, Zakharov and Balasubramanian5 with varying results between the two processes.Reference Emtsev, Bostwick, Horn, Jobst, Kellogg, Ley, McChesney, Ohta, Reshanov, Rohrl, Rotenberg, Schmid, Waldmann, Weber and Seyller4, Reference Luxmi, Srivastava, Feenstra and Fisher6 In general, annealing under inert gas atmospheres or under nonvacuum conditions slows the rate of Si evaporation from the surface. This allows the surface to be in a more equilibrated state before graphene growth, thus allowing the formation of better quality graphene films when compared to vacuum annealing.Reference de Heer, Berger, Ruan, Sprinkle, Li, Hu, Zhang, Hankinson and Conrad7 It is also important to note that the growth mechanisms for graphene growth on each of the polar faces of silicon carbide {0001} are differentReference Luxmi, Srivastava, Feenstra and Fisher6, Reference Luxmi, Srivastava, He, Feenstra and Fisher8; here, work concentrates on the growth of graphene on SiC(0001), the Si-terminated face.
As mentioned above, the silicon evaporation rate is important to the subsequent graphene growth. Imperfections and defects on the substrate surface such as polishing scratches and screw dislocations can lead to an increased silicon evaporation rate at those points on the substrate during an annealing process; this leads to uneven graphene growth. To remove these defects from the substrate, substrate preparation plays a key role in the growth of EG films. This routinely involves the use of either a hydrogen etchingReference Berger, Song, Li, Li, Ogbazghi, Feng, Dai, Marchenkov, Conrad, First and de Heer2, Reference Emtsev, Bostwick, Horn, Jobst, Kellogg, Ley, McChesney, Ohta, Reshanov, Rohrl, Rotenberg, Schmid, Waldmann, Weber and Seyller4, Reference de Heer, Berger, Ruan, Sprinkle, Li, Hu, Zhang, Hankinson and Conrad7 or chemical etching procedureReference Virojanadara, Syvajarvi, Yakimova, Johansson, Zakharov and Balasubramanian5to remove these defects from the substrate surface and leave an atomically terraced surface for subsequent graphene growth.
Here, we present evidence that an atomically terraced silicon carbide surface, free of polishing scratches and dislocations, can be produced via annealing at temperatures below the graphitization temperature in argon atmospheres. These substrates can be graphitized by simply continuing to ramp the annealing temperature past that of the onset of graphitization. This single-step sample preparation and graphitization process would be beneficial for industrial integration of the process and negates the need to use harmful chemical etching procedures and potentially dangerous hydrogen etching procedure.
II. EXPERIMENTAL DETAILS
The annealing processes during this work were all carried out in a MTIXTL GSL-1700X-80 furnace (MTI Corporation, Richmond, CA). The furnace has a top operating temperature of 1700 °C, and the tube is made out of high purity alumina (99.8% purity). Alumina of this grade is very stable within the operating temperatures of the furnace system; however, to stop the tube shattering, the maximum ramp rate in temperature allowed with the furnace is 5 °C/min for both increasing and decreasing temperature. These ramp rates are somewhat slower than usually used elsewhere during SiC annealing procedures in inert gas.Reference Emtsev, Bostwick, Horn, Jobst, Kellogg, Ley, McChesney, Ohta, Reshanov, Rohrl, Rotenberg, Schmid, Waldmann, Weber and Seyller4The tube furnace can be flushed and pumped using a rotary pump and high-grade (99.9999% pure) argon gas before commencing annealing runs. The samples were typically 5 × 10 mm chips diced from a 3-inch semi-insulating 4H–SiC wafer purchased from Cree (Cree Inc., Durham, NC), with the (0001) target face prepared epiready. The samples were housed in an enclosed graphite sample holder during the annealing processes with the target face, SiC(0001), lying flat on the holder bottom.
To ensure that the atmosphere within the furnace remains clean during the annealing processes, a 1.5 standard liters per minute (slm) flow of high-grade (99.9999% pure) argon gas at atmospheric pressures is maintained; this flow rate ensures that the gas in the tube is fully replaced every 3 min during an annealing run. Annealing processes have been carried out in a temperature range of 1400–1690 °C at times varying between 15 and 120 min. After annealing, the samples are removed from the furnace and their surfaces characterized.
The majority of the data presented in this work will be atomic force microscope (AFM) images taken under ambient conditions using a Veeco multimode AFM system (Veeco, Plainview, NY) operating in tapping mode. AFM provides a versatile tool for measuring surface morphologies and has been used extensively elsewhere to probe SiC and EG samples.Reference Emtsev, Bostwick, Horn, Jobst, Kellogg, Ley, McChesney, Ohta, Reshanov, Rohrl, Rotenberg, Schmid, Waldmann, Weber and Seyller4, Reference Luxmi, Srivastava, Feenstra and Fisher6, Reference Luxmi, Srivastava, He, Feenstra and Fisher8 Raman spectroscopy has been used to determine the chemical nature of the samples postannealing and again is a technique widely used to measure EG systems.Reference Emtsev, Bostwick, Horn, Jobst, Kellogg, Ley, McChesney, Ohta, Reshanov, Rohrl, Rotenberg, Schmid, Waldmann, Weber and Seyller4, Reference de Heer, Berger, Ruan, Sprinkle, Li, Hu, Zhang, Hankinson and Conrad7, Reference Strudwick, Creeth, Johansson and Marrows9Here, Raman spectra have been taken at with incident laser light at both 633 and 532 nm wave lengths, using Renishaw and Horiba systems, respectively. Raman maps have been acquired with the 532-nm wave length Horiba system and compared to AFM data from the same sample area. Low energy electron diffraction (LEED) has been used to track the surface reconstructions on a number of samples postfurnace annealing and was carried out in UHV.
IV. RESULTS
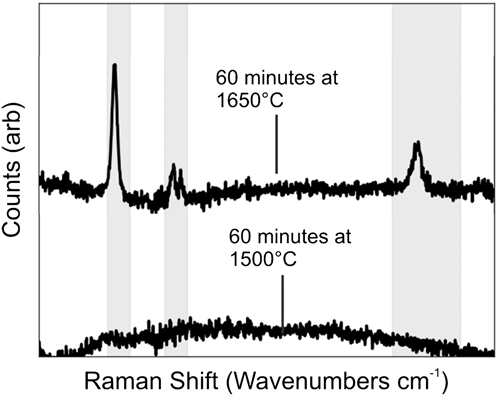
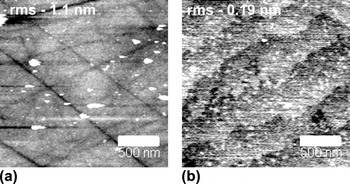
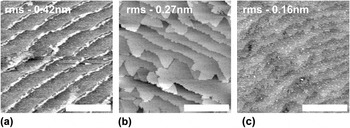
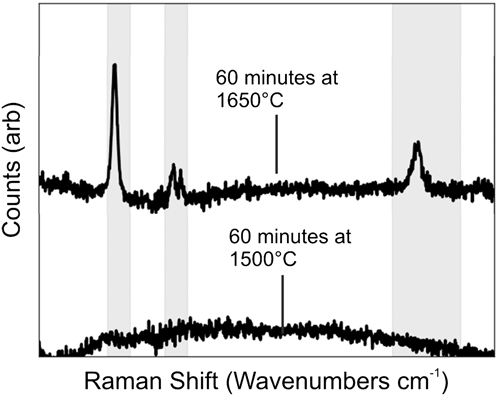
Following previous work carried out within our group on the growth of EG in UHV systems,Reference Strudwick, Creeth, Johansson and Marrows9, Reference Creeth, Strudwick, Sadowski and Marrows10 it was estimated that to achieve graphitization at atmospheric pressures, a temperature of at least 1500 °C would be required to account for the decreased silicon evaporation rate. The results of annealing at this temperature were surprising. The silicon carbide had not graphitized, as shown by a noncarbon-rich Raman spectrum (see Fig. 1), but the SiC substrate, previously marred by polishing scratches [shown in Fig. 2(a)], had become atomically terraced [as Figs. 2(b) and 3show]. This type of surface has been observed elsewhere following the use of hydrogen gas or chemical etching but here was found following an annealing process carried out in an inert gas atmosphere.
Raman spectra from silicon carbide annealed for 60 min at 1500 and 1650 °C. The shaded regions correspond to the major graphene bands, from left to right: D band, G band, and 2D band. The laser wave length used for these measurements was 633 nm.
(a) AFM micrograph of an unannealed SiC(0001), RMS roughness quoted on micrograph, scale bar shown is 500 nm, z-grayscale −2 to 2 nm. (b) AFM micrograph of SiC(0001) annealed under an argon atmosphere for 60 min at a temperature of 1500 °C, RMS roughness quoted on micrograph, scale bar shown is 500 nm, z-grayscale −0.25 to 0.25 nm.

(a) AFM micrograph of SiC(0001) annealed under an argon atmosphere for 15 min at a temperature of 1500 °C, z-grayscale −1 to 1 nm. (b) AFM micrograph of SiC(0001) annealed under an argon atmosphere for 30 min at a temperature of 1500 °C, z-grayscale −1 to 1 nm. (c) AFM micrograph of SiC(0001) annealed under an argon atmosphere for 60 min at a temperature of 1500 °C, z-grayscale −0.5 to 0.5 nm. All scale bars shown are 2 μm and RMS roughness values are quoted in each micrograph.

Increasing the annealing time from 15 min at 1500 °C leads to the morphology changes shown in Fig. 3, where the original ∼0.3 nm high and 300 nm wide steps broaden after an annealing run of 30 min to give areas where the step width has extended to about 2 μm and the step heights to 1–2 nm [see Fig. 3(b)]. After annealing for an hour, the sample returns to having a similar morphology to a 15-min anneal with the presence once more of ∼0.3 nm high and 300 nm wide steps [see Fig. 3(c)]; however, this time, the steps are much flatter as shown by the decrease in RMS roughness (values for which are shown on the micrographs).
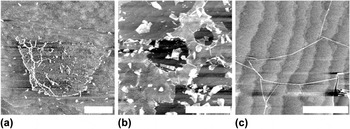
Following this observation, an attempt to graphitize the SiC substrates was carried out by performing annealing runs at increasing temperatures. The results here concentrate on 60-min annealing runs at these higher temperatures; these can be seen in Fig. 4[panel (a) shows the results of a 1600 °C anneal, panel (b) a 1650 °C anneal, and panel (c) a 1690 °C anneal]. The underlying terraced SiC substrate with ∼1 μm wide steps of height ∼0.3 nm can once again be seen. On top of this lie “islands” of graphene growth that can be seen to be rippled and wrinkled within the AFM micrographs. As expected, the graphene growth procedure is somewhat dependent on both the temperature and length of the annealing process. Increasing annealing time leads to a general increase in graphene “island” size toward more complete films and an increase in annealing temperature leads to more graphene production in a given annealing time.
(a) AFM micrograph of SiC(0001) annealed under an argon atmosphere for 60 min at a temperature of 1600 °C, z-grayscale −1 to 1 nm. (b) AFM micrograph of SiC(0001) annealed under an argon atmosphere for 60 min at a temperature of 1650 °C, z-grayscale −2 to 2 nm. (c) AFM micrograph of SiC(0001) annealed under an argon atmosphere for 60 min at a temperature of 1690 °C, z-grayscale −1 to 1 nm. All scale bars shown are 2 μm.

However, as the sequence of micrographs in Fig. 4 show, increasing the annealing temperature leads to more dramatic fracturing and rippling of the graphene films and also leads to the production of thicker graphene regions (not shown). Raman spectra (shown in Fig. 1) taken with a larger spot size (∼5 μm) show some interesting features. The observation of a large D peak can be understood from the presence of rips and folds within the graphene filmReference Gupta, Nisoli, Lammert, Crespi and Eklund11 as well as the presence of edge regions.Reference Tuinstra and Koenig12, Reference Ferrari and Robertson13 Meanwhile, the origin of the split G peak is not fully understood. The effects of curvature and confinement have been shown to cause such an effect.Reference Piscanec, Lazzeri, Robertson, Ferrari and Mauri14 However, in this case, the split is due to phonon hardening and not softening as expected from curvature effects, and the split is ∼30 cm−1, which is too large for confinement effects.
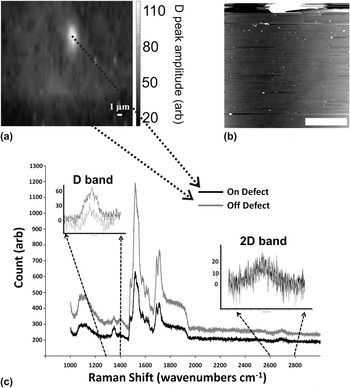
Choosing an intermediate annealing temperature of 1650 °C and a longer annealing time of 120 min leads to the production of a more complete graphene film, with regions measuring ∼30 × 30 μm of unbroken graphene growth being observed. This is shown in Fig. 5 with Raman mapping and AFM scanning of the same area. The alignment of the AFM micrograph [Fig. 5(b)] and Raman map [Fig. 5(a)] is not exact as can be seen by the relative position of the defect in each image. Raman mapping with a laser spot size of ∼0.25 μm as in Fig. 5(a) shows that the D peak contribution is small within areas of complete graphene growth and higher in defective regions (extrinsic defects as shown in Fig. 5). This is highlighted in Fig. 5(c) where individual Raman spectra are shown from the mapping shown in Fig. 5(a) from the defected and nondefected regions. The defected region shows a much stronger D band as expected,Reference Tuinstra and Koenig12, Reference Ferrari and Robertson13whereas the 2D band remains relatively unaffected; the G band region is masked by the SiC background peaks.
(a) Raman map of the D peak amplitude (after peak fitting), spectra taken at a laser wave length of 532 nm. (b) AFM micrograph of the same area shown in the Raman map (a), scale bar shown is 10 μm, z-grayscale −5 to 5 nm. The large defect present in the AFM micrograph is the same defect causing the large D peak in the Raman map and was used to align the two images. The rest of area appears to consist of an unbroken graphene film. (c) Individual Raman spectra taken from both on (black lines) and off (gray lines) the point defect region, insets: (left) highlights the D band region (1300–1400 cm−1) and (right) 2D band region (2600–2800 cm−1) with a background subtraction used to align the spectra in these regions. Arrows between (a) and (c) highlight the positions used for the individual Raman spectra.

IV. DISCUSSION
The mechanism behind the formation of terraces via annealing under a flow of argon gas is not yet fully understood. A simplistic view would be to assume that the long annealing processes carried out here (due to the enforced slow ramp rates) allows for a large time window in which the surface of the SiC is very mobile. During this phase, the polishing scratches and other “defects” on the surface are “filled in” as surface atoms are free to move. Once the temperature at which Si evaporates is reached, the change in Si:C atom ratio at the surface drives surface reconstructions, as shown elsewhere,Reference Hibino, Kageshima and Nagase15 and potentially explains the expansion of terraces as reconstructions sweep across the surface with changing Si:C atom ratio at the surface. The formation of terraced silicon carbide substrates during hydrogen etching procedures has been due to surface-free energy minimization and preferential etch directions.Reference Ramachandran, Brady, Smith, Feenstra and Greve16This could hold here if the silicon evaporation also occurs in preferential directions.
These observations are consistent with SiC annealing processes carried out elsewhere in the presence of a Si-rich atmosphere via the use of either a SiH4 overpressure in argon gasReference Saddow, Kumar, Isaacs-Smith, Williams, Hsieh, Graves and Wolan17 or the use of a silicon flux within vacuum annealing.Reference Ferrer, Moreau, Vignaud, Godey and Wallart18 This suggests once more that the presence of the argon gas acts to slow the Si evaporation rate from the surface and creates an increased partial pressure of Si over the substrate. This suppresses the graphitization of the SiC and allows for the observed surface reconstructions to take place. This is consistent with other reports on graphitization of silicon carbide wafers under argon atmospheresReference Emtsev, Bostwick, Horn, Jobst, Kellogg, Ley, McChesney, Ohta, Reshanov, Rohrl, Rotenberg, Schmid, Waldmann, Weber and Seyller4–Reference Luxmi, Srivastava, Feenstra and Fisher6and under confined geometries.Reference de Heer, Berger, Ruan, Sprinkle, Li, Hu, Zhang, Hankinson and Conrad7
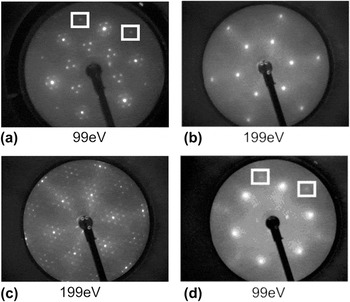
The terrace step heights produced here are lower than the usual half unit cell step heights observed after hydrogen etching. This is not too surprising considering that the carbon atoms are not expected to be removed in this process unlike hydrogen etching whereby they are stripped away. LEED data for a sample annealed at 1500 °C for 15 min [displayed in Fig. 6(a)] show a “buffer-layer” of (6√3 × 6√3) R30 reconstruction indicating the presence of a carbon-rich surface, though longer anneals at this temperature (30 min) show a (1 × 1) reconstruction [Fig. 6(b)] and a complicated buffer layer-like (60 min) pattern [Fig. 6(c)] indicating that the carbon present on the 15-min anneal sample may have been from an extrinsic source (EG growth subsequently driven when the sample was annealed at 1000 °C in UHV in preparation for LEED). Nevertheless, the evolution from a (1 × 1) structure seen for a 30-min anneal to a buffer-like reconstruction for a 60-min anneal suggests that the varying Si to C ratio on the surface could be the mechanism driving these reconstructions.
(a) LEED image taken of SiC(0001) after a 15-min anneal at 1500 °C under argon atmosphere. (b) LEED image taken of SiC(0001) after a 30-min anneal at 1500 °C under argon atmosphere. (c) LEED image taken of SiC(0001) after a 60-min anneal at 1500 °C under argon atmosphere. (d) LEED image taken of SiC(0001) after a 15-min anneal at 1600 °C under argon atmosphere. The beam energies used for each are quoted within each image. The boxes in (a) and (d) highlight the position of representative graphene spots in these reconstructions.

LEED data for samples graphitized via annealing at 1600 °C for 15 min [Fig. 6(d)] show a blurred graphene spot pattern rotated at 30° to a SiC (1 × 1) reconstruction at low accelerating energies (99 eV). This can be attributed to the roughness of the grown graphene films as observed in AFM. The lack of a typical (6√3 × 6√3) R30 after graphitization suggests that the graphene film is somewhat decoupled from the surface, again fitting in with the rippled and wrinkled nature of the films observed with AFM.
V. CONCLUSIONS
Here, we have presented work in which SiC surfaces can be both atomically smoothed and subsequently graphitized within a single annealing procedure under just a flow of inert argon gas. This would have benefits in the implementing of EG growth into an industrial process as it removes the need for chemical etching and hydrogen etching procedures and associated safety hazards and environmental issues. However, work is still required to understand the mechanisms behind this process and to fully optimize the graphitization process to ensure the graphene film quality is high.
ACKNOWLEDGMENTS
The authors would like to acknowledge funding from the U.K. EPSRC (EP/G009104/1) and Intel Ireland.