I. INTRODUCTION
SnO2, a wide band gap (3.6 eV) n-type semiconductor with high carrier density is an attractive host material for the investigation of ferromagnetism in dilute magnetic semiconductors. Several reports are available in the literature on nanocrystalline Co-doped SnO2 with conflicting results, especially on the existence of room temperature ferromagnetism (RTFM). Reference Fitzgerald, Venkatesan, Douvalis, Huber, Coey and Bakas1–Reference Bouaine, Brihi, Schmerber, Bouillet, Colis and Dinia4 RTFM is observed in Co-doped SnO2 (Refs. Reference Fitzgerald, Venkatesan, Dorneles, Gunning, Stamenov, Coey, Stampe, Kennedy, Moreira and Sias5 and Reference Ogale, Choudhary, Buban, Lofland, Shinde, Kale, Kulkarni, Higgins, Lanci, Simpson, Browning, Sarma, Drew, Greene and Venkatesan6) prepared by pulsed laser deposition technique, while wet chemically synthesized Co-doped SnO2 showed antiferromagnetic interactions. Reference Liu, Zu and Zhou2 Co-doped SnO2 powders at low dopant concentration (1%) show RTFM; however, ferromagnetism vanished to show paramagnetic behavior at higher concentration. Reference Punnoose, Hays, Gopal and Shutthanandan3 These nanoparticles show paramagnetic behavior with antiferromagnetic interactions along with decrease in band gap as prepared by coprecipitation technique. Reference Bouaine, Brihi, Schmerber, Bouillet, Colis and Dinia4 Recently, Co-doped SnO2 shows paramagnetic behavior and red shift in band gap as synthesized by solvothermal method. Reference Ghosh, Munshi and Mandal7 RTFM is also observed for polycrystalline Sn1−x Co x O2 (x = 0.02, 0.05, and 0.10) where saturation magnetization decreases on increasing cobalt concentration. Reference Mohanty and Ravi8 Co-doped SnO2 (3.37%) synthesized by sol–gel-hydrothermal method exhibits RTFM with high Curie temperature at 400 K. However, ab initio calculations suggest the coexistence of ferromagnetism and paramagnetism. Reference Chen and Li9 Stable RTFM has been found in Co-doped SnO2 systems in both films and nanoparticles, however, their Curie temperature and saturated magnetic moments per dopant cobalt diverged greatly in different reports. Reference Punnoose, Hays, Gopal and Shutthanandan3,Reference Ogale, Choudhary, Buban, Lofland, Shinde, Kale, Kulkarni, Higgins, Lanci, Simpson, Browning, Sarma, Drew, Greene and Venkatesan6,Reference Mohanty and Ravi8–Reference Srinivas, Vithal, Sreedhar, Raja and Reddy12 In view of this, it is clear that a suitable combination of synthetic procedures and dopant concentration must be used to obtain RTFM.
The optical properties of semiconductor nanoparticles have recently been a subject of great interest. Detailed literature survey has been carried out for the optical properties of Co-doped SnO2 systems, which showed that band gap reduces on incorporation of Co2+ in SnO2 lattice site. Reference Bouaine, Brihi, Schmerber, Bouillet, Colis and Dinia4,Reference Ghosh, Munshi and Mandal7,Reference Fang, Zu, Li, Zhu, Liu, Wang and Gao13 To the best of our knowledge, only one report is available in the literature for the blue shift in energy band gap on increasing Co content in SnO2 lattice site. Reference Srinivas, Vithal, Sreedhar, Raja and Reddy12 It is well known that the band gap of semiconductors can be tuned by controlling the size of the particles, which increases with decrease in the particle size due to the quantum size effects. While size of the nanoparticles can be controlled by the soft chemical synthesis methods. Also, the Co dopant can inhibit the growth of crystallite and play an important role in the optical properties. Therefore, we have chosen the oxalate precursor mediated modified solvothermal method Reference Khatoon, Coolahan, Lofland and Ahmad14–Reference Ahmad, Khatoon, Coolahan and Lofland17 to synthesize Co-doped SnO2 nanoparticles at low temperature (600 °C). Recently, this route was applied for the successful preparation of Mn-doped SnO2 nanoparticles. Reference Ahmad, Khatoon and Coolahan18 In this study, we present our investigation to understand the optical and magnetic properties of Co-doped SnO2 nanoparticles prepared by modified solvothermal method through oxalate precursor route.
II. EXPERIMENTAL
The synthesis of Sn1−x Co x O2 (x = 0.05, 0.10, and 0.15) was carried out by the thermal decomposition of oxalate precursor at 600 °C, which was synthesized by the modified solvothermal method. Stoichiometric quantities of 0.1 M aqueous solutions of tin chloride dihydrate (Merck, 97%) and cobalt acetate tetrahydrate (Merck, 99%) were well mixed in 500 mL round bottom flask with constant stirring. To the above solution, 75 mL of 0.1 M aqueous solution of diammonium oxalate (Merck, 99%) was added. A yellow suspension was immediately formed. Approximately 75 mL of ethanol (Merck) was also added to the reaction mixture to make low boiling azeotropic solution and the mixture was refluxed for 12 h at ∼70 °C in a closed environment so that the volume of reaction mixture remains constant. The product was well separated by centrifugation, washed with acetone, and then dried at 60 °C in an oven.
Fourier transform infrared (FTIR) spectra of the oxalate precursor were recorded in the wave number range of 500–4000 cm−1 on a Bruker FTIR spectrophotometer under the neat conditions on ZnSe crystals. Thermogravimetric analysis of the precursor was carried out using EXSTAR 6000 instrument (SII Nanotechnology Corporation, Tokyo, Japan) under nitrogen atmosphere at a heating rate of 5 °C min−1 with alumina as a reference sample. Powder x-ray diffraction (PXRD) studies were carried out using a Bruker D8 advance diffractometer using Ni-filtered Cu Kα x-rays of wave length (λ) 1.54056 Å. Normal scans were recorded with a step size of 0.05° and a step time of 1 s. Raw data were subjected to background corrections and Kα2 lines were stripped off using normal stripping procedure. The grain size and morphology of nanoparticles have been studied by transmission electron microscopy (TEM) using FEI Tecnai G2 20 TEM (Hillsboro, OR) with an accelerating voltage of 200 kV. The TEM specimens were prepared by dispersing the samples in ethanol and placing a drop of the dispersed sample in a copper grid. Room temperature optical properties were measured using UV–Visible spectrophotometer (ocean optics lambda-25) in reflection mode. The energy band gap of these nanoparticles can be further calculated by the reflection spectra by the Kubelka–Munk remission function F(R) Reference Kortum19 :
 $$F\left( R \right) = \left(1 - R\left)^2 / 2R \quad ,$$
where R is the diffuse reflectance.
Specific surface area of the powder samples was determined by Brunauer–Emmett–Teller (BET) method using multipoint BET equation with the help of surface area and pore size analyzer (Quantachrome Instruments, Model NOVA 2000e, Boynton Beach, FL). Samples were degassed at 250 °C for 3 h in vacuum for the removal of adsorbed gases. After degassing, specific surface areas were obtained from the nitrogen adsorption experiments measured at 77.35 K. Magnetic properties were measured using a Quantum design physical properties measurement system in the temperature range of 5–300 K at an applied magnetic field of 1 kOe.
III. RESULTS AND DISCUSSION
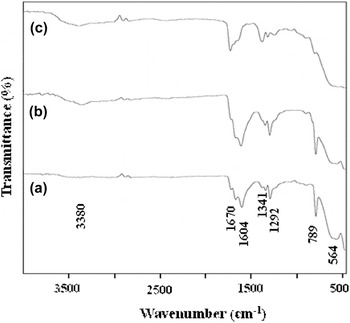
The FTIR spectra of oxalate precursors (Fig. 1) showed the characteristic bands at around 1604–1670 cm−1 and 1292–1341 cm−1 ascribed to asymmetric and symmetric C–O stretching, respectively. An intense signal at 789 cm−1 is due to O–C=O deformation. The bands observed in the low wave number region of 474–564 cm−1 may be due to vibration of antisymmetric Sn–O–Sn mode of tin oxide. These results are in good agreement with earlier reports. Reference Srinivas, Vithal, Sreedhar, Raja and Reddy12,Reference Alcantara, Madrigal, Lavela, Vicente and Tirado20,Reference Nakamoto21
FTIR spectra of Sn1−x Co x C2O4 precursors for x = 0.05, 0.10, and 0.15.

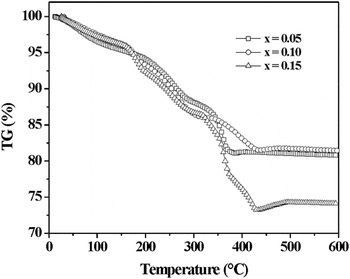
Furthermore, the thermal decomposition behavior of the Sn1−x Co x C2O4 (x = 0.05, 0.10, and 0.15) precursor was determined under nitrogen atmosphere (Fig. 2). The substitution of Co2+ ions became feasible over SnO2 host lattice by displacing Sn4+ ions because of the smaller ionic radius of Co2+ (0.58 Å) as compared to Sn4+ (0.69 Å) host ions. Reference Shannon22 The precursor starts losing weight as soon as it is heated. A continuous weight loss of 1–2% is observed till 150 °C, which may be attributed to the removal of adsorbed water. Reaction 1 described the removal of less bonded water molecules from Co-doped tin oxalate precursor. The second weight loss in the temperature range of 150–500 °C may be attributed to the formation of Co-doped SnO2 from anhydrous oxalate by the evolution of CO as described in reaction 2. The plausible reaction mechanism for the formation of Co-doped SnO2 from its corresponding oxalate is shown below:
 $${\rm{S}}{{\rm{n}}_{1 - x}}{\rm{C}}{{\rm{o}}_x}{{\rm{C}}_2}{{\rm{O}}_4} \cdot 0.1{{\rm{H}}_2}{\rm{O}}\buildrel {30-150\;^\circ {\rm{C}}} \over \longrightarrow \;{\rm{S}}{{\rm{n}}_{1 - x}}{\rm{C}}{{\rm{o}}_x}{{\rm{C}}_2}{{\rm{O}}_4} + 0.1{{\rm{H}}_2}{\rm{O}}\quad {\rm{,}}$$
 $${\rm{S}}{{\rm{n}}_{1 - x}}{\rm{C}}{{\rm{o}}_x}{{\rm{C}}_2}{{\rm{O}}_4}\buildrel {150-500\;^\circ {\rm{C}}} \over \longrightarrow {\rm{S}}{{\rm{n}}_{1 - x}}{\rm{C}}{{\rm{o}}_x}{{\rm{O}}_2} + 2{\rm{CO}} \uparrow \quad .$$
TG curves of Sn1−x Co x C2O4 precursors for x = 0.05, 0.10, and 0.15.

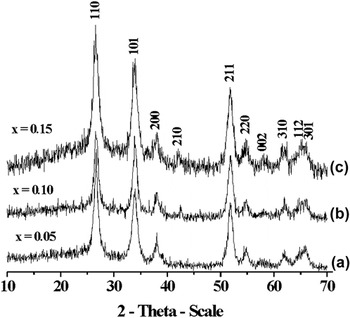
Figure 3 shows the XRD pattern of Co-doped SnO2 synthesized by decomposing the precursor at 600 °C for 6 h under nitrogen atmosphere. The diffraction pattern shows pure crystalline phase with broad peaks corresponding to tetragonal cassiterite structure of SnO2 (JCPDS No. 77-0452) with P42/mnm symmetry. No other phases could be detected in the XRD patterns, indicating the substitution of Co2+ in the SnO2 matrix instead of forming a new phase. A monotonic shift of diffraction peaks toward higher angle is observed on increasing the Co concentration, indicates the contraction of SnO2 lattice. The lattice parameters decrease on increasing the Co concentration. This variation is consistent with the smaller ionic radius of Co2+ with respect to Sn4+. Reference Shannon22 The contraction of lattice constants confirmed the incorporation of Co2+ in SnO2 host lattice. As the Co content increases, the XRD peaks appear to be wider, indicating the possible changes in the particle size.
XRD patterns of Sn1−x Co x O2 nanoparticles for x = (a) 0.05, (b) 0.10, and (c) 0.15 heated at 600 °C under N2 atmosphere.

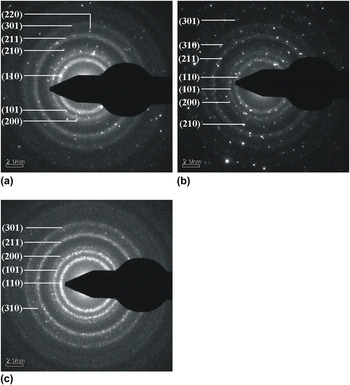
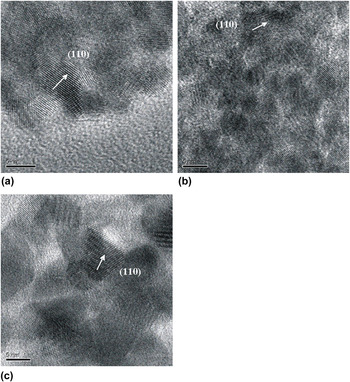
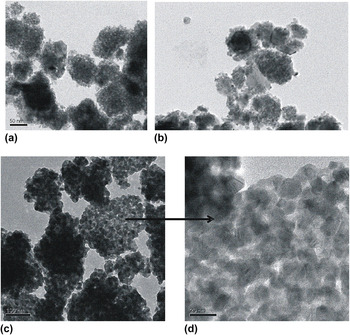
Selected area electron diffraction (SAED) patterns of Sn1−x Co x O2 (x = 0.05, 0.10, and 0.15) confirm the nanocrystalline nature of the samples (Fig. 4). The concentric rings can be indexed to the reflections of cassiterite SnO2 structure and show only diffraction intensity associated with highly crystalline SnO2, which is consistent with XRD results. HRTEM images show the lattice fringes which correspond to the (110) plane (Fig. 5). TEM images show the formation of nearly hexagonal particles with an average size of 13, 10, and 8 nm, respectively (Fig. 6), which decreases with increasing Co concentration. Few bigger particles of size 20–45 nm could be seen at x = 0.05 and 0.10 [Figs. 6(a) and 6(b), respectively], may be due to the aggregation of smaller particles. The particle size distribution of these nanoparticles lies in the range of 5–45 nm with the maximum frequency of occurrence is found to be at 7 and 4 nm, respectively. Uniform, homogeneous, and monodisperse particles are formed for Sn0.85Co0.15O2 [Fig. 6(c)]. The decrease in particle size with increasing Co concentration may be due to the lattice distortion and the internal stress, which arises because of the radius difference between Co2+ (0.58 Å) and Sn4+ (0.69 Å). Reference Wei, Xu, Ren, Wang, Shen and Han23,Reference Lee, Kang, Han, Jang, Chae, Yang and Kim24 Particles at all concentration show high agglomeration, which may be due to the presence of magnetic interactions of Co2+ ions present in Sn1−x Co x O2 solid solution.
SAED of Sn1−x Co x O2 nanoparticles for x = (a) 0.05, (b) 0.10, and (c) 0.15.

HRTEM images of Sn1−x Co x O2 nanoparticles for x = (a) 0.05, (b) 0.10, and (c) 0.15.

TEM micrographs of Sn1−x Co x O2 nanoparticles for x = (a) 0.05, (b) 0.10, (c) 0.15, and (d) closer look of Sn0.85Co0.15O2 particles.

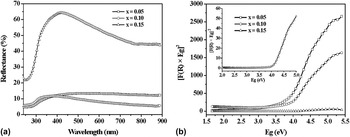
Optical measurements have been performed at room temperature by UV–Visible spectroscopy to confirm the incorporation of Co2+ in Sn4+ matrix. Reflectance spectra of Sn1−x Co x O2 (x = 0.05, 0.10, and 0.15) nanoparticles show a sudden decrease in reflectance at around 370 nm [Fig. 7(a)]. This corresponds to the dominant band gap excitations and showed that the particles are almost uniformly distributed in the sample. Reference Samuel, Bose and George25 It has been observed that the percentage reflectance increases to 80% on increasing the Co concentration to x = 0.15. The variation of the band gap energies was determined using Kubelka–Munk function [Fig. 7(b)] and was found to be 3.85, 3.91, and 4.09 eV, respectively, which are blue shifted in comparison to undoped SnO2. The increase in band gap may be due to the Moss–Burstein effect Reference Burstein26,Reference Moss27 as well as the decrease in particle size. The blue shift of the band gap revealed the incorporation of Co2+ in the lattice sites of SnO2.
(a) Reflectance spectra of Sn1−x Co x O2 nanoparticles for x = 0.05, 0.10, and 0.15. (b) Kubelka–Munk plots for direct band gap determination of Sn1−x Co x O2 nanoparticles for x = 0.05, 0.10, and 0.15. The inset shows the enlarged Kubelka–Munk plot for x = 0.15.

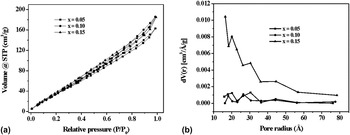
The specific surface area of Sn1−x Co x O2 (x = 0.05, 0.10, and 0.15) nanoparticles was calculated from BET plot using multipoint BET equation and found to be 194, 211, and 219 m2/g, respectively, which increases on increasing Co2+ concentration. The increase in surface area may be due to the decrease in the size of nanoparticles. Figure 8(a) shows the nitrogen adsorption–desorption isotherms of Sn1−x Co x O2 nanoparticles. Despite the difference in the composition of solid solutions, all the adsorption isotherms show the type IV behavior accompanied by H3 hysteresis. Reference Sing, Everett, Haul, Moscou, Pierotti, Rouquerol and Siemieniewska28 However, the hysteresis area is narrow, indicating the presence of mesopores of smaller size. Similar type of isotherm is also observed for Co-doped CdO nanoparticles. Reference Barick, Aslam, Dravid and Bahadur29 The pore radius was also calculated from the adsorption branch using Barrett-Joyner-Halenda (BJH) method [Fig. 8(b)] and found to be 30.5, 26.4, and 16.5 Å, respectively. It has been observed that pore radius decreases on increasing the surface area. This behavior is again explained on the basis of formation of smaller size particles, which arises due to the increase in disorder with the incorporation of Co2+ ions in SnO2 host lattice. Reference Barick, Aslam, Dravid and Bahadur29,Reference Ahmad, Khatoon, Lofland and Thakur30
(a) Nitrogen adsorption–desorption isotherms of Sn1−x Co x O2 nanoparticles for x = 0.05, 0.10, and 0.15. (b) BJH plots of Sn1−x Co x O2 nanoparticles for x = 0.05, 0.10, and 0.15.

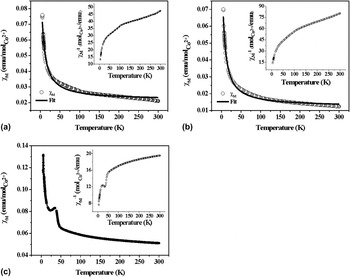
Figures 9(a) and 9(b) represent the temperature dependence of molar magnetic susceptibility (χ) for Sn1−x Co x O2 for x = 0.05 and 0.10, respectively, at an applied magnetic field of 1 kOe in the temperature range of 5–300 K. These nanoparticles exhibit the decrease in χM with increasing temperature, which is attributed to the paramagnetic behavior of the samples. The data were well fitted with modified Curie–Weiss law:
 $$\chi = {\chi _{\rm{o}}} + {C \mathord{\left/ {\vphantom {C {\left( {T + \theta } \right)}}} \right. \kern-\nulldelimiterspace} {\left( {T + \theta } \right)}}\quad .$$
χM versus T plots for Sn1−x Co x O2 nanoparticles for x = (a) 0.05, (b) 0.10, and (c) 0.15 measured at 1 kOe. The solid line shows the fit using the modified Curie–Weiss law. The inset shows χM −1 versus T plots for these nanoparticles.

The magnitude of χo has been estimated using least square fitting procedure, which was found to be 2.17 × 10⁻² and 1.22 × 10⁻² emu/mol/kOe, respectively, and indicates the presence of nonparamagnetic contribution in the samples. The Curie–Weiss temperatures for these samples were very high and found to be −702 and −420 K, respectively, by extrapolating the high temperature linear part of the inverse susceptibility graph to χM −1 = 0 [inset of Figs. 9(a) and 9(b), respectively]. The effective exchange integral ‘J’ between the nearest neighbor Co2+ ions can be estimated using the equation Reference Kim, Kim, Kim, Ihm and Choo31 :
 $${J \over {{k_{\rm{B}}}}} = {{3\theta } \over {2zS\left( {S + 1} \right)}}\quad ,$$
where z is the number of the nearest neighbor cation (z = 14 for rutile structure), k B is the Boltzmann constant, and S = 3/2 for Co2+ ion. The value of J/k B was found to be −20 and −12 K, respectively. The negative values of θ and J indicated the presence of antiferromagnetic interactions between the Co2+ ions. Reference Liu, Zu and Zhou2,Reference Kim, Kim, Kim, Ihm and Choo31 The effective magnetic moments of Sn1−x Co x O2 (x = 0.05 and 0.10) were found to be 2.01 and 1.89 μB/Co2+, respectively, which decreases with increasing dopant ion concentration. This is attributed to the presence of antiferromagnetic coupling between nearest neighbor magnetic ions. Similar decrease in average magnetic moment per magnetic ion is also observed for Co-doped SnO2 synthesized by other chemical methods such as wet chemical and coprecipitation techniques. Reference Liu, Zu and Zhou2,Reference Bouaine, Brihi, Schmerber, Bouillet, Colis and Dinia4
The χM versus temperature curve for Sn0.85Co0.15O2 nanoparticles [Fig. 9(c)] is different from x = 0.05 and 0.10. A cant is seen at around 40 K, indicating the presence of antiferromagnetic ordering. This antiferromagnetic ordering may arise due to the presence of minute amount of Co3O4. In Co3O4, the Co3+ ions are nonmagnetic; therefore, all the magnetic moments come from Co2+.
IV. CONCLUSIONS
We have successfully synthesized monophasic Co-doped SnO2 (x = 0.05, 0.10, and 0.15) nanoparticles with tetragonal structure of size in the range of 8–13 nm by solvothermal method through oxalate precursor route. A considerable blue shift is observed with increasing Co content in SnO2 lattice site. High surface area of 194, 211, and 219 m2/g, respectively, has been achieved on increasing the Co concentration. Sn1−x Co x O2 (x = 0.05 and 0.10) nanoparticles showed paramagnetic behavior. The exchange coupling between Co ions is evaluated and found to be antiferromagnetic. Sn0.85Co0.15O2 solid solution revealed canted antiferromagnetic coupling.
ACKNOWLEDGMENTS
TA thanks CSIR, Govt. of India for financial support of the research project (No. 01(2448)/10EMR-II). SK thanks UGC and CSIR for research fellowships. The authors also thank Prof. K.V. Ramanujachary and Prof. S.E. Lofland, Rowan University, USA for magnetic measurements as well as for valuable discussions.