Introduction
The glycaemic index (GI) ranks food according to how they impact on blood glucose concentration immediately after consumption, with high GI foods causing a sharp increase in plasma glucose and low GI foods providing a more sustained glucose release.Reference Jenkins, Wolever and Taylor 1 Epidemiological and clinical studies have reported that prolonged consumption of a high GI diet is associated with insulin resistance and type 2 diabetes,Reference Salmerón, Ascherio and Rimm 2 , Reference Willett, Manson and Liu 3 while low GI diets improve insulin sensitivity and reduce body weight.Reference Frost, Keogh and Smith 4 , Reference Frost, Leeds and Trew 5 Experimental animal studies have also demonstrated that rats fed on low GI diets have a reduced body fat mass, improved glucose tolerance and reduced expression of lipogenic genes in the liver compared with those maintained on high GI diets.Reference Isken, Klaus and Petzke 6 – Reference Pawlak, Kushner and Ludwig 8
Epidemiological and experimental animal studies have demonstrated that exposure to an elevated glucose supply in utero, as a consequence of gestational diabetes or even mild impairments to maternal glucose tolerance, significantly increases the risk of the offspring developing obesity, type 2 diabetes and non-alcoholic fatty liver disease (NAFLD) in adult life.Reference Plagemann, Harder and Kohlhoff 9 – Reference Sobngwi, Boudou and Mauvais-Jarvis 11 This has led to suggestions that interventions that reduce maternal glucose concentrations and/or improve maternal glucose tolerance, including a low GI diet, may have beneficial effects on the long-term metabolic outcomes of the offspring. A small number of human studies have investigated the effects of low GI diets during pregnancy and lactation on infant outcomes.Reference Louie, Markovic and Perera 12 , Reference Moses, Casey and Quinn 13 However, while some studies have supported the potential benefits of a low GI diet in pregnancy for maternal and pregnancy outcomes, including a reduced risk of delivering a large for gestational age infant, no studies to date have evaluated the impact of this diet on the metabolic health of the offspring beyond the immediate postnatal period.Reference Louie, Brand-Miller and Markovic 14 In addition, whether the long-term metabolic effects of exposure to a low GI diet during the fetal and suckling periods are dependent on the GI of the diet consumed after weaning is also unknown.
Therefore, the aims of the present study were to use a rodent model to (1) compare the effects of maternal consumption of a low GI v. high GI diet during pregnancy and lactation on fat deposition, glucose tolerance, hepatic fat content and gene expression in the offspring at weaning and in young adulthood, and (2) determine whether the effects of maternal low GI diet consumption on young adult offspring differed according to whether the offspring were weaned onto a low GI or high GI diet.
Methods
Dams and feeding regime
This study was approved by the University of Adelaide Animal Ethics Committee. A total of 28 female Albino Wistar rats (~200 g) were brought into the animal facility and housed individually in a 12 h light/12 h dark cycle environment at a constant temperature of ~25°C. Rats were acclimatized to the environment for at least 1 week before the commencement of the experiment. During this time, they had free access to standard rodent chow (AIN93M; Specialty Feeds, Glen Forrest, Western Australia) and tap water.
Following acclimatization, rats were assigned to either the low GI (n=14) or high GI (n=14) group. The diets each group received were identical in appearance, energy content, macro- and micronutrient composition, the only difference being the carbohydrate type; in the low GI group the diet included carbohydrate in the form of Gel Crisp starch (Diet SF10-084) while in the high GI group the diet included carbohydrate in the form of dextrinised starch (Diet SF10-081). Both diets were manufactured by Specialty Feeds (Glen Forrest, Western Australia). A validated in vitro starch digestion assay was used as an indicator of the likely glycaemic response to each of the diets.Reference Englyst, Englyst and Hudson 15 At the 20 min time point, the amount of rapidly available glucose in the high GI feed was 56% higher than the low GI feed (P=0.006). Similarly, at 120 min of digestion, the amount of glucose released was 44% higher in the high GI feed (P=0.0006). In addition, an in vivo pilot study was undertaken in which we measured blood glucose concentrations in rats for 2 h after the consumption of either the high or low GI diet. The results obtained confirmed that the diets resulted in post-prandial glucose curves which were different and consistent with the profile expected for low and high GI foods (data not shown).
The diets were provided ad libitum and all rats had free access to water throughout the experiment. Female rats were fed their respective diets for a minimum of 4 weeks before mating and throughout pregnancy and lactation. Body weight was determined weekly during this time. Fresh food was provided every second day, and on each of these occasions, the remaining food was weighed and the weight subtracted from the amount provided at the start of the 2-day period to calculate food intake.
After 4 weeks, vaginal smears were performed daily to determine the stages of the estrous cycle. On the night of diestrous/proestrous the female rat was placed with a male (fed ad libitum on standard rodent chow) overnight. The presence of sperm in vaginal smears conducted the following morning was considered as confirmation of successful mating and designated as gestation day 0. A total of four males were used for mating and the same males were used for mating females in both the low GI and high GI groups in order to minimize the influence of paternal effects on offspring outcomes.
Offspring
Pups were born on day 21–22 of gestation. Within 24 h of birth (postnatal day 1), pups were culled to eight per litter, with four males and four females where possible. Pups were weighed on postnatal day 1 and every 2 days thereafter during the suckling period and were weaned on postnatal day 21. At the time of weaning, tissue was collected from one male and one female pup from each litter, remaining were group-housed with their same sex littermates (two animals per cage), and were provided with either the same diet as their mother or the alternate diet. This gave rise to four groups (1) offspring of low GI dams weaned onto the same low GI diet (L-L, n=14, seven males and seven females), (2) offspring of low GI dams weaned onto a high GI diet (L-H, n=14, seven males and seven females), (3) offspring of high GI dams weaned onto a low GI diet (H-L, n=14, seven males and seven females) and (4) offspring of high GI dams weaned onto a high GI diet (H-H, n=14, seven males and seven females). Food intake was determined every 2 days in all offspring and fresh food provided. Fresh water was available ad libitum. All offspring were weighed once per week from weaning until 12 weeks of age.
Intraperitoneal glucose tolerance test (IPGTT)
IPGTTs were performed after an overnight fast on dams at the end of lactation as well as on the offspring at 3 and 12 weeks of age. Baseline blood samples were collected from the tail vein and a glucose bolus (2 g/kg of 50% dextrose in sterile 0.9% saline) was then injected intraperitoneally. Blood samples were collected from the tail vein at 5, 10, 15, 30, 60 and 120 min following glucose delivery. Glucose concentrations were determined using a handheld Accu-Chek Performa glucometer (Accu-Chek Performa©, Roche, Germany) at each time-point.
Post-mortem and tissue collection
Post-mortem and tissue collection was conducted on dams after weaning on the day following the IPGTT and on one male and one female offspring per litter (selected at random) at weaning and one male and one female offspring per litter at 12 weeks of age. Dams and offspring were killed using an overdose of CO2 in the non-fasted state. Immediately after euthanasia, blood samples were collected via cardiac puncture into heparinized tubes and centrifuged at 3500 g at 4°C for 15 min. The plasma was collected and stored at −20°C for subsequent analyses of hormone and metabolite concentrations. Body weight, length (nose to tail) and abdominal circumference were determined. All internal organs were weighed and all visible fat depots, including omental fat, retroperitoneal fat, gonadal fat, subcutaneous fat and interscapular fat, were dissected to determine the weights of the individual depots. The weights of omental, retroperitoneal and gonadal fat were added together to determine visceral fat mass, and the weights of all individual fat depots were added together to determine total body fat mass. The weights of all fat depots were expressed relative to body weight. At both weaning and 12 weeks of age, a sample of liver (from the same site in each animal) was snap frozen in liquid nitrogen and stored at −80°C for subsequent analysis of lipid content and gene expression.
Hepatic lipid content, RNA extraction and gene expression analysis
Total hepatic lipid content was determined gravimetrically following homogenization and extraction of 200 mg of frozen tissue in chloroform-methanol (2:1, v/v) as previously described.Reference Tu, Cook-Johnson and James 16 , Reference Bligh and Dyer 17 Total mRNA was extracted from the liver using Trizol reagent (Invitrogen Australia, Mount Waverley, VIC, Australia), purified using an RNeasy Mini kit (Qiagen Australia, Doncaster, VIC, Australia) and cDNA synthesized using Superscript III reverse transcriptase (Invitrogen Australia) and random hexamers.
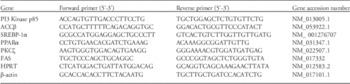
Quantitative real time PCR was performed using the SYBR green system on the Applied Biosystems ViiA 7 Real Time PCR machine (Applied Biosystems, Foster City, CA, USA). The target genes included key genes involved in hepatic lipid metabolism and insulin signalling: acetyl-CoA carboxylase (ACC), peroxisome proliferator activated receptor-α (PPARα), sterol regulatory element binding protein-1α (SREBP1α), fatty acid synthase (FAS), the phosphatidylinositol 3-kinase regulatory p85 subunit (PI3K-p85) and phosphokinase C-ζ (PKCζ), all of which have been implicated in NAFLD.Reference Savage and Semple 18 , Reference Utzschneider and Kahn 19 The primers were designed using the Primer3 and NCBI websites, with all primers crossing exon–exon boundaries to prevent annealing to genomic DNA. All primers were validated for use in our laboratory by running the PCR product on a gel to confirm amplicon size as well as sequencing to ensure the correct gene was amplified. Primer sequences are shown in Table 1. The expression of target genes was quantified relative to the housekeeper genes β-actin and HPRT, using the Applied Biosystems Data Assist software (Applied Biosystems). Two quality controls as well as a negative RT control were used on each 96-well plate to ensure inter-plate consistency and melt curves were obtained at the end of each run to confirm amplicon heterogeneity.
Primer sequences for determination of hepatic gene expression

Plasma hormone and metabolite assays
Plasma glucose, alanine amino transferase (ALT), uric acid, total cholesterol, HDL cholesterol (Thermo Electron, Pittsburgh, PA, USA), and NEFA (WAKO Pure Chemical Industries Ltd., Osaka, Japan) were determined using a Konelab 20X (Thermoscientific, Vantaa, Finland). Plasma leptin and insulin concentrations were measured using commercially available immunoassay kits (Crystal Chem Inc., Downers Grove, IL, USA and ALPCO Diagnostics, Salem, NH, USA). All assays were conducted in accordance with the manufacturer’s instructions and intra- and inter-assay coefficients of variation were always <10%.
Statistical analyses
Data are presented as mean±s.e.m. The dam (litter) was used as the unit of analysis in all statistical tests. A power analysis was conducted to determine sample size using changes in fat mass as the primary outcome. The effect of the low or high GI diet in the dams and pre-weaning offspring was determined using a Student’s unpaired t-test. The area under the curve (AUC) for glucose following the IPGTT was calculated for each animal using the incremental AUC method. The relative effects of exposure to maternal low GI diet or high GI diet and exposure to the diets after weaning were analysed using a two-way ANOVA. When a significant interaction between maternal diet and post-weaning diet was identified, all groups were analysed together using a one-way ANOVA and Tukey’s post-hoc analysis. Differences in the effects of the low GI and high GI diets over time were analysed using a repeated measures ANOVA. Male and female offspring were analysed separately for all measures. Repeated measures ANOVAs were performed using Stata 11 (StataCorp LP, TX, USA). All other analyses were performed using SPSS for Windows Version 19.0 (SPSS Inc., Chicago, IL, USA). A probability of P<0.05 was considered statistically significant.
Results
Maternal outcomes
Food intake and body weight
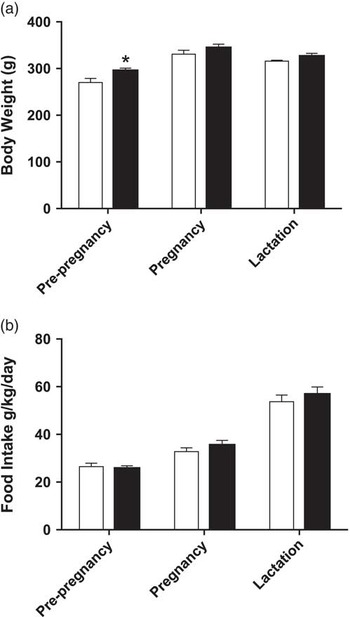
Body weights were not different between dams assigned to the low GI and high GI diets at the commencement of the experimental diets (high GI, 244.1±5.4 g; low GI, 257.9±6.4 g, P=0.11). However, at the time of mating (i.e. ~4 weeks after commencement of the experimental diets), dams in the low GI group were heavier than those in the high GI group (Fig. 1a, P<0.05). There was no difference, however, in the average body weight during pregnancy or at the end of lactation (Fig. 1a), and low GI dams gained less weight during pregnancy than the high GI dams (high GI, 116.3±5.1 g; low GI, 90.9±8.6 g, P<0.05). There was also no difference in maternal food intake between groups either before mating, during pregnancy or during lactation (Fig. 1b).
(a) Average maternal body during pre-pregnancy (4 weeks after the commencement of the diets), pregnancy and lactation in high glycaemic index (GI) (open bar, n=14) and low GI dams (closed bar, n=14), *P<0.05. The average body weight is calculated based on the weekly body weights recorded within each time period. (b) Maternal food intake during pre-pregnancy, pregnancy and lactation in high GI (open bar, n=14) and low GI dams (closed bar, n=14). Food intake was measured every two days throughout the experiment and the data was normalised to body weight. Data presented as mean±s.e.m., statistical analysis done using a Student’s unpaired t-test.

Fat mass
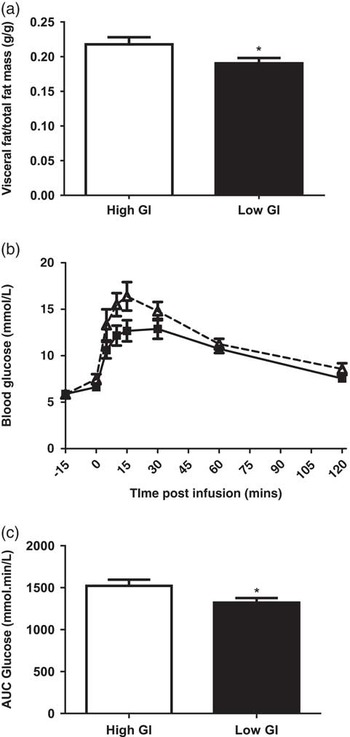
At the end of lactation, low GI dams had a higher abdominal circumference (high GI, 17.8±0.3 cm; low GI 19.3±0.4 cm, P<0.05) and higher gastrointestinal tract mass relative to body weight compared with high GI dams (high GI 8.7±0.6%; low GI 11.6±0.7%, P<0.01). There were no differences in the total percentage body fat or the weight of any of the individual fat depots between the low GI and high GI groups (Supplementary material Table 1). However, GI dams had a lower amount of visceral fat as a proportion of their total fat mass compared to the high GI dams (Fig. 2a, P<0.05).
(a) The relative proportion of visceral fat at the end of lactation in high glycaemic index (GI) (open bar, n=14) and low GI dams (closed bar, n=14), *P<0.05. (b) Maternal glucose concentrations during an IPGTT in low GI (filled squares, solid line, n=14) and high GI (open triangles, dashed line, n=14) dams at the end of lactation. Low GI dams had a lower peak in glucose (P<0.05). (c) Glucose tolerance was better in low GI compared to high GI dams as indicated by lower AUC and lower peak plasma glucose concentrations during the intraperitoneal glucose tolerance test (IPGTT) (P<0.05). Data presented as mean±s.e.m., statistical analysis done using a Student’s unpaired t-test.

Glucose tolerance and plasma measures
There was no difference in fasting glucose levels between low GI and high GI dams before the administration of the glucose bolus (high GI, 5.9±0.3 mmol/l; low GI, 5.9±0.2 mmol/l, P=0.19). The low GI dams also had a lower peak glucose following intraperitoneal glucose administration (Fig. 2b, P<0.05) and a lower glucose AUC during the IPGTT compared to the high GI group (Fig. 2c, P<0.05). There were no differences in the plasma concentrations of insulin, glucose, NEFA or leptin between low GI and high GI dams at the time of post-mortem (Supplementary material Table 1).
Offspring outcomes birth to weaning
Growth from birth to weaning
There was no difference in birth weight between the low GI and high GI groups in either females or males (females: high GI, 6.1±0.1 g; low GI, 6.1±0.2 g, P=0.93; males: high GI, 6.2±0.3 g; low GI, 6.5±0.3 g, P=0.43). Weight gain during the suckling period between groups was also comparable (male F=1.74, P=0.26 and female F=1.09, P=0.31) and there was no difference in body weight at weaning (3 weeks of age) (females: high GI, 42.6±1.8 g; low GI, 43.3±1.5 g, P=0.99; males: high GI, 44.4±1.9 g; low GI, 45.3±1.5 g, P=0.70).
Fat mass at 3 weeks of age
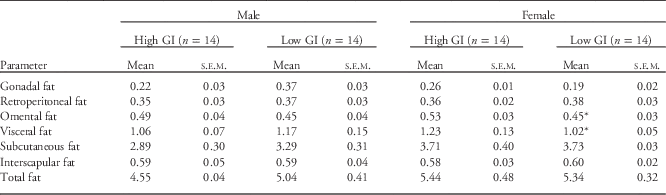
In female offspring relative omental fat mass (P<0.05) and the total relative mass of visceral fat (P<0.05) at 3 weeks of age were both significantly reduced in the low GI group compared to the high GI group (Table 2). Individual weights of other fat depots and total relative body fat mass were not different (Table 2). In male offspring, there were no differences between groups in either total or relative fat mass at this time (Table 2).
Fat mass as % body weight in male and female offspring of high and low GI dams at 3 weeks of age
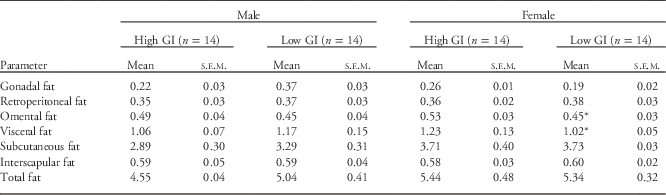
Data presented as mean±s.e.m.
*Significantly different mean between groups within each sex, P<0.05.
Glucose tolerance and plasma measures at 3 weeks of age
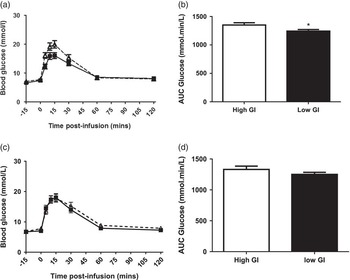
At 3 weeks of age, female offspring of low GI dams had a lower peak plasma glucose post intraperitoneal glucose administration (Fig. 3a, P<0.01) and a lower glucose AUC during the glucose tolerance test compared to female high GI offspring (Fig. 3b, P<0.05). There was no difference in peak glucose or the glucose AUC in males (Fig. 3c and 3d, P=0.59).
(a) Blood glucose concentrations during an intraperitoneal glucose tolerance test (IPGTT) in female offspring of low glycaemic index (GI) (filled squares, solid line, n=14) and high GI (open triangles, dashed line, n=12) dams at the end of lactation. Female low GI offspring had a significantly lower peak in glucose (P<0.05). (b) Glucose tolerance was better in low GI compared to high GI female offspring as indicated by lower AUC and lower peak plasma glucose concentrations during the IPGTT (P<0.05). (c) Blood glucose concentrations during an IPGTT in male offspring of low GI (filled squares, solid line, n=14) and high GI (open triangles, dashed line, n=12) dams at the end of lactation. (d) No difference in glucose tolerance as indicated by AUC was observed between low GI and high GI male offspring. Data presented as mean±s.e.m., statistical analysis done using a two-way ANOVA within each sex.

In females, non-fasting glucose concentrations at 3 weeks of age were lower in the low GI compared to the high GI group (high GI 11.62±0.45 mmol/l; low GI 9.90±0.39 mmol/l, P<0.05). There were no differences in glucose concentrations between groups in male offspring or in plasma NEFA, cholesterol, insulin or leptin concentrations in either females or males (Supplementary material Table 2).
Hepatic lipid content and gene expression at 3 weeks of age
Relative liver weights were not different between the low GI and high GI groups in either male (high GI 4.00±0.10%; low GI 4.01±0.06%, P=0.97) or female (high GI, 3.89±0.07%; low GI 3.91±0.09%, P=0.54) offspring. However, male offspring of low GI dams had a lower hepatic fat content as a percentage of liver weight compared to high GI males (high GI 6.35±0.50%; low GI 4.07±0.40%, P<0.05). There was no difference in liver fat percentage in females (high GI 6.13±0.84%; low GI 6.67±1.06%, P=0.29).
Plasma concentrations of uric acid and ALT, both established biomarkers of liver function, were not different between low and high GI groups in either males or females. Hepatic expression of key genes involved in lipogenesis and insulin signalling (ACCβ, PPARα, SREBP1α, FAS, PI3K-p85 and PKCζ) was also not different between the low GI and high GI groups in either males or females (Supplementary material Table 4).
Offspring outcomes: post weaning
Food intake and growth
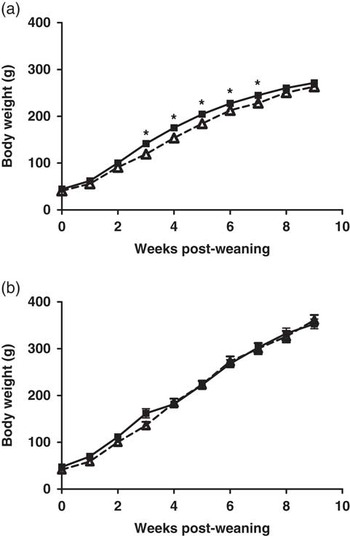
There was no difference in food intake during the post-weaning period between offspring of low GI and high GI dams (data not shown). In female offspring, the rate of weight gain from weaning to 12 weeks of age was higher in offspring of low GI dams, independent of the post weaning diet (F=5.14, P<0.01), and these offspring were heavier between 6 and 10 weeks of age, although not at 12 weeks of age, compared to offspring of high GI dams (Fig. 4a). There were no differences between groups in body weight in male offspring at any time after weaning (Fig. 4b).
Weight gain from weaning to 12 weeks of age in (a) female and (b) male offspring of low glycaemic index (GI) (filled squares, solid line) and high GI (open triangles, dashed line) dams. *P<0.05 compared to the high GI group, n=14 for all groups. Data presented as mean±s.e.m., statistical analysis done using a repeated measures ANOVA within each sex.

Fat mass at 12 weeks of age
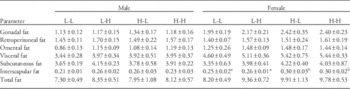
In females, relative interscapular fat mass was significantly lower in offspring of low GI dams, independent of their post-weaning diet (P<0.05, Table 3), however the relative mass of other individual fat depots and the relative visceral and total fat mass were not different. In males, there was no difference in total fat mass or the relative weight of any of the individual fat depots between groups (Table 3).
Weights of individual fat depots and visceral and total fat mass as a percentage of body weight in the male and female offspring of high GI and low GI dams fed a low or high GI diet at 12 weeks of age

Data are presented as mean±s.e.m. n=7 per sex for all groups. Different letters denote significantly different means within each sex, P<0.05.
Glucose tolerance and plasma hormone concentrations at 12 weeks of age
In female offspring, there was an interaction between the effects of the maternal and post-weaning diets in relation to glucose tolerance at 12 weeks of age. Thus, offspring of high GI dams tended to have lower glucose tolerance if they were weaned onto a low GI diet compared to if they were weaned onto a high GI diet (AUC[glucose], H-L, 1797±194 v. H-H 1346±97 mmol min/l, P<0.07). However, no statistical difference was observed when the interaction was explored by using a one-way ANOVA with post-hoc analysis. There were no differences in plasma glucose, NEFA, leptin or total cholesterol concentrations at 12 weeks of age in either males or females (Supplementary material Table 3).
Hepatic lipid content and gene expression at 12 weeks of age
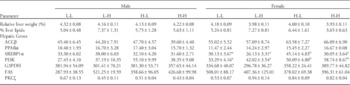
There was no difference between groups in relative liver weight or liver fat content in either male or female offspring at 12 weeks of age (Table 4). In females, offspring of low GI dams had increased plasma ALT concentrations in comparison with offspring of high GI dams, independent of their post-weaning diet (low GI 130.75±53.15 IU/l v. high GI 15.75±5.02 IU/l, P<0.05).
Relative liver weight (as a % of body weight), % liver lipids and mean normalised expression of hepatic genes in male and female offspring of high GI and low GI dams fed a low or high diet at 12 weeks of age

Data are presented as mean±s.e.m. n=7 per sex for all groups. Values for gene expression data have been multiplied by one thousand for ease of presentation. Different letters denote significantly different means within each sex, P<0.05.
In females, hepatic PI3K-p85 mRNA expression at 12 weeks of age was lower in offspring of low GI mothers, independent of the post-weaning diet (P<0.05, Table 4). SREBP1α mRNA expression at 12 weeks of age was higher in offspring of high GI dams who were weaned onto the low GI diet compared to all other groups (P<0.05, Table 4). There was no effect of either the maternal or post-weaning diet on hepatic mRNA expression of PI3K-p85 or SREBP1α in males on in ACC, PPARα, PKCζ or FAS in either male or female offspring (Table 4).
Discussion
This study was the first to directly compare the effect of a maternal high v. low GI diet on offspring and maternal metabolic outcomes beyond the immediate postnatal period. We showed for the first time that consuming a low GI diet pre-pregnancy and throughout pregnancy and lactation reduces visceral adiposity and increases glucose tolerance in female offspring at 3 weeks of age, and lowers female hepatic PI3K expression at 12 weeks. We also identified significant interactions between the maternal and post-weaning diet such the female offspring of high GI dams switched to a low GI diet had higher hepatic SREBP1α expression as adults. By examining the effect of high and low GI diets on gene expression and metabolic outcomes in the mother and offspring, this study provides a solid foundation for continuing investigations on the mechanisms underlying the effects of reducing the GI of the maternal diet on the metabolic health of the offspring.
Maternal outcomes
The increase in body weight we identified in the dams consuming the low GI diet before mating was unexpected given previous reports of low GI diets increasing satiety, lowering food consumption and reducing weight gain.Reference Brand-Miller 20 – Reference Holt and Miller 22 We consider it likely, however, that our results were biased by the fact that body weights were not recorded in the fasting state, since low GI diets are known to increase the weight of the large bowel and caecum.Reference Holt and Miller 22 In line with this the weight of the gastrointestinal tract at post-mortem was ~10 g heavier in the low GI compared to high GI dams, and if this value was subtracted from the pre-pregnancy weights of the low GI dams then the difference between groups was no longer significant. In support of this, despite the increase in pre-mating body weight we found no difference in total fat mass between the low GI and high GI dams at the end of lactation. Interestingly, however, the low GI diet appeared to affect fat distribution, since the dams fed the low GI diet had a lower ratio of visceral to total fat mass than their high GI counterparts. This is consistent with previous studies in non-pregnant adults, which reported that low GI diets preferentially enhance the mobilization of visceral compared with subcutaneous fat.Reference Stevenson, Williams and Nute 23 , Reference Lopes da Silva and de Cassia Goncalves Alfenas 24
Growth and metabolic outcomes in the offspring at weaning
A key finding of the current study was that maternal consumption of a low GI diet reduced visceral adiposity, lowered plasma glucose concentrations and increased glucose tolerance in female, but not male offspring at weaning. While the mechanisms behind this remain unclear, one possibility is that the exposure to lower glucose concentrations as result of higher glucose tolerance during the development of adipose depots ‘programmed’ a reduced lipogenic capacity in visceral adipocytes. This hypothesis is indirectly supported by a study in sheep which demonstrated that exposure to elevated glucose concentrations in utero is associated with a precocial up-regulation of lipogenic genes in the main visceral adipose depot of the fetus.Reference Muhlhausler, Duffield and McMillen 25 However, further studies will be required to test this directly. While male offspring of low GI dams did not exhibit any differences in body fat mass or glucose tolerance, they did have reduced hepatic lipid content. The functional significance of this is not clear, however, since it did not translate into alterations in hepatic gene expression or circulating of biomarkers liver function, and was no longer present at 12 weeks of age, even when offspring were maintained on the low GI diet after weaning.
Growth and metabolic outcomes in the offspring in young adulthood
Interestingly, and contrary to expectations, female offspring of low GI dams exhibited a phase of accelerated weight gain after weaning, independent of their post-weaning diet. This was particularly unexpected given the reduced gestational weight gain in low GI dams, which is generally associated with improved metabolic outcomes in the offspring.Reference Crane, White and Murphy 26 , Reference Kiel, Dodson and Artal 27 The period of increased body in the current study coincided with the timing of puberty – a period associated with a marked increase in secretion of gonadotrophin-releasing hormones and estrogen and increased body fat accrual.Reference Ojeda, Urbanski and Ahmed 28 One possibility, therefore, is that this period of accelerated growth may be the result of an interaction between the effects of sex hormones and programmed changes in other insulin-responsive tissues, such as the skeletal muscle, induced by exposure to a maternal low GI diet. While it is possible that the higher body weight of the low GI dams at mating may have contributed to this increased body weight, this appears unlikely given that there were no differences in birth weight between the low and high GI pups, and that maternal weight for the majority of pregnancy was not different between groups.
The higher SREBP1α mRNA expression in female offspring of high GI dams provided with a low GI diet after weaning may be indicative of an increased propensity for excess hepatic lipid storage, since SREBP1α activation is associated with the up-regulation of hepatic lipogenesis.Reference Li, Monks and Ge 29 – Reference Puigserver, Rhee and Donovan 31 The fact that SREBP1α expression was increased in offspring of high GI dams that were switched to a low GI diet after weaning, but not in those who continued to consume the high GI diet, suggests that this may have been driven by a ‘mis-match’ between the nutritional environment experienced pre- and post-weaning. The concept of a mis-match between the environment experienced in postnatal life compared to the environment ‘predicted’ by the perinatal nutritional experience being associated with an increased risk of disease in postnatal life, including metabolic disease, is well described, however this is the first time it has been described in the context of switching from a high to low GI diet.Reference McMillen, Adam and Muhlhausler 32
We also observed a reduced expression of PI3K-p85 mRNA in female offspring of low GI dams at 12 weeks of age, independent of the post-weaning diet. PI3K plays a key role in the response of the liver to insulin, as part of the PI3K/Akt axis, and activation of this kinase suppresses gluconeogenesis and promotes glycogen/lipid synthesis and cell growth.Reference Taniguchi, Tran and Kondo 33 – Reference Harris and Lawrence 35 Consequently, the lower PI3K mRNA expression would be expected to reduce insulin-stimulated hepatic lipogenesis, and therefore has the potential to inhibit hepatic fat storage in response excess energy intake. In light of this finding, further studies focussed on the effect of maternal low GI diets on the expression, protein abundance and activity of key components of the insulin signaling pathway, and on the impact of obesogenic diets on hepatic lipid storage are warranted, and will provide clearer insights into the potential longer-term benefits of maternal low GI diets on hepatic function in the offspring.Reference Chuang, Yang and Tsai 36 Furthermore, the reduction in PI3K is also difficult to reconcile with the elevated plasma ALT concentrations which were also present in female offspring of low GI dams in young adulthood, since this is generally considered to be a marker of poorer hepatic function. However, studies relating ALT levels to hepatic function are generally restricted to adult humans, and the reliability as an indicator of hepatic function in the perinatal period and/or in rodents is not clear.
Perspectives and significance
The present study is the first to directly compare the effect of a maternal high v. low GI diet on offspring metabolic outcomes beyond the immediate postnatal period. We demonstrated that consumption of a low GI diet during pregnancy and lactation led to increased glucose tolerance in the dam as well as reduced visceral adiposity and increased glucose tolerance in the female offspring at weaning. The long-term impact of the GI of the maternal diet on the offspring was less clear; however the results did indicate a potential benefit of maternal low GI diet consumption for reducing hepatic lipid synthetic capacity in female offspring, by reducing the expression of PI3K in early adulthood. The increase in SREBP1α in the female offspring of high GI dams switched to a low GI diets, however suggests the existence of a complex relationship between nutritional exposures pre- and post-weaning, which will need to be further explored in future studies. Nevertheless, the results of the present study provide an important foundation for future studies aimed at determining whether the changes in glucose tolerance, fat deposition and hepatic gene expression associated with maternal low GI diet consumption can translate into an improved capacity of the offspring of low GI dams to resist metabolic challenges later in life.
Acknowledgements
The authors wish to acknowledge the assistance of Cecile Vincent, Audrey Blain, Claire Vitry and Bridget Vu with animal studies and John Carragher and Karri Billing for editorial assistance.
Financial Support
This study was funded by a research grant from the Channel 7 Children’s Health Research Foundation. BSM is supported by a Career Development Award from the National Health and Medical Research Council of Australia (NHMRC, ID: APP1004211). M.A. was supported by an Aus-Aid scholarship.
Conflicts of Interest
J.B.M. is the President of the GI Foundation (www.gisymbol.com), a not-for-profit entity that endorses healthy low GI foods. She manages a GI testing service at the University of Sydney (www.glycemicindex.com) and is the co-author of lay books about the glycemic index of foods. The other authors have no conflicts to declare.
Ethical Standards
The authors assert that all procedures contributing to this work comply with the ethical standards of the relevant national guides on the care and use of Albino Wistar Rats and has been approved by The University of Adelaide Animal Ethics Committee.
Supplementary Material
To view supplementary material for this article, please visit http://dx.doi.org/10.1017/S2040174415007965