Semantic memory is generally conceptualized as nontemporally encoded world knowledge, knowledge of facts and things. It is often distinguished from episodic memory, knowledge of events that are temporally coded. Semantic memory includes knowledge of objects and words and their meanings. Observations of individuals with acquired brain injuries have revealed deficits within circumscribed subcategories of words and objects. In particular, some patients display an impairment for knowledge of living things such as animals and fruits/vegetables, whereas knowledge of nonliving things is relatively intact (for a review, see Capitani, Laiacona, Mahon, & Caramazza, Reference Capitani, Laiacona, Mahon and Caramazza2003). This has led to the proposal that some objects and classes of objects are differently weighted in terms of their dependence on sensory features (e.g., an object's visual characteristics) versus functional features (e.g., an object's use) within semantic memory (Warrington & Shallice, Reference Warrington and Shallice1984).
Theories that propose semantic memory representations are made up of features represent a dominant approach to the nature of organization within semantic memory (Borgo & Shallice, Reference Borgo and Shallice2003; Martin & Caramazza, Reference Martin and Caramazza2003). Most models incorporate some sort of domain-based principle, proposing that living things and nonliving things differ in their feature profiles (Devlin, Gonnerman, Andersen, & Seidenberg, Reference Devlin, Gonnerman, Andersen and Seidenberg1998; Durrant-Peatfield, Tyler, Moss, & Levy, Reference Durrant-Peatfield, Tyler, Moss and Levy1997; Farah & McClelland, Reference Farah and McClelland1991; Gonnerman, Andersen, Devlin, Kempler, & Seidenberg, Reference Gonnerman, Andersen, Devlin, Kempler and Seidenberg1997; Tyler & Moss, Reference Tyler and Moss2001; Tyler, Moss, Durrant-Peatfield, & Levy, Reference Tyler, Moss, Durrant-Peatfield and Levy2000; Warrington & McCarthy, Reference Warrington and McCarthy1987; Warrington & Shallice, Reference Warrington and Shallice1984). For example, mammals are differentiated by perceptual features such as size, shape, color, and the sound they make (contrast cats and dogs), whereas nonliving things are differentiated by their function (contrast forks and knives). Categories are seen as an emergent property of statistical relations, such as feature correlation and distinctiveness, within the feature-based system rather than serving as the causal element in an inherently category-based system of organization. Statistical feature-based models predict a difference in feature-profiles between living and nonliving things, with homogeneity within domains and heterogeneity across domains.
In contrast to the feature models are the sensorimotor-based models. These include the sensorimotor model (Martin, Reference Martin, Jablonski and Aiello1998; Martin, Ungerleider, & Haxby, Reference Martin, Ungerleider, Haxby and Gazzaniga2000) and Barsalou's Perceptual Symbols Systems (Barsalou, Reference Barsalou1999). Instead of proposing living versus nonliving differences, these models propose that semantic knowledge is based on sensorimotoric interaction with objects. This type of model makes no specific predictions about within-domain homogeneity and cross-domain segregation, but leaves open the possibility of cross-domain similarities and within-domain differences.
Empirical investigations of the featural basis of semantic memory have often been based on feature generation tasks. In a feature generation task, participants are asked to list features for a set of items. The features are then labeled according to feature type and/or feature property and tallied for comparison. Feature generation tasks have been used extensively to gather data to show how categories (living and nonliving things) can emerge from similarities in feature structures (Devlin et al., Reference Devlin, Gonnerman, Andersen and Seidenberg1998; Farah & McClelland, Reference Farah and McClelland1991; Garrard, Lambon-Ralph, Hodges, & Patterson, Reference Garrard, Lambon-Ralph, Hodges and Patterson2001; Harley & Grant, Reference Harley and Grant2004; McRae, de Sa, & Seidenberg, Reference McRae, Sa and Seidenberg1997; McRae, Cree, Seidenberg, & McNorgen, Reference McRae, Cree, Seidenberg and McNorgan2005; Tyler et al., Reference Tyler, Moss, Durrant-Peatfield and Levy2000; Vanoverberghe & Storms, Reference Vanoverberghe and Storms2003, Ventura, Morais, Brito-Mendes, & Kolinsky, Reference Ventura, Morais, Brito-Mendes and Kolinsky2005; Vinson, Vigliocco, Cappa, & Siri, Reference Vinson, Vigliocco, Cappa and Siri2003). Farah and McClelland (Reference Farah and McClelland1991) and Devlin et al. (Reference Devlin, Gonnerman, Andersen and Seidenberg1998) showed that perceptual features were given in greater number compared to functional features for living things. This perceptual to functional feature ratio was much lower for nonliving things, showing a more even distribution of perceptual and functional features. More complex patterns in which the living and nonliving domains were differentiated by interactions of feature types and feature properties have also been reported (Garrard et al., Reference Garrard, Lambon-Ralph, Hodges and Patterson2001; Harley & Grant, Reference Harley and Grant2004; McRae et al., Reference McRae, Sa and Seidenberg1997; Tyler et al., Reference Tyler, Moss, Durrant-Peatfield and Levy2000, Vanoverberghe & Storms, Reference Vanoverberghe and Storms2003; Ventura et al., Reference Ventura, Morais, Brito-Mendes and Kolinsky2005; Vinson et al., Reference Vinson, Vigliocco, Cappa and Siri2003).
The validity of the feature generation task in providing a window on the underlying representations and structures of semantic memory has not been adequately explored. One shortcoming of feature generation tasks is that they may be biased for easily verbalized features, resulting in feature profiles for items that may not be representative of the multisensory representation in semantic memory. For example, the feature-profile for “banana” may include encyclopedic <tropical fruit>, functional <is eaten>, and visual <is yellow> features. This information may be relatively easy to verbalize in comparison to auditory, gustatory, and olfactory features (J. Lawler, personal communication). Although a banana has a very specific flavor, the description of that flavor in ordinary English vocabulary is not easily verbalizable.
In addition, the vagueness of the label “functional” has led to discrepancies between researchers in the definition of this class. Functional features are generally defined as “what the object does or is used for” (Garrard et al., Reference Garrard, Lambon-Ralph, Hodges and Patterson2001; Harley & Grant, Reference Harley and Grant2004; McRae et al., Reference McRae, Sa and Seidenberg1997; Vinson et al., Reference Vinson, Vigliocco, Cappa and Siri2003). However, functional features have also been described as any feature that is not perceptual (Caramazza & Shelton, Reference Caramazza and Shelton1998; Farah & McClelland, Reference Farah and McClelland1991; Ventura et al., Reference Ventura, Morais, Brito-Mendes and Kolinsky2005) or a “biological function” such as “breathes” (Tyler et al., Reference Tyler, Moss, Durrant-Peatfield and Levy2000; Vanoverberghe & Storms, Reference Vanoverberghe and Storms2003). Differences in feature-type taxonomies may also contribute to discrepant results between laboratories. For example, Pillon and Sampson (Reference Pillon and Samson2001) pointed out that a feature such as “moves by jumping” could be a visual or functional feature depending on the criteria used.
A common assumption within feature generation studies is that differences exist in the feature-type profiles of living and nonliving things, in other words, the domain principle is assumed. Within this framework, the feature data for animals and fruits/vegetables are frequently combined to form the living things category and data for tools and vehicles are frequently combined to form the nonliving things category (Farah & McClelland, Reference Farah and McClelland1991; Garrard et al., Reference Garrard, Lambon-Ralph, Hodges and Patterson2001; Harley & Grant, Reference Harley and Grant2004; McRae et al., Reference McRae, Sa and Seidenberg1997; Tyler et al., Reference Tyler, Moss, Durrant-Peatfield and Levy2000; Vanoverberghe & Storms, Reference Vanoverberghe and Storms2003; Ventura et al., Reference Ventura, Morais, Brito-Mendes and Kolinsky2005). Subsequent analysis then compares the composite feature profiles for living versus nonliving things, limiting interpretations to cross-domain differences. Thus, there is an automatic assumption of within-domain homogeneity and cross-domain segregation. The assumptions that underlie these methods are at odds with the case study literature, in which category-specific impairments are not always clearly delineated along living and nonliving domains (Borgo & Shallice, Reference Borgo and Shallice2001; Siri, Kensinger, Cappa, Hood, & Corkin, Reference Siri, Kensinger, Cappa, Hood and Corkin2003; Warrington & McCarthy, Reference Warrington and McCarthy1987, Warrington & Shallice, Reference Warrington and Shallice1984, Yamadori & Albert, Reference Yamadori and Albert1973). Borgo and Shallice (Reference Borgo and Shallice2001) presented patient MU who showed impaired knowledge for living things, materials (e.g., textiles and other materials such as wood), foods, and liquids. Another study (Siri et al., Reference Siri, Kensinger, Cappa, Hood and Corkin2003) reported a patient with impaired knowledge of fruits, vegetables, and musical instruments and variable performance for animals and birds.
The current study investigated whether sensorimotoric experience follows categorical principles of “living” versus “nonliving” in semantic memory. This was achieved by cross-domain comparisons (living vs. nonliving) and also within-domain comparisons of perceptual feature profiles derived from a feature generation task and a perceptual modality rating task, in which participants rated their perceptual knowledge of objects. The comparison of feature generation and rating data allowed us to document the stability of feature profiles across two tasks. If both experiments showed within-domain homogeneity and cross-domain segregation, then this might provide support for models of semantic memory that propose a domain principle in the organization of semantic knowledge. If, however, the experiments showed within-domain differences, and cross-domain similarities, then this would support models that do not make any specific predictions about domains.
EXPERIMENT 1: FEATURE GENERATION TASK
Method
Participants. Sixty participants (30 females, 30 males) between the ages of 18 and 30 years (mean = 22 years) were recruited from the University of Sheffield via an e-mail distribution list. All participants gave written, informed consent prior to taking part in the experiments. Approval for this study was given by the Department of Human Communication Sciences Research Ethics Committee, University of Sheffield.
Stimuli. Test items were selected from the verbal labels from the Snodgrass and Vanderwart (Reference Snodgrass and Vanderwart1980) picture set. Test items belonged to one of four categories. The categories of animals, fruits/vegetables, tools, and vehicles were selected because they are the commonly studied living (animals, fruits/vegetables) and nonliving (tools, vehicles) categories in the cognitive neuropsychology literature (Capitani et al., Reference Capitani, Laiacona, Mahon and Caramazza2003). For animals, fruits/vegetables, and tools, there were 10 items and 8 items for vehicles. The item set in this study is comparable to other studies in terms of total number of items used (Harley & Grant, Reference Harley and Grant2004; Vanoverberghe & Storms, Reference Vanoverberghe and Storms2003) and in terms of number of items per category (Devlin et al., Reference Devlin, Gonnerman, Andersen and Seidenberg1998; Garrard et al., Reference Garrard, Lambon-Ralph, Hodges and Patterson2001; Ventura et al., Reference Ventura, Morais, Brito-Mendes and Kolinsky2005). Items did not differ significantly for familiarity according to ratings established by Barry, Morrison, and Ellis (Reference Morrison, Chappell and Ellis1997), χ2 (3) = 2.423, p = .489. See Appendix A for the list of items and familiarity ratings.
Procedure. To minimize response fatigue due to the repetitive nature of the tasks, stimuli were divided into two sets, each including one category of living and one category of nonliving things. Each set was tested using an independent group of participants. Group 1 was tested with items from the categories animals (living) and tools (nonliving). Group 2 was tested with items from fruits/vegetables (living) and vehicles (nonliving). Participant groups were matched for sex and age, and order of item presentation was randomized for each participant.
Each item was read aloud to participants who were instructed to “list as many features or characteristics [they] could think of for each item.” Features were defined as short descriptive words or phrases. In order not to prime participants’ responses, participants were not asked to list any specific type of feature, such as perceptual and functional, and no example features were given. Responses were audio-recorded on a minidisk (Sony portable minidisk recorder MZ-B3) and participants were given 20 s to respond to each item. Twenty seconds allowed time for participants to exhaust their “search” for features. Two sample feature transcripts are given in Appendix B. The oral task and time limit for responses were used to prevent participants from using meta-cognitive search strategies, which may be used in written tasks especially in which participants have unlimited time to respond. Prior to testing, two practice items were administered to ensure understanding of the task and familiarity with the time limit.
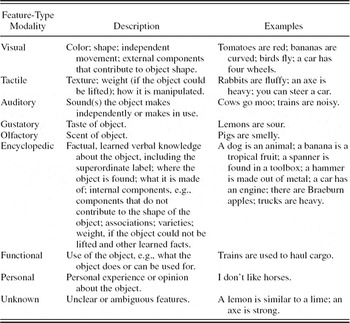
Data analysis. Responses were transcribed from minidisk then categorized into perceptual, encyclopedic, and functional feature types. See Table 1 for a description and examples of each feature type used in this taxonomy.
Taxonomy used for feature classification

To standardize analyses across categories, data for two items from the animal, fruit/vegetable, and tool categories were removed (elephant, monkey, corn, pineapple, axe, and chisel) so that all categories included data from eight items. Selection of items for removal was based on familiarity ratings; data for two items with the lowest familiarity ratings were removed from each category. Familiarity ratings remained comparable as indicated by the lack of significant difference across categories, χ2 (3) = 2.666, p = .446.
Each feature was classified according to one feature-type label. For adjective–noun phrases, if the complex of features described a single perceptual modality, it was classified as one feature and if it described more than one modality, it was classified accordingly. For example “has a long tail” was analyzed as one feature (a visual, shape related feature), whereas “has a fluffy tail” was analyzed as two features (tail: a visual, shape related feature; fluffy: a tactile, texture related feature).
Ambiguous features made up 1.4% of the total features given. Seventy-one percent of ambiguous features were for the animal category because frequently used descriptors, such as “furry,” could be classified as either visual or tactile. To clarify this issue prior to data analysis, a disambiguation task was performed by 20 additional participants (16 females, 4 males; mean age = 24 years). Participants completed an eight-item, forced choice feature disambiguation questionnaire designed to determine whether specific features were considered visual or tactile (e.g., “Is ‘furry’ a visual or tactile feature of a dog?”). Results showed that half of these features could be disambiguated. For example, “furry” was perceived to be a tactile feature by 16 out of 20 participants, and “has feathers” was perceived to be a visual feature by 17 out of 20 participants. Some feature descriptions yielded ambiguous results and were not used in further data analysis.
Inter- and intrarater reliability were established for two raters, the first author and an independent rater (a colleague within the research laboratory), for the feature-type taxonomy using sample data from six subjects. For the intrarater comparison, Rater 1 recategorized the data 6 months after the original analysis. For the interrater comparison, features for the subset of data were categorized by both raters. The resulting feature profiles were compared and Cohen kappa coefficients, corrected for chance agreement, were computed for two sets of ratings by Rater 1 and for a comparison of Rater 1 and Rater 2. Intrarater reliability was high (κ = 0.98) and interrater reliability (κ = 0.78) indicated substantial agreement (Landis & Koch, Reference Landis and Koch1977). When discrepancies arose between raters, the original feature-type label given by Rater 1 was used.
Results
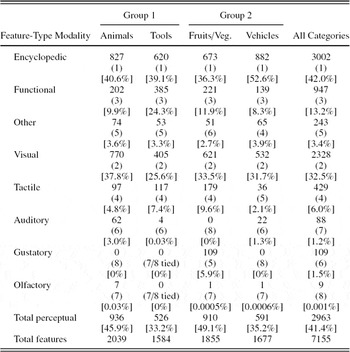
The results of the feature-type analysis are provided in Table 2.
Feature-type responses for the four categories used in the feature generation task

Note: The total number of features across feature types was tallied for each object across all participants and summed for the category. “Other” features included “personal” and “unknown” features. Ranking for each feature type is listed in parentheses, where “1” indicates the feature type with the most number of features given within that category. Percentages of responses by feature type for each category, and in total, are given in brackets (these add up to 99.7%–99.9% due to rounding errors). Total perceptual comprised data from the visual, tactile, auditory, gustatory, and olfactory modalities.
Feature-type correlations across categories. For all categories, encyclopedic, functional, and visual features made up most of the features that were given: animals 88.2%, fruits/vegetables 81.7%, tools 89.0%, and vehicles 92.6%.
Spearman's correlations were used to evaluate the consistency of response patterns for the eight feature types across categories. Probability values of .05 and less were treated as significant. However, after Bonferroni correction for multiple comparisons significance levels for all sets of Spearman correlations in Experiments 1 and 2 were α = 0.008, yielding a more conservative interpretation. There were significant correlations of feature-type rankings across all categories (N = 8 for all correlations: animals–fruits/vegetables: r s = .833, p = .01; animals–tools: r s = .994, p = .000; animals–vehicles: r s = .976, p = .000; fruits/vegetables–tools: r s = .862, p = .006; fruits/vegetables–vehicles: r s = .786, p = .02; tools–vehicles: r s = .970, p = .000). This indicated that the distribution of features, as a function of feature type, was similar across the four categories.
A second series of Spearman correlations was used to evaluate the consistency of response patterns for the five perceptual feature types (visual, tactile, auditory, gustatory, and olfactory) across categories. There were significant correlations of perceptual feature-type rankings across the animal, tool, and vehicle categories (N = 5 for all correlations: animals–vehicles: r s = 1.000, p = .000; animals–tools: r s = .975, p = .005; vehicles–tools: r s = .975, p = .005). This indicated that the distribution of perceptual features was similar across the animal, tool, and vehicle categories. The feature-type distribution of the fruit/vegetable category, however, was not significantly correlated with any other category. This indicated that the order of importance for the perceptual features in the fruit/vegetable category was unique compared to animals, tools and vehicles.
Correlations based on analysis of all eight feature types showed similarities across all categories. This included similar patterns within and across the living and nonliving domains. When correlations were computed on the basis of five perceptual feature types, a more distinct pattern emerged. Results showed within-domain similarities for nonliving things (tools and vehicles), within-domain differences for living things (animals and fruits/vegetables), and cross-domain similarities (animals and tools; animals and vehicles). More detailed analysis was conducted to explore the sources of these patterns as a function of feature type, category, and domain.
Analysis consisted of cross-domain and within-domain comparisons for total number of perceptual features and number of features for each perceptual modality. A Wilcoxon matched-pairs signed-ranks test was used for comparisons conducted within participant groups. Mann–Whitney U tests were conducted for comparisons between participant groups. To reduce the number of comparisons made, every possible pairwise contrast was not run. Fruits/vegetables was the only category with features classified as “gustatory;” therefore, comparisons to other categories were not statistically analyzed. Statistical comparisons were not run for perceptual modalities that made up less than 1% of the features given for that category (e.g., auditory features for tools).
Cross-domain comparisons.
ANIMALS AND TOOLS. The total number of perceptual features and the subset of visual features were significantly different for animals compared to tools (total perceptual: T = 4.691, N – ties = 30, p < .0005; visual: T = 4.612, N – ties = 30, p < .0005). More features were given for animals. Auditory features were given in greater number for animals (3.0%) than tools (0.3%). Number of tactile features was not significantly different between the categories (T = 1.185, N – ties = 27, p = .236).
FRUITS/VEGETABLES AND VEHICLES. The total number of perceptual, visual, and tactile features was significantly different for fruits/vegetables compared to vehicles (total perceptual: T = 4.499, N – ties = 28, p < .0005; visual: T = 2.448, N – ties = 29, p < .05; tactile: T = 4.483, N – ties = 28, p < .0005). More total perceptual, visual, and tactile features were given for fruits/vegetables. Gustatory features were given for fruits/vegetables, but not vehicles. Conversely, auditory features were given for vehicles, but not fruits/vegetables.
ANIMALS AND VEHICLES. The total number of perceptual, visual, tactile, and auditory features was significantly different for animals compared to vehicles (total perceptual: U = 179.000, N 1 = 30, N 2 = 30, p < .0005; visual: U = 244.500, N 1 = 30, N 2 = 30, p < .01; tactile: U = 190.500, N 1 = 30, N 2 = 30, p < .0005; auditory: U = 265.500, N 1 = 30, N 2 = 30, p < .01). More total perceptual, visual, tactile, and auditory features were given for animals.
FRUITS/VEGETABLES AND TOOLS. The total number of perceptual, visual, and tactile features was significantly different for fruits/vegetables compared to tools (total perceptual: U = 146.500, N 1 = 30, N 2 = 30, p < .0005; visual: U = 201.500, N 1 = 30, N 2 = 30, p < .0005; tactile: U = 287.000, N 1 = 30, N 2 = 30, p < .05). More total perceptual, visual, and tactile features were given for fruits/vegetables. Gustatory features were given for fruits/vegetables only.
Within-domain comparisons.
ANIMALS AND FRUITS/VEGETABLES. Total number of perceptual and visual features was not significantly different. Significantly more tactile features were given for fruits/vegetables (U = 239.500, N 1 = 30, N 2 = 30, p < .01). Gustatory features were given for fruits/vegetables, but not animals. Auditory features were given for animals, but not fruits/vegetables.
TOOLS AND VEHICLES. Total number of perceptual and visual features was not significantly different for tools compared to vehicles. Number of auditory features was significantly greater for vehicles compared to tools (U = 283.500, N 1 = 30, N 2 = 30, p < .01). Significantly more tactile features were given for tools compared to vehicles (U = 184.000, N 1 = 30, N 2 = 30, p < .0005).
In the above analysis, in which all visual features were analyzed as a single feature type, the living things categories, animals and fruits/vegetables, elicited significantly more visual features than the nonliving things categories, tools and vehicles. Within-domain comparisons showed that there were no significant differences in number of visual features for animals and fruits/vegetables or for tools and vehicles. Tactile features were also analyzed as a single feature type, showing that fruits/vegetables had significantly more of these features than animals, tools and vehicles. Tools had significantly more tactile features than vehicles, and animals had more than vehicles.
A single feature of “visual,” however, does not mesh with neurobiological evidence of separable neural substrates for the processing of different forms of visual information, for example, color (Martin, Haxby, Lalonde, Wiggs, & Unjgerleider, Reference Martin, Haxby, Lalonde, Wiggs and Ungerleider1995; Miceli, Fouch, Capasso, Shelton, Tomaiuolo, & Caramazza, Reference Miceli, Fouch, Capasso, Shelton, Tomaiuolo and Caramazza2001; Naor-Raz, Tarr, & Kersten, Reference Naor-Raz, Tarr and Kersten2003), motion (Martin et al., Reference Martin, Haxby, Lalonde, Wiggs and Ungerleider1995; Puce & Perrett, Reference Puce and Perrett2003), and shape (Miceli et al., Reference Miceli, Fouch, Capasso, Shelton, Tomaiuolo and Caramazza2001; Moscoso del Prado Martin, Hauk & Pulvermuller, Reference Moscoso del Prado Martin, Hauk and Pulvermuller2006; Proverbio, Burco, del Zotto, & Zani, Reference Proverbio, Burco, del Zotto and Zani2004; Servos, Lederman, Wilson, & Gati, Reference Servos, Lederman, Wilson and Gati2001). There is also evidence for separability of tactile information, for example, texture (Servos et al., Reference Servos, Lederman, Wilson and Gati2001) and manipulation (Boronat et al., Reference Boronat, Buxbaum, Coslett, Tang, Saffran and Kimberg2005).
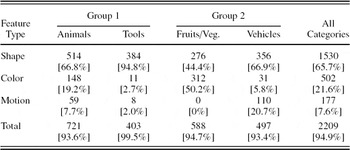
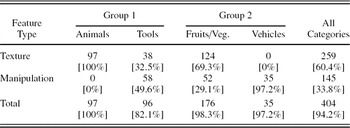
The feature data were reanalyzed according to a more detailed breakdown of visual features. Visual features were categorized into shape (including external parts, such as wheels and eyes, and size features), color, or motion features, whereas tactile features were separated into texture and manipulation. Table 3 presents the numbers of visual features by subtype, and Table 4 presents tactile features by subtype.
Visual feature type totals across categories

Note: Percentages in brackets indicate the percentage of total visual features for each subtype. Totals may not add up to 100% because of vague features such as “looks funny” that were labeled as visual features but were not further analyzed into subtypes of visual features.
Tactile feature type totals across categories

Note: Percentages in brackets indicate the percentage of total tactile features for each subtype. Totals may not add up to 100% because of vague features that were labeled as tactile features but were not further analyzed into subtypes of tactile features.
Data analysis
As in the previous analysis, further analyses were run using pairwise tests. To reduce the number of comparisons made, every possible pairwise contrast was not conducted; if a category had no features of a specific type, statistical analysis was not performed.
Cross-domain comparisons.
ANIMALS AND TOOLS. Significantly more shape, color, motion, and texture features were given for animals in contrast to tools (shape: T = 3.215, N – ties = 28, p < .05; color: T = 4.561, N – ties = 27, p < .0005; motion: T = 4.640, N – ties = 27, p < .0005; texture: T = 3.781, N – ties = 26, p < .0005). Manipulation features were not given for animals.
FRUITS/VEGETABLE AND VEHICLES. Significantly more shape features were given for vehicles in contrast to fruits/vegetables (T = 2.428, N – ties = 28, p < .05). Fruits/vegetables had significantly more color features than vehicles (T = 4.791, p < .0005). The categories did not differ significantly for manipulation features (T = 1.527, N – ties = 23, p = .127). No texture features were given for vehicles, and there were no motion features for fruits/vegetables.
ANIMALS AND VEHICLES. Significantly more shape and color features were given for animals in comparison to vehicles (shape: U = 264.000, N 1 = 30, N 2 = 30, p < .05; color: U = 108.500, N 1 = 30, N 2 = 30, p < .0005). Significantly more motion features were given for vehicles (U = 246.000, N 1 = 30, N 2 = 30, p < .05). Texture features were not given for vehicles and manipulation features were not given for animals.
FRUITS/VEGETABLES AND TOOLS. Significantly more color and texture features were given for fruits/vegetables (color: U = 1.500, N 1 = 30, N 2 = 30, p < .0005; texture: U = 166.5000, N 1 = 30, N 2 = 30, p < .0005). Tools had significantly more shape features (U = 290.500, N 1 = 30, N 2 = 30, p < .05). There was no significant difference between the categories for manipulation features (U = 448.500, N 1 = 30, N 2 = 30, p = .982). Motion features were not given for fruits/vegetables.
Within-domain comparisons.
ANIMALS AND FRUITS/VEGETABLES. Animals had significantly more shape features (U = 189.500, N 1 = 30, N 2 = 30, p < .0005). Fruits/vegetables had significantly more color features than animals (U = 110.500, N 1 = 30, N 2 = 30, p < .0005). There was no significant difference between the categories for texture features (U = 372.500, N 1 = 30, N 2 = 30, p = .248). Motion features were not given for fruits/vegetables and no manipulation features were given for animals.
TOOLS AND VEHICLES. Vehicles had significantly more color and motion features than tools (color: U = 326.000, N 1 = 30, N 2 = 30, p < .05; motion: U = 135.000, N 1 = 30, N 2 = 30, p < .0005). There were no significant differences between the categories for shape or manipulation features (shape: U = 400.500, N 1 = 30, N 2 = 30, p = .463; manipulation: U = 356.000, N 1 = 30, N 2 = 30, p = .145). Texture features were not given for vehicles.
Summary of results for Experiment 1
Significant correlations reflected similar response distributions of perceptual and nonperceptual feature types across the four categories. The majority of features were classed as encyclopedic, functional, and visual. Correlations involving the five perceptual features showed that fruits/vegetables were distinct. The perceptual feature analysis indicated some within-domain differences between animals and fruits/vegetables. There were also some cross-domain similarities for animals and tools as well as for animals and vehicles. However, cross-domain comparisons, with few exceptions, showed a pattern of cross-domain segregation. For living categories, responses were comprised of more perceptual features in total, and for each perceptual modality, compared to nonliving categories. The domain principle also predicts that within-domain comparisons should yield similar feature-type profiles, but this was not always the case. Within-domain comparisons showed similar response levels for total perceptual features, but the distribution of these features across the individual perceptual modalities differed within domain categories. Number of responses across the two living categories differed for tactile, auditory, and gustatory modalities. Number of responses for nonliving categories differed for visual, tactile and auditory modalities.
Differences in imageability for the two domains may have contributed to differences in feature profiles across categories. Using Morrison, Chappell, and Ellis's (Reference Morrison, Chappell and Ellis1997) imageability ratings on a scale from 1 (very hard to conjure up a mental image) to 7 (very easy to conjure up a mental image), a post hoc comparison of imageability ratings for the Snodgrass and Vanderwart (Reference Snodgrass and Vanderwart1980) item names showed that imageability ratings differed significantly as a function of category, χ2 (3) = 16.632, p < .05. Animals, excepting the item “bird,” which was not including in the norms, had a mean imageability rating of 6.6 (SE = 0.04); fruits/vegetables were 6.4 (SE = 0.09); tools were 6.0 (SE = 0.07); and vehicles were 6.3 (SE = 0.08). The ranked differences in imageability ratings paralleled the differences in number of total perceptual features: animals elicited a total of 936 perceptual features, fruits/vegetables 910, tools 526, and vehicles 591. Despite the acknowledged relationship between the feature generation task and imageability, the results reveal important within domain differences that appear to be independent of imageability.
The differences in feature-type distributions were not only quantitative as represented by the corresponding imageability values. They were also qualitative as demonstrated by further analysis of visual and tactile feature subtypes that showed specific differences in feature type distributions. For example, animals consistently had more shape features than any other category, although this may be due the fact that “shape” features included body parts, like facial features and limbs. Fruits/vegetables consistently had more color features than any other category. Vehicles consistently had more motion features than any other category. Fruits/vegetables and animals had more texture features than the tool and vehicle categories. Manipulation features were similar in amount for fruits/vegetables, tools, and vehicles and were not given for animals. Thus, the differences in feature-type distribution are not only quantitative, corresponding to an imageability value, but qualitative.
However, these feature-type distributions may be shaped by verbalizability. Some categories may have perceptual features that are underrepresented in English vocabulary, potentially skewing the feature profiles of categories. Experiment 2 was designed to avoid the necessity of verbalization of individual features. Thus, instead of verbally listing features, participants rated their knowledge for objects in five perceptual modalities. If verbalizability of features is not a confounding issue for the feature generation task, then profiles will be largely similar for both tasks. If however, verbalizability is an issue, feature profile differences are expected.
EXPERIMENT 2: PERCEPTUAL MODALITY RATING TASK
Method
Participants. The same participants who completed the feature generation task also completed the perceptual modality rating task. Participants remained in the same groups so that data from the feature generation and perceptual modality rating tasks could be compared. Thus, differences between tasks would not be due to different participants and different items, but instead to the method used. In the test session, participants always did the feature generation first, followed by a short break and the perceptual modality rating task. This was done so that participants were not prompted by the rating task to give specific types of information in the feature generation task.
Materials and procedure. In this task, participants were asked to rate their knowledge of items according to specific perceptual modalities. For example, “In your knowledge of a dog, how much do you know about touching it?” or “In your knowledge of a hammer, how much do you know about seeing it?” The scale progressed from 1 to 5, where 1 corresponded to an irrelevant modality for the object, such as tasting a bus, and 5 corresponded to a highly relevant modality, such as tasting a strawberry. Participants were instructed to base their answers on their own experience with the objects, and were told not to infer, for example, what a screwdriver might taste like.
Participants in Group 1 received 88 questionnaire items about the animal and tool items used in the feature generation task. Participants in Group 2 received 83 questionnaire items about the fruit/vegetable and vehicle items used in the feature generation task. To reduce testing time, one perceptual response modality judged as irrelevant was omitted for each category. The auditory modality was not used for fruits/vegetables, and the gustatory modality was not used for vehicles or tools. This assumption was supported by the results of Experiment 1. Participants listed no auditory features for fruits/vegetables or gustatory features for vehicles and tools. The gustatory modality for animals was not included because in this context, animals were to be considered as living things, for example, “cow” referred to a living cow, not a nonliving beef commodity. Participants also listed no gustatory features for animals in Experiment 1, indicating that they were interpreting the object name as a living animal. Some irrelevant object–modality questions (Group 1: 8; Group 2: 11) were included to control for random or false responding.
Data analysis. To allow compatibility across the feature generation and perceptual modality rating tasks, the same six items were removed from analysis such that all perceptual modality rating task categories included data from eight items. For each participant, median ratings were computed across all items within each modality for each category. These values were then averaged across participants.
Results
Responses for the first three control questions for Group 2 were excluded from analysis so that equal numbers of control questions were considered. The median rating averaged across participants for the remaining control questions was 1, corresponding to “not relevant” for all items.
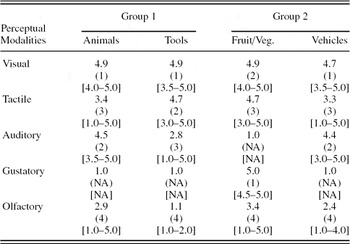
Results are shown in Table 5. Modalities with average medians of 2.5 and above were considered “relevant” to the category.
Median ratings averaged across participants for the perceptual modality rating task

Note: Ratings ranged from 1 to 5, where “5” indicated the highest rating. Ranking for each modality within each category is in parentheses, where “1” indicated the highest ranked modality the range of rating responses is given in brackets. Some modalities were not included or were used only as control questions for some categories. For these, the rank and range statistics are marked as not applicable (NA).
Perceptual modality correlations across categories. Spearman's correlations were used to evaluate the consistency of relevance ranking patterns for the five perceptual modalities across categories. Perceptual modality rankings correlated significantly for animals, tools and vehicles (N = 5 for all correlations: animals–vehicles: r s = 1.000, p = .000; animals–tools: r s = .900, p = .037; tools–vehicles: r s = 0.900, p = .037), indicating similar perceptual modality profiles across the three categories. Rankings for fruits/vegetables were not correlated with those of any other category. This indicated that the fruit/vegetable category was unique in its perceptual modality rankings.
To explore ratings of individual perceptual modalities, pairwise comparisons were conducted in a similar fashion to the feature generation task. Nonparametric tests were used due to nonnormal distributions and also because data were ordinally scaled. To constrain the number of comparisons, statistical analyses were conducted only when median ratings differed by more than 0.1.
Cross-domain comparisons.
ANIMALS AND TOOLS. For the animal category, ratings were above 2.5 for visual, tactile, auditory, and olfactory modalities. For the tool category, ratings were above 2.5 for the visual, tactile, and auditory modalities. Ratings for the visual modality were comparable across categories, but animals had significantly higher ratings for the auditory (T = 4.483, N – ties = 27, p < .0005) and olfactory modalities (T = 4.655, N – ties = 28, p < .0005). Tools had significantly higher ratings for the tactile modality (T = 4.241, N – ties = 27, p < .0005).
FRUITS/VEGETABLES AND VEHICLES. For the fruit/vegetable category, visual, tactile, gustatory, and olfactory modalities were rated above 2.5. The vehicle category showed ratings above 2.5 for the visual, tactile, and auditory modalities. Fruits/vegetables had significantly higher ratings for the visual, tactile, and olfactory modalities than vehicles (visual: T = 2.373, N – ties = 9, p < .05; tactile: T = 4.564, N – ties = 27, p < .0005; olfactory: T = 3.623, N – ties = 30, p < .0005). Auditory modality ratings were relevant for vehicles. Gustatory modality ratings were relevant for fruits/vegetables.
ANIMALS AND VEHICLES. Animals had significantly higher ratings in the visual modality (U = 346.500, N 1 = 30, N 2 = 30, p < .05), compared to vehicles. Similar ratings for animals and vehicles were observed for tactile, auditory, and olfactory modalities.
FRUITS/VEGETABLES AND TOOLS. Fruits/vegetables and tools had the same median ratings for visual and tactile modalities. Fruits/vegetables had significantly higher ratings than tools for the olfactory modality (U = 21.500, N 1 = 30, N 2 = 30, p < .0005). The gustatory modality was rated as relevant for fruits/vegetables but was only used in control questions for tools. The auditory modality was rated as relevant for tools and was only used in control questions for fruits/vegetables.
Within-domain comparisons.
ANIMALS AND FRUITS/VEGETABLES. Both categories had the same median ratings for the visual modality. Fruits/vegetables had significantly higher ratings for the tactile and olfactory modalities (U = 110.000, N 1 = 30, N 2 = 30, p < .0005; U = 320.000, N 1 = 30, N 2 = 30, p = .049). For animals, auditory knowledge was rated above 2.5, but was used only in control questions for fruits/vegetables. For fruits/vegetables, the gustatory modality was rated above 2.5, but was used only in control questions for animals.
TOOLS AND VEHICLES. Tools had significantly higher ratings for the tactile modality (U = 97.500, N 1 = 30, N 2 = 30, p < .0005). Vehicles had significantly higher ratings in the auditory and olfactory modalities (U = 101.000, N 1 = 30, N 2 = 30, p < .0005; U = 77.000, N 1 = 30, N 2 = 30, p < .0005). There was no significant difference in ratings for the visual modality. The gustatory modality was only used in control questions for both categories.
Summary of results for Experiment 2
Similar to the results from the feature generation task, animals, tools, and vehicles were shown to have similar feature profiles as indicated by high correlations of median ratings for the five perceptual modalities. Rating scores for visual, tactile, and auditory modalities were high compared to the gustatory and olfactory modalities for these categories. The profile for fruits/vegetables was distinct, showing higher rankings for the gustatory and olfactory modalities.
In general, cross-domain comparisons showed feature profile differences, except for animals and vehicles whose ratings were similar. Cross-domain similarities are not predicted by models of semantic memory incorporating a domain principle, for example, Durrant-Peatfield et al. (Reference Durrant-Peatfield, Tyler, Moss and Levy1997), Farah and McClelland (Reference Farah and McClelland1991), Gonnerman et al. (Reference Gonnerman, Andersen, Devlin, Kempler and Seidenberg1997), Warrington and Shallice (Reference Warrington and Shallice1984). Such models propose that domains are distinguished by different feature-type distributions. These models also predict that there should be similarities for within-domain categories. However, comparisons of within-domain categories for the perceptual modality rating task yielded some differences in ratings. When only the most highly relevant modalities were considered, as defined by modalities with ratings from 4.0 to 5.0, cross-domain similarities (and within-domain differences) became more apparent. Specifically, the tactile modality was highly relevant for fruits/vegetables and tools, whereas the auditory modality was highly relevant to animals and vehicles. Within-domain comparisons revealed the visual modality to be the only consistently relevant modality.
GENERAL DISCUSSION
The current study was designed to address the issue of within-domain homogeneity and cross-domain segregation in the sensorimotoric feature-type profiles for living and nonliving things. Accordingly, the two domains (living and nonliving) should differ as a function of their feature-type profiles. The current data partially support such a claim by showing that items from the living domain were attributed more perceptual features in the feature generation task, and higher perceptual modality ratings in the perceptual modality rating task, compared to items from the nonliving domain.
Closer examination of results for both tasks as a function of specific perceptual modalities revealed cross-domain similarities and within-domain differences in the distribution of features. This was reflected in the overall correlation analyses conducted for the five perceptual modalities in both experiments that showed that animals, tools, and vehicles had similar distributions of perceptual features, whereas fruits/vegetables had a distinct feature-type distribution. Notably, the strong cross-domain similarities were found in a between-subjects comparison.
Cross-domain similarities provide insight into the perceptual processes that may be involved in semantic organization. In the current study, the tactile modality was especially relevant to fruits/vegetables (living) and tools (nonliving). Items from both categories are generally small enough to be handheld and manipulated, as opposed to animals and vehicles. Similarly, animals (living) and vehicles (nonliving) were associated with the auditory modality as measured by both tests of semantic knowledge.
The experiments used in this study are off-line and may therefore indirectly reflect underlying, implicit representations in semantic memory. However, support for our interpretation of the data comes from other experimental paradigms, including on-line measures, which perhaps provide a more direct evaluation of semantic memory. These measures have also revealed cross-domain similarities more closely aligned to sensorimotoric interaction than living versus nonliving categories. In a lexical decision study, Myung, Blumstein, and Sedivy (Reference Myung, Blumstein and Sedivy2006) showed that for manmade items, prime–target word pairs sharing a common manipulation (piano–typewriter) but no other semantic link, displayed a significant priming effect. In an eye-tracking experiment, in which participants responded to auditory verbal input by indicating the corresponding picture on a computer screen, gaze was fixated more often on objects with shared manipulation features than for control items (Myung et al., Reference Myung, Blumstein and Sedivy2006). In addition, Filliter, McMullen, and Westwood (Reference Filliter, McMullen and Westwood2005) showed that manipulability, independent of whether the object was in the living or nonliving domain, was a significant factor in object recognition.
The behavioral data presented here and cited above are consistent with neurobiologically driven models such as the sensorimotor model of semantic memory (Martin, Reference Martin, Jablonski and Aiello1998; Martin et al., Reference Martin, Ungerleider, Haxby and Gazzaniga2000) and Barsalou's Perceptual Symbols Systems (Reference Barsalou1999). These models propose that semantic knowledge is acquired through interactions with objects and that the newly acquired information is stored by distributed neural regions adjacent to primary sensorimotor areas. Unlike the other models incorporating a domain principle, these sensorimotor models make no predictions of feature-type distribution based on a priori domains. Neuroimaging evidence for the sensorimotor type of model has been presented, which contrasted areas of brain activation in response to animal, tool, and fruit/vegetable stimuli using a categorization task (Kraut, Moo, Segal, & Hart, Reference Kraut, Moo, Segal and Hart2002). Kraut et al. (Reference Kraut, Moo, Segal and Hart2002) found overlapping areas of brain activation for all categories, but specific activation for tools and fruits/vegetables in left premotor cortex. They proposed that the similarity in left premotor activation reflected the fact that tools and fruits/vegetables can be manipulated.
In their study and review of the brain lesion and neuroimaging literature for object naming and recognition, Damasio, Tranel, Grabowski, Adolphs, and Damasio (Reference Damasio, Tranel, Grabowski, Adolphs and Damasio2004) argued that semantic memory of objects is organized in the brain by category, where categories are emergent constructs of objects with similar feature-type profiles. In other words, different areas of brain activation are a result of the sensorimotoric processing involved in object experience/interaction, for example, seeing an animal or manipulating a tool. Thus, categories are formed on the basis of similar feature profiles (irrespective of domain membership), which predicts grouping of similar categories following brain lesions to a particular area. Damasio et al. (Reference Damasio, Tranel, Grabowski, Adolphs and Damasio2004) found partially overlapping lesion sites that were associated with the failure to name tool and fruit/vegetable stimuli due to their shared characteristic of manipulability. Thus, the neurocognitive evidence also supports a model of semantic memory based in sensorimotoric processes, which is not based on domain membership per se, but on multimodal interactions with objects.
The noncategorical/domain approach of the sensorimotoric models is more parsimonious than some models of semantic memory that require caveats. For example, the sensory-functional theory (Warrington & Shallice, Reference Warrington and Shallice1984) and the amodal conceptual structure account (Tyler & Moss, Reference Tyler and Moss2001) state exceptions to the general rule, such that some nonliving things are similar to living things in their feature profiles and some living things are similar to nonliving things. Thus, domain and category labels may be useful linguistic constructs to classify things in the world but do not necessarily translate into corresponding constructs in semantic memory. It is more important that, when domains are omitted from the organization of semantic memory, the “problematic” categories of body parts, generally classed as living things, and musical instruments are no longer problematic. Neuropsychological studies have shown that knowledge of body parts may be selectively impaired (Coslett, Saffran, & Schwoebel, Reference Coslett, Saffran and Schwoebel2002; Felician, Ceccaldi, Didic, Thinus-Blanc, & Poncet, Reference Felician, Ceccaldi, Didic, Thinus-Blanc and Poncet2003; Shelton, Fouch, & Caramazza, Reference Shelton, Fouch and Caramazza1998; Suzuki, Yamadori, & Fujii, Reference Suzuki, Yamadori and Fujii1997) or may cluster with impairments of nonliving things (Barbarotto, Capitani, & Laiacona, Reference Barbarotto, Capitani and Laiacona2001). Musical instruments are similarly problematic, as these are often disrupted in living things impairments (Barbarotto et al., Reference Barbarotto, Capitani and Laiacona2001). Thus, instead of rigid living and nonliving distinctions and categories, the sensorimotoric models predict semantic flexibility (Barsalou, Reference Barsalou1999).
An additional objective of the current study was to determine the effect of method on the measurement of feature representations. Both feature generation and perceptual modality rating tasks showed that living things had more perceptual features and more highly relevant ratings for perceptual modalities than nonliving things. Both the tasks also showed similar results for correlation analyses in that animals, tools, and vehicles had similar patterns of rankings for the perceptual modalities. However, there were differences for the more detailed modality-specific analyses. In the feature generation task, participants listed individual features, whereas in the perceptual modality rating task, they rated their knowledge of the objects for five perceptual modalities. Most perceptual features generated by participants for the feature generation task were visual or tactile across all categories. In contrast, each preset modality was rated as relevant for at least one category in the perceptual modality rating task. Other differences between experiments were found in the degree of prominence of the relevant feature types for each category. For example, the gustatory modality generated only 12% of perceptual features for fruits/vegetables in feature generation, but was rated at ceiling in the rating task. Similarly, the olfactory modality comprised less than 1.0% of the perceptual features given for animals and fruits/vegetables in feature generation, but was rated as relevant for both living categories in the perceptual modality rating task. Differences in findings between the two tasks may be due in part to restrictions of vocabulary. Words for describing the gustatory, olfactory, and auditory features of objects may be more limited in most people's lexical repertoires. Thus, the feature generation task that has been used widely by investigators to validate feature-based models of semantic memory may not be a sufficiently sensitive probe for tapping into specific perceptual aspects of semantic knowledge.
In conclusion, this paper presents evidence for a model of semantic memory that does not incorporate a domain principle. Data from both feature generation and perceptual modality rating tasks challenged the proposal that domain membership (living vs. nonliving) plays a major role in the cognitive organization of object features as tested in the verbal modality. The data were more consistent with neurocognitive models that emphasize a role for sensorimotor experience in the organization of semantic memory without the need for a priori categorical constructs.
APPENDIX A
Items for Experiments 1 and 2, including familiarity ratings

Note: Familiarity ratings are according to Barry, Morrison, and Ellis (Reference Barry, Morrison and Ellis1997).
aItems removed before data analysis.
APPENDIX B: SAMPLE TRANSCRIPTS FROM EXPERIMENT 1
Group A (female participant, aged 20 years)
Rabbit
• little
• fluffy
• thing
• big ears
• little fluffy tail
• likes carrots quite often
• people like eating them because they're very tasty
• lot of little kids look after them
• keep them as pets
• in hutches in like garden they
Elephant
• really big
• animal
• with really tough skin
• grey
• with they smell
• usually in zoos
• they used to be in circuses and things but not really anymore
• big trunk
• big ears
• Dumbo I think of Dumbo they're
• they never forget
Horse
• big
• animal
• very strong and
• people ride on them
• they pull carts
• they're used for working
• but also recreation
• people just ride them for fun now
• they're big
• they're quite scary things
• they're quite furry and
• long tail
• usually run in fields all together
Mouse
• well it can be a little
• furry thing
• with big ears
• and a big nose
• there's cartoons of them little Mickey Mouse and Tom and Jerry and
• they don't really like them
• they sort of scurry around too much
• they're can be all different colors
• they're usually fluffy and
• furry
• with nice long tail
• some people keep them as pets
Cat
• big
• fluffy
• thing
• quite
• often very nasty
• doesn't usually like me but some cats do
• they like being fussed they're very fussy things
• they either like you or they don't
• they're very independent they're
• again there loads of cartoons of them
• they're um they got whiskers
• nose and
• little ears
Cow
• you can get milk from cows
• you get beef and stuff from cows
• leather from cows
• they've got 4 legs and
• there's loads of varieties
• most common I think of is like big
• black and
• white
• splodges
• they live in fields
• quite scary things don't like walking past them
Monkey
• well they can be cute and
• cuddly and
• little
• cheeky chappy or
• they're can be quite scary
• big gorilla type monkey things and
• they're usually hairy and
• smelly
• organ grinder I always think of an organ grinder with a monkey
• zoos zoos you see monkeys
• don't see them everywhere
Bird
• they fly through the air
• a lot of them are disease carrying things like pigeons
• there's loads of different varieties
• they occur all the way around the world
• they got feathers
• well not all of them have feathers
• but anyway some of them fly some of them don't fly
• they vary in size
• some people keep them as pets
Pig
• pink
• thing
• likes mud
• quite usually overweight
• smelly
• really bristly hairs
• snout
• ears
• piglets
• very cute
• usually found on a farm they
• you can get bacon from them and
• pork and stuff
Dog
• there's many breeds of dog
• they're faithful
• companions
• they're usually furry and
• 4 legs and
• nice tail and
• like taking them for a walk and
• they're friendly
• they look after you
• like part of the family
Pencil
• use it to write with
• it has lead in the middle
• wood on the outside
• use it to write on paper mainly writes on other things as well
• easy to carry
• everybody has a pencil
• very useful
• different colors
Hammer
• it's a metal
• object
• with a flat surface and a
• usually handle
• used to put nails into different surfaces
• most people have one
• they're in a toolkit
• they're you can use them well you can really use them for hammering in nails
Ruler
• use it to measure things
• a variety of things you can use it to draw straight lines as well
• they can come in plastic
• they can be metal
• they're different types of measurements you an have inches cm mm
• you can have really big ruler which is like a meter or something
Saw
• if you mean thing
• with blades and
• a wooden handle
• you use it for DIY
• then obviously they're sharp
• they can be different types of saws
• you got you can have electronic mechanical saws like band saws
• they can cut big pieces of wood
• you can have little saws like hacksaws
• for doing little bits of doweling and things
• you keep them in the garage usually
Chisel
• usually used by someone like a stonemason
• more of specialist tool
• usually for chiselling things like taking out wood and stone
• can be sharp but
• not many people have one
• they're made of metal with a
• plastic or
• wooden handle
Axe
• chopping wood is the main things for axe
• they're usually have a metal
• sharp head
• with a wooden handle
• you can have them in fire escape things so you can try and escape from a building
• they're very versatile
• not everybody really has an axe because
• they're not really used today
• you can use it to chop lots of things
Spanner
• mechanical
• fixing cars and general
• most houses have one
• they're metal things with little
• you use them to do a variety of things
• they're not very sharp
• they're just you can have a variety of spanners with different things
Scissors
• they can be used for everything
• everybody has a pair of scissors
• you can use them for embroidery
• you can use them for fabric cutting like pinking shears
• you can use them for more like in your kitchen
• scissors are versatile
• sharp
• things they're quite often plastic handles
• made of metal
• sharp edge
• you can buy them
Screwdriver
• found in a toolkit
• metal with
• usually plastic or
• wooden handle
• used for putting or
• removing screws
• it could be used for a variety of things wherever a screw's needed putting in is where you use it
• most people have one
• you can buy them from DIY shops
Pliers
• usually used to remove things quite often removing things nails and things from walls
• bending wire or
• like scissors in many ways but
• they're they have a gripping surface instead of a cutting surface and
• you use them to apply force and
• point
• to bend and
• manipulate things
Group B (male participant, aged 23 years)
Tomato
• tomato's a red
• fruit but generally
• not eaten like a fruit more like salad
• it's the main constituent of a lot of Italian foods and
• kind of gets quite slushy when you cook it but quite firm otherwise
• it's got little yellow seeds that you can't digest
Corn
• maize
• cereal
• it's a plant
• mainly carbohydrates
• yellow
• some on the curtains on the Simpsons
• it's got green leaves
• grown in warm places mainly but I think you can grow it here
Lemon
• it's a fruit
• also yellow citrus fruit
• quite a bitter taste
• similar to lime
• you get it in lemonade and Sprite various other flavored drinks you have it in a tequila slammer and often in a gin and tonic and possibly cheese cake don't know what else it
• can be a color
Pear
• another fruit
• can be grown on trees in this country
• sweet tasting
• but very hard if they're not ripe
• pear shaped is a phrase to mean gone wrong
• apples and pears cockney rhyming slang for stairs don't know
Apple
• an apple is a fruit
• has seeds in it
• it's made used to reproduce trees to grow more apples
• it's like a pear or other fruits
• it's quite sweet normally
• can be yellow or red or orange not orange green
Pineapple
• pineapple is more of a tropical fruit
• it's in Lilt you can also get other fruit drinks with pineapple in
• it's got a spiking top bit
• it's generally orange
• with green leaves I don't know
• Hawaiian pizzas have pineapple on
Carrot
• a carrot is a vegetable
• grown in the ground
• with green leaves carrots
• orange
• it's kind of long and
• thin
• gets pointy at the bottom end
• small roots
• used in a lot of traditional English foods
• comes in bunches
• rabbits eat them in cartoons
Banana
• banana's a tropical fruit
• they grow green and
• turn yellow when they're ripe
• they're quite sweet and
• they got caffeine
• in banana split is a type of food involving banana
• it's kind of crescent shaped
Strawberry
• strawberry's a red fruit
• with seeds on the outside again generally
• very sweet when they're ripe
• strawberries and cream is something you can eat
• if they're not sweet people often put sugar on them
• they're small and
• red
• about the size of your thumb
• you can grow them in England
Lettuce
• a lettuce is something you can eat again
• it's mostly made of water
• you have them in salads a lot in England again
• in sandwiches
• it's green
• it's just a big ball of leaves basically
• you can get varieties of lettuce like iceberg lettuce
Motorcycle
• a motorcycle is a bicycle with an engine on it
• it's got 2 wheels and
• you can sit on it
• can carry normally one or two people on them
• they can go quite fast got a lot of acceleration
• quite dangerous lots of people die on them
• you can drive them when you're younger than you can drive a car but
• you still need a license
Bus
• bus is used for public transport normally so
• you can pay to get on a bus at the side of the road
• they have certain fixed routes and
• they're big
• you can carry normally about 50–70 people on them
• drivers are traditionally grumpy
Train
• train's another form of transport
• faster than all the other ground things that you mentioned
• obviously restricted where they can go by where the rails are
• they tend to be either diesel or electric and
• you can get a lot of people of them
• they're pretty much better in every other country apart from England and
• generally needs a lot of money
Bicycle
• bicycle has 2 wheels
• it's a mode of transport
• it's faster than walking slower than cars
• one person can go on it at once normally
• you need a proficiency pass on the road in England
Car
• a car's the most common form on transport in England
• you drive cars on roads
• you need a driving licence to drive a car
• it's got wheels
• engine
• valves
• seats
• seatbelts
• dashboard
• speedometer
• you put petrol in it to make it go
Helicopter
• helicopter is another mode of transport
• goes in the air
• they're very removable which is an advantage they have over planes
• they've got a propeller at the top and
• a small one at the end for moving them around and
• they're generally not as big as airplanes
• they have them for controlling traffic
Airplane
• an airplane is a fast thing that
• flies in the air
• can carry a lot of people or equipment
• you pay to go on them as a passenger
• they've got wings and
• jet engines normally
• you can fly them on your own
Truck
• truck's another form of transport
• used for carrying things rather than people
• it's got wheels
• it's got an engine and
• seats and
• they generally go slowly on the roads in front of you
• they're noisy and
• heavy