I. INTRODUCTION
There has been much interest lately in synthesizing two-dimensional (2D) materials for potential applications in optoelectronics, energy storage, and catalysis/photocatalysis applications.Reference Chhowalla, Shin, Eda, Li, Loh and Zhang1–Reference Deng, Novoselov, Fu, Zheng, Tian and Bao4 Among the semiconducting metal oxides, TiO2 is the most widely used photocatalyst because of its favorable physicochemical properties, including its high chemical stability, nontoxicity, and low cost.Reference Hashimoto, Irie and Fujishima5,Reference Schneider, Matsuoka, Takeuchi, Zhang, Horiuchi, Anpo and Bahnemann6 There have been many recent efforts to prepare anatase TiO2 in 2D morphologies, as these nanostructures can offer many attractive properties such as high specific surface area, specific exposed facets, and a large fraction of unsaturated surface atoms.Reference Pan, Chen and Yi7,Reference Zhang, Zhu, Tang, Müllen and Feng8
Materials with layered or lamellar bulk structures can be more easily formed into platelet or sheet-like morphologies due to the natural bonding anisotropy in the intra and interlayer directions, but the anatase phase of TiO2 does not exhibit such a layered structure. Platelet-type nanocrystals of anatase have been successfully prepared using hydrothermal methods, but fluoride anions, typically from toxic reagents such as hydrofluoric acid, must be used as structure-directing agents.Reference Yang, Sun, Qiao, Zou, Liu, Smith, Cheng and Lu9,Reference Han, Kuang, Jin, Xie and Zheng10 Nanosheet-type structures with larger lateral dimensions have also been demonstrated by converting nanosheets of layered, lepidocrocite-type titanate compounds to anatase using hydrothermal or calcination treatments.Reference Wen, Itoh, Tang and Feng11–Reference Yuan, Besselink, Liao and ten Elshof14 While the conversion of these titanates to the anatase structure has been found to be topochemical in nature, the layered titanate nanosheets must be obtained by exfoliation using osmotic swelling, which is a multistep process involving ion-exchange and intercalation of bulky ammonium cations.Reference Wang and Sasaki15 Our previous work exploring exfoliation-based methods for obtaining energy storage materials in 2D morphologies showed that these large organic cations are strongly adsorbed on the nanosheet surfaces and can interfere with their interfacial properties unless they are removed using electrophoresis.Reference Cheng, Yang, Li and Chan16,Reference Cheng, Yang, Li and Chan17
To our knowledge, the preparation of TiO2 nanosheets by the chemical conversion (i.e., oxidation) of TiS2 nanosheets has not been explored. This approach is attractive, as the preparation of 2D nanosheets using chemical and electrochemical reduction methods has been demonstrated for a large number of layered, transition metal dichalcogenide materialsReference Zeng, Yin, Huang, Li, He, Lu, Boey and Zhang18,Reference Zeng, Sun, Zhu, Huang, Yin, Lu, Fan, Yan, Hng and Zhang19 and hence provides the opportunity to obtain a large number of layered metal oxides through conversion of metal sulfide nanosheet starting materials. Additionally, using TiS2 as the precursor could potentially enable sulfur-doped TiO2, which has a smaller band gap than pure anatase and enhanced photocatalytic properties.Reference Ohno, Akiyoshi, Umebayashi, Asai, Mitsui and Matsumura20–Reference Lin, Chien, Lai, Chaing, Li and Lin24 While it has been demonstrated that bulk TiS2 can be successfully converted to TiO2 using hydrothermal and air oxidation,Reference Ho, Yu and Lee21,Reference Lin, Chien, Lai, Chaing, Li and Lin24–Reference Lim, Tang, Cheng and Chen26 here we investigate the hydrothermal conversion of TiS2 nanosheets to TiO2 with the aim of preserving the nanosheet morphology of the starting material in the final anatase nanostructures and to understand the change in the crystal structure and composition of the nanosheets after the conversion.
II. EXPERIMENTAL METHODS
A. Materials
All chemicals were used as received without further purification. Titanium disulfide, lithium metal foil, and N-methylpyrrolidone (NMP) were all purchased from Sigma-Aldrich (St. Louis, Missouri). Polyvinylidene difluoride (PVDF) binder was purchased from Kynar (Colombes, France). SuperP Li carbon black (CB) was purchased from Timcal (Bodio, Switzerland). The electrolyte (1 M LiPF6, EC/DMC/DEC, 4:2:4 in volume) was purchased from MTI. The separator used inside the pouch cell was Celgard 2500 (Celgard, Charlotte, North Carolina). Commercial TiO2 particles (P25 and P90) were obtained from Evonik (Essen, Germany) and were used as control samples.
B. Synthesis of TiO2 nanosheets
The TiS2 nanosheets were synthesized first via the electrochemical exfoliation of bulk TiS2 similar to the method described elsewhere.Reference Zeng, Tan, Huang, Bao and Zhang27 The lithium intercalation of TiS2 was performed in pouch cells with lithium foil as the counter anode. The working electrode was prepared by mixing TiS2, CB, and PVDF binder in a weight ratio of 8:1:1 under vigorous stirring for 12 h with NMP as dispersant. The slurry was cast onto copper foil and dried at 120 °C for 12 h. Pouch cells were assembled in an argon-filled glovebox. The assembled cells were discharged galvanostatically using a 0.05 C rate (assuming a theoretical lithiation capacity of 239 mA h/g) to 0.9 V versus Li/Li+ using a BioLogic VMP3 potentiostat (BioLogic Science Instruments, Seyssinet-Pariset, France). Then, the electrode was held at 0.9 V for 2 h, followed by a 1.5 h rest at open circuit. If the voltage was higher than 1 V, the electrode was charged galvanostatically again using a 0.05 C rate until the potential reached 0.9 V versus Li/Li+, followed by another 2 h potentiostatic hold at 0.9 V. The step was repeated until the open circuit voltage was less than 1 V versus Li/Li+. The lithiated TiS2 cathode was then dispersed in ice water and sonicated for 1 h (with the ice water used to mitigate heating from the sonication and avoid agglomeration of the nanosheets). Afterwards, the resulting suspension was centrifuged at 3000 rpm for 20 min to separate the TiS2 nanosheets (dispersed in the water) from unreacted materials (agglomerated on the bottom).
To prepare TiO2 nanosheets, O2 from a gas cylinder was purged into the as-prepared TiS2 solution for 30 min to 1 h to ensure sufficient dissolved O2 for the reaction with TiS2. The O2 purged dispersion was then put into 40 mL autoclave vessels (Parr Instrument Company, Moline, Illinois) with each vessel containing a maximum of 30 mL of solution. The pretreated TiS2 nanosheet dispersion was hydrothermally reacted at 180 °C for 14 h to obtain the TiO2 nanosheets.
C. Materials characterization
The crystal structure of the TiO2 nanosheets was determined using X-ray diffraction (XRD) using monochromatic Cu Kα radiation (λ = 1.5405 Å) (Panalytical X’pert Pro, Alemelo, the Netherlands). The size and morphology of the materials were observed using scanning electron microscopy (SEM) using a FEI XL 30 field emission SEM (FEI, Hillsboro, Oregon), transmission electron microscopy (TEM) using a Philips CM200 microscope Philips, Eindhoven, the Netherlands, and atomic force microscopy (AFM) using a Bruker Multimode scanning probe microscope (Bruker Nano Surfaces, Santa Barbara, California). X-ray photoelectron spectroscopy (XPS) was performed on a VG ESCALAB 220i-XL (VG Scientific, Waltham, Massachusetts) with Al Kα anode (1486.6 eV) operated at 63 W and 15 kV. The X-ray takeoff angle was 45° and the data were acquired from the region within ∼500 μm of the outer surface of the sample. Charge compensation was used because TiO2 is a wide band gap semiconductor. A pass energy of 20 eV was used for high-resolution spectra. The spectra were calibrated to the C 1s hydrocarbon peak at 284.7 eV. Peak fitting was performed using CasaXPS processing software (Casa Software, Teignmouth, United Kingdom). Raman spectroscopy was performed in air at room temperature using a WITec alpha 300R confocal Raman microscope system (WITec, Ulm, Germany), using a 100× objective lens and 532 nm excitation laser (Carl Zeiss Microscopy GmbH, Jena, Germany).
D. Photocatalytic testing
The photocatalytic activity of the as-prepared TiO2 nanosheets was evaluated under UV irradiation for the photodegradation of methylene blue (MB) in aqueous solution. All photocatalytic reactions were performed in a 50 mL glass beaker under magnetic stirring with the UV light (UVP, 8 Watt, 0.16 Amps, 115 V, 60 Hz, characteristic wavelength at 254 nm; UVP LLC, Upland, California) illuminated above the surface of aqueous solution. Control tests were also performed using commercial TiO2 (P25) as the photocatalyst. In each case, 0.2 g/L of TiO2 was added into 30 mL of deionized water solution containing 5 ppm of MB and allowed to equilibrate in the dark for 10 h prior to begin the irradiation. About 2 mL of suspension were taken at certain time intervals during the photoreaction and centrifuged to remove the photocatalysts. The concentration of MB in the recovered solution was determined by UV-vis spectroscopy using an Ocean Optics USB2000 + spectrometer (Ocean Optics, Dunedin, Florida) with balanced deuterium tungsten light source (DH-2000-BAL, Ocean Optics, Dunedin, Florida) by measuring the absorbance at a wavelength of 664 nm. Each photodegradation experiment was repeated twice.
III. RESULTS AND DISCUSSION
In the current work, the synthesis of TiO2 nanosheets was implemented with a three-step process (Scheme 1). The first step involves the reduction of the bulk TiS2 material through electrochemical lithiation to form LixTiS2, using procedures similar to those when TiS2 is utilized as a positive electrode in a Li battery.Reference Whittingham28 An example voltage profile for the lithiation of the TiS2 electrode is shown in Fig. S1. The lithiation weakens the van der Waals interactions between the TiS2 interlayers and enables exfoliation via ultrasonication. The exfoliated TiS2 nanosheets are uniformly dispersed in water [Fig. S2(a)]. Then, the as-obtained TiS2 nanosheet dispersion is oxidized using the hydrothermal treatment to obtain TiO2 nanosheets [Fig. S2(b)]. Previous TEM studies showed that the oxidation product of TiS2 after immersion in deionized water solutions was amorphous,Reference Long, O’Brien, Lewis, Prestat, Downing, Cucinotta, Sanvito, Haigh and Nicolosi29 so the hydrothermal treatment is implemented here to improve the crystallinity of the formed TiO2.
Synthetic procedure for the preparation of TiO2 nanosheets by oxidation of TiS2 nanosheets obtained from electrochemical lithiation.

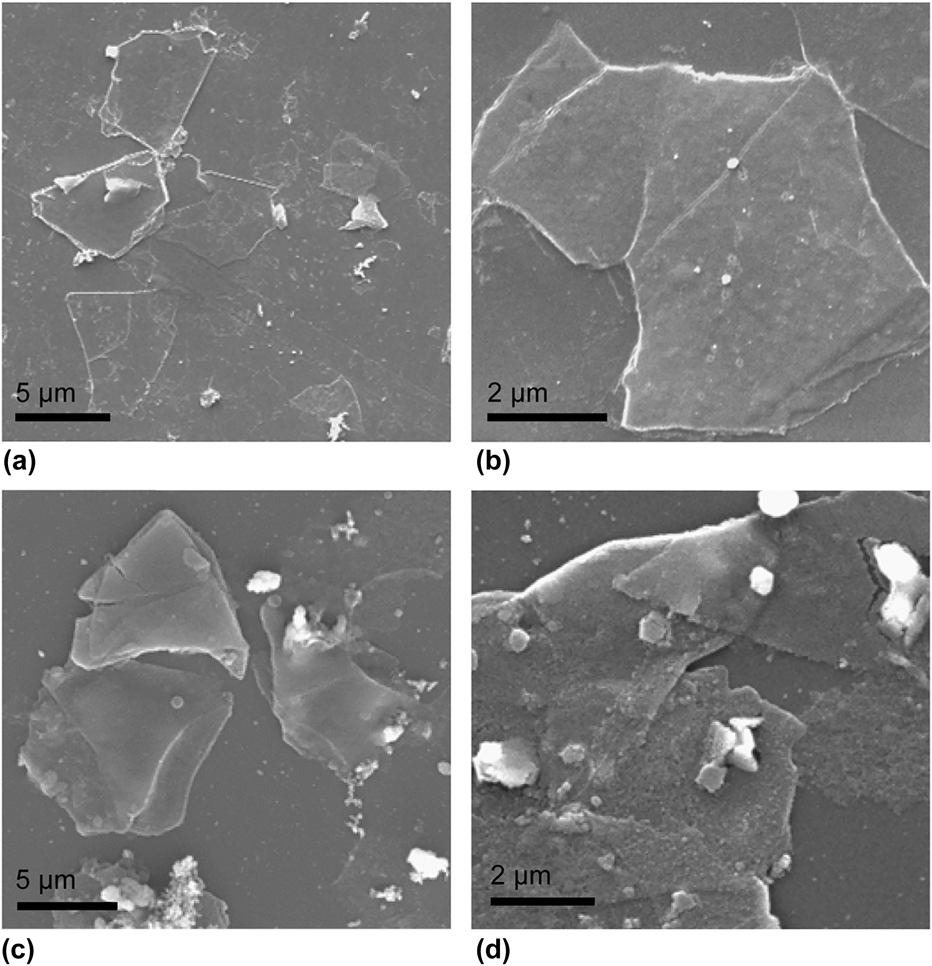
SEM images of the exfoliated TiS2 nanosheets and prepared TiO2 are shown in Fig. 1. The lateral size of the TiS2 nanosheets varied from 2 to 10 µm [Figs. 1(a) and 1(b)]. From Figs. 1(c) and 1(d), it can be seen that the TiO2 nanosheets obtained after hydrothermal treatment maintained the sheet-like morphology of the TiS2 starting materials. However, in addition to the nanosheet materials, some agglomerated particles and residues were observed on the substrate. Raman spectroscopy and high magnification optical microscopy were used to characterize the samples (Fig. S3). The Raman spectrum taken from the nanosheet region displayed a peak at about ∼150 cm−1, which matches the Eg mode of anatase.Reference Zhang, He, Zhang, Yin and Chen30 The intensity of this peak was still present, but much weaker when obtaining a spectrum from the residue on the background, which suggests that the residue consists of some anatase but probably mostly carbonaceous materials such as the CB and PVDF binder from the TiS2 electrode.
SEM images of (a and b) exfoliated TiS2 nanosheets and (c and d) prepared TiO2 nanosheets.

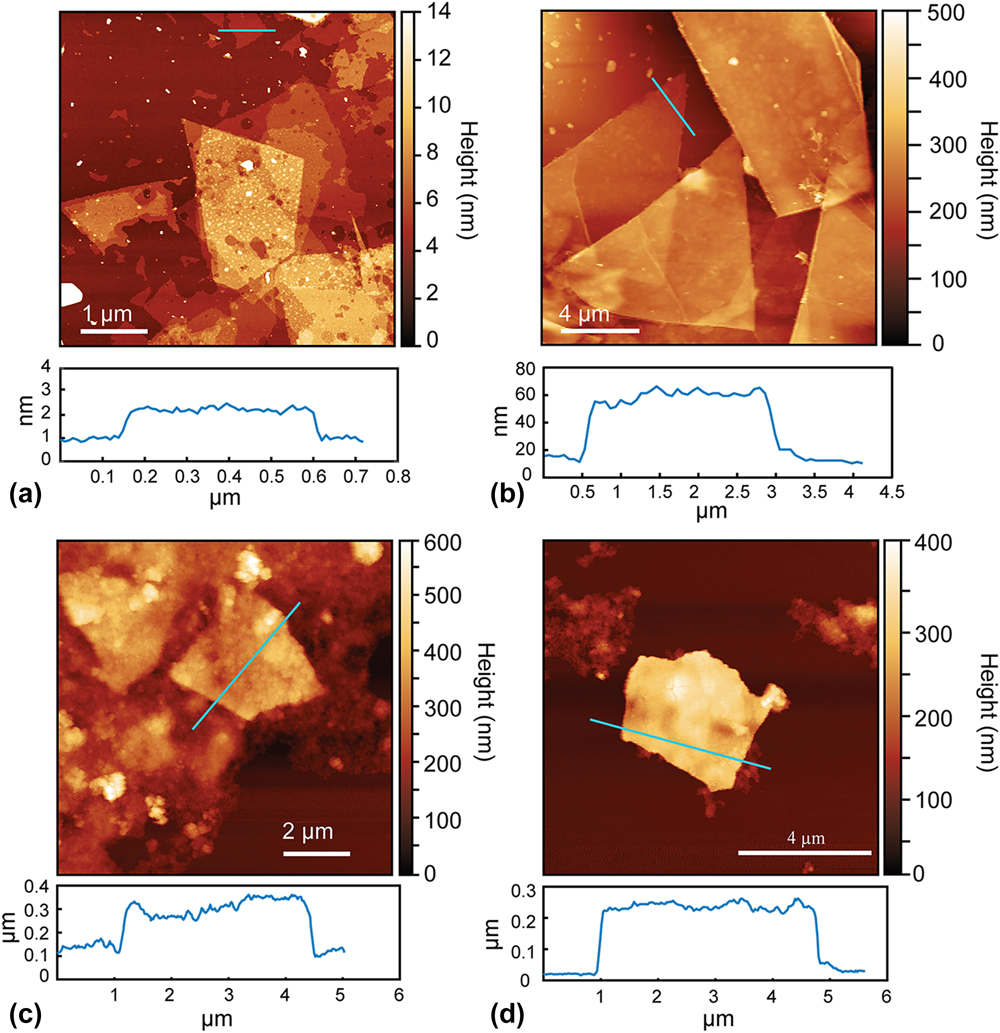
The thicknesses of the TiS2 and TiO2 nanosheets were measured using AFM. The AFM images show that the thickness of the exfoliated TiS2 nanosheets ranged from around 1–40 nm [Figs. 2(a) and 2(b)]. According to the previous work, single-layer TiS2 nanosheets should have a thickness of 0.9–1.2 nm,Reference Zeng, Tan, Huang, Bao and Zhang27 which indicates that the TiS2 samples were a mixture of single- and multi-layered nanosheets. This is likely due to the wide distribution of particle sizes in the starting TiS2 materials (Fig. S4), with the smaller particle sizes leading to more complete exfoliation due to the reduced lithium diffusion distances. It was also observed that the lateral size of the TiS2 nanosheets varied from very small pieces to around 10 µm, which is in accordance with the SEM images [Figs. 1(a) and 1(b)]. The AFM images showed that the thicknesses of the as-prepared TiO2 nanosheets was around 200–240 nm [Figs. 2(c) and 2(d)]. The increase in thickness compared to the TiS2 nanosheets could be caused by agglomeration or restacking of the sheets during the hydrothermal treatment.
AFM images of (a and b) exfoliated TiS2 nanosheets and (c and d) prepared TiO2 nanosheets.

To better understand the structure of the TiO2 nanosheets, XRD and high resolution TEM were performed. The XRD pattern [Fig. S5(a)] of the bulk TiS2 starting material matched that expected for the hexagonal structure of TiS2, but with enhanced intensity from the (001) reflection due to preferred orientationReference Let, Mainwaring, Rix and Murugaraj31 of the particles due to their platelet morphology (Fig. S4). On the other hand, the XRD pattern for the TiO2 nanosheets was in close agreement with the reference pattern for anatase [Fig. S5(b)], suggesting no preferential crystalline orientation. No additional diffraction peaks were observed, indicating that the transformation of the TiS2 nanosheets to TiO2 did not result in other crystalline phases. Performing the same hydrothermal treatment on bulk TiS2 particles (without exfoliation into nanosheets) also resulted in formation of bulk anatase TiO2 as verified by XRD [Fig. S5(c)], confirming the oxidation through this process.
The TEM results showed that the TiO2 nanosheets were polycrystalline, which is consistent with the XRD pattern. From the TEM image in Fig. 3(a), the sheet-like morphology of the TiO2 is easily identified, but it can be seen that the nanosheets are composed of many small crystallites. The high resolution TEM image in Fig. 3(b) shows the polycrystalline nature of the TiO2 nanosheets. The lattice spacing of 0.35 nm was measured, which is close to the d-spacing for the (101) atomic planes of anatase TiO2. These results show that while the overall morphology of the initial TiS2 nanosheets was maintained during the hydrothermal treatment, the formed anatase was polycrystalline due to the differences in bonding arrangements between the TiS2 and anatase crystal structures. TiS2 is comprised of Ti–S octahedra arranged in “slabs” with sulfur atoms separated by van der Waals bonding, which results in layers of Ti atoms sandwiched between two sulfur layers.Reference Chianelli, Scanlon and Thompson32 On the other hand, anatase comprises of edge sharing, distorted Ti–O octahedraReference Howard, Sabine and Dickson33 and lacks the van der Waals gap that enables both the facile Li+ insertion and exfoliation in TiS2. Hence, the structural rearrangement during the oxidation process results in the formation of polycrystalline materials but interestingly still enables the nanosheet morphology to be maintained.
(a) TEM and (b) high resolution TEM images of TiO2 nanosheets.

XPS was used to characterize the chemical states in the as-exfoliated TiS2 nanosheets and the obtained TiO2 nanosheets. The XPS analysis was also performed on P25 TiO2 for comparison (Fig. S6). Figure 4(a) shows the Ti 2p, O 1s, and S 2p XPS spectra obtained from the surface of the TiS2 nanosheets. The Ti 2p 1/2 and Ti 2p 3/2 peaks were found at binding energies of 456.5 and 462.4 eV for TiS2,Reference Faba, Gonbeau and Pfister-Guillouzo34 but the corresponding Ti–O peaks indicating partial surface oxidation of TiS2Reference Martinez, Auriel, Gonbeau, Loudet and Pfister-Guillouzo35,Reference Oh, Choi, Kim, Lee, Kim, Park, Sohn and Jung36 were also observed at 459.3 and 464.8 eV. The deconvolution of the O 1s spectrum confirmed that most of the oxygen was in the form of surface hydroxides (peak at 532.5 eVReference Iwabuchi, Choo and Tanaka37), but the shoulder at lower binding energies could arise from Ti–O–S and S–O–S bonds from adsorbed sulfate.Reference Bayati, Moshfegh and Golestani-Fard38 The S 2p spectrum showed peaks at 160.9 and 161.8 eV, which correspond to the binding energies for S 2p 3/2 and 2p 1/2, respectively, for sulfide (S2−).Reference Faba, Gonbeau and Pfister-Guillouzo34 The broader peak centered at around 168 eV is attributed to surface adsorbed sulfate,Reference Lin, Chien, Lai, Chaing, Li and Lin24 which is consistent with the O 1s spectrum.
High resolution Ti 2p, O 1s, and S 2p XPS scans for (a) as-exfoliated TiS2 nanosheets and (b) as-prepared TiO2 nanosheets.

The XPS spectra obtained from the TiO2 nanosheets are shown in Fig. 4(b). The Ti 2p 1/2 and Ti 2p 3/2 peaks were found at binding energies of 459.8 eV and 465.5 eV, respectively, which is consistent with the Ti4+ chemical state for TiO2Reference Lin, Chou and Chu39 and similar to the binding energies found in P25 (Fig. S6). Since the Ti–S peaks were not present, this indicates that the TiS2 was successfully converted to TiO2. The O 1s XPS spectrum of the TiO2 nanosheets showed two peaks, with the main contribution being the peak at 530.9 eV attributed to the Ti–O bond in the TiO2,Reference Colón, Hidalgo, Munuera, Ferino, Cutrufello and Navío40 followed by the peak at 532.5 eV attributed to the surface hydroxide. The O 1s spectrum of the TiO2 nanosheets could be further fitted to contributions from oxygen in surface adsorbed sulfate at lower binding energies, which is different from the O 1s spectrum for P25 (Fig. S6). Furthermore, the presence of an S 2p XPS signal in the TiO2 nanosheets indicated that there was still some sulfur remaining after the hydrothermal treatment, likely in the form of surface adsorbed sulfate and sulfide due to the surface sensitivity of XPS and the absence of obvious Ti–S features in the Ti 2p spectrum. It is also possible that there could be S–Ti–O bonding in the TiO2 nanosheets (binding energy of 163.7 eVReference Tang and Li41).
Although UV-vis spectroscopy analysis can be used to determine the band gap of the TiO2 nanosheets to investigate the possibility of sulfur doping in the materials, this was not possible because the TiO2 nanosheet dispersions after the hydrothermal treatment were black in color due to residual carbon (Fig. S2). The diffuse reflectance plots of the TiO2 nanosheets showed very high absorption in the visible range, similar to TiS2 (Fig. S7). However, when performing the same hydrothermal oxidation treatment on nonexfoliated TiS2 powder (i.e., bulk TiS2 that was not prepared into an electrode and subjected to electrochemical lithiation), the absorbance of the resulting product was very similar to that expected for TiO2 (see the “Bulk TiO2” spectrum in Fig. S7). For this reason, we cannot rule out the effect of adsorbed CB from the electrode on the observed optical properties of the TiO2 nanosheets.
To evaluate the potential of the TiO2 nanosheets to be used as a photocatalyst, dye degradation experiments using MB as a model compound were conducted under UV (254 nm) irradiation. In these experiments, P25 TiO2 was used for comparison. As shown in Fig. 5(a), the MB was not degraded by the UV light alone in the absence of a photocatalyst. When the TiO2 samples were added to the MB solution and equilibrated in the absence of UV irradiation, about 88% of the MB still remained in the solution after 10 h, indicating some dark sorption of MB onto the TiO2. Under UV irradiation, the TiO2 nanosheets were effective for the decoloration of MB (Fig. S8). However, the results showed that P25 showed a faster degradation rate for MB compared to the TiO2 nanosheets. P25 could remove almost all of the MB within 22 min, but when using the TiO2 nanosheets as the photocatalyst, there was still ∼13% (0.64 ppm) MB remaining after 20 min of irradiation. To determine if the CB and PVDF binder adsorbed on the surface of the TiO2 nanosheets may have affected the photocatalytic performance, P25 photocatalysts were also prepared including these components. P25 was mixed with CB in a weight ratio of 9:1 (sample referred to as P25 + CB) and with CB and PVDF at a ratio of 8:1:1 (sample referred to as P25 + CB + PVDF), followed by the hydrothermal treatment at 180 °C for 14 h.
(a) Degradation curves and (b) first-order reaction kinetics for photocatalytic removal of MB by photocatalysts (P25, TiO2 nanosheets, P25 + CB, and P25 + CB + PVDF) under UV irradiation. CB = carbon black, PVDF = polyvinylidene difluoride.

The results showed that the MB degradation rate for P25 + CB and P25 + CB + PVDF was slower than that for pristine P25, as well as for the TiO2 nanosheet sample. Figure 5(b) shows the kinetics of the MB degradation for the tested samples. The MB degradation curves for all of the photocatalysts could be fitted to a first-order model, similar with other studies.Reference Houas, Lachheb, Ksibi, Elaloui, Guillard and Herrmann42,Reference Li and Li43 The rate constants were approximately 0.185 min−1 for P25, 0.103 min−1 for the TiO2 nanosheets and around 0.071 min−1 for the P25 containing CB and CB + PVDF (Table SI).
From these results, we can deduce that the CB and also PVDF mixed in with the TiO2 nanosheet sample may have a detrimental effect on the photocatalytic activity for the degradation of MB, as adding these same components to the P25 sample also decreases its activity. There are several possible reasons for why the presence of CB and PVDF decrease the photocatalytic performance of TiO2. Both the CB and PVDF have low hydrophilicity, so they could affect the dispersion of the photocatalyst particles into solution and prevent adequate contact with the MB in the water. Furthermore, the adsorption of CB and/or PVDF onto the surface of the photocatalysts could decrease the active available surface area for adsorption of MB, block absorption of light by the TiO2, or induce agglomeration of the materials. However, we see that the presence of CB and PVDF do not completely inhibit the performance of the P25, but rather just decrease the rate of degradation. We can further infer that if CB and PVDF could be successfully removed from the TiO2 nanosheets, the activity of the TiO2 nanosheets could be improved and may be comparable to that of P25.
Similar to our previous studies,Reference Cheng, Yang, Li and Chan16,Reference Cheng, Yang, Li and Chan17 we see that while exfoliation can provide a route towards obtaining nanosheets, the ancillary components that enable the exfoliation may also interfere with the desired properties of the obtained structures. In this case, the CB and PVDF are needed to adhere the bulk TiS2 particles to the electrode and ensure sufficient electronic conductivity in the film to enable electrochemical lithiation and subsequent exfoliation of the particles into TiS2 nanosheets. We attempted to perform the TiO2 nanosheet synthesis using TiS2 electrodes prepared without CB and utilizing carboxymethyl cellulose (CMC) as the binder instead of PVDF. A water soluble polymer, CMC might be easier to remove compared to PVDF. However, attempts to exfoliate TiS2 using this CB-free electrode were not successful in producing nanosheets, leading to products with irregular morphologies (Fig. S9). The absence of the CB in the electrode may have led to a high electrode internal resistance, leading to insufficient electrochemical lithiation. Electrochemical lithiation using electrodes of TiS2 containing conducting additives that have been demonstrated to have intrinsic photocatalytic properties (e.g., graphene-based materials,Reference Xie, Zhang, Guo, Liu, Fang and Gong44 activated carbons with large percentage of carbon atoms with sp 2 hybridization,Reference Velo-Gala, López-Peñalver, Sánchez-Polo and Rivera-Utrilla45 in situ graphitized carbon coatings,Reference Zhang, Vasei, Sang, Liu and Claverie46) may help to address this issue. Furthermore, other methods reported for the preparation of LixTiS2 nanosheets, such as chemical lithiationReference Lin, Zhu, Feng, Wu, Hu, Peng, Guo, Peng, Zhao, Huang, Yang and Xie47 or mechanochemical lithiation,Reference Oh, Choi, Kim, Lee, Kim, Park, Sohn and Jung36 may also be effective for providing the TiS2 nanosheet starting materials for the transformation to TiO2 nanosheets without the need for CB or binder.
IV. CONCLUSIONS
In summary, we found that hydrothermal oxidation of TiS2 nanosheets was an effective method to obtain polycrystalline TiO2 nanosheets with the anatase structure. The nanosheet morphology of the original TiS2 nanosheets was maintained, although increases in thickness suggest that there may have been some agglomeration during the reaction. The obtained TiO2 nanosheets were polycrystalline due to the large difference in initial and final crystal structures. While electrochemical reduction has been reported to be an effective, scalable method to obtain large yields of TiS2 nanosheets, we observed that the residue from the CB and polymer binder used in preparing the electrode leads to a detrimental effect on the photocatalytic properties of the TiO2 nanosheets in dye degradation tests.
Supplementary Material
To view supplementary material for this article, please visit https://doi.org/10.1557/jmr.2018.165.
ACKNOWLEDGMENTS
This work was supported by the National Science Foundation Engineering Research Center (ERC) on Nanotechnology-Enabled Water Treatment (EEC-1449500). The authors acknowledge the use of facilities within the LeRoy Eyring Center for Solid State Science at Arizona State University.