Overweight and obesity pose significant global health challenges, closely linked to increased morbidity and mortality through its association with chronic diseases including CVD, type 2 diabetes and some cancers(Reference Ataey, Jafarvand and Adham1). Black African women experience disproportionately high obesity rates, with prevalence reaching 37 % in the UK(Reference Smith, Hill and Bambra2,3) . Extensive research has investigated the association between dietary habits and chronic non-communicable diseases(Reference Afshin, Sur and Fay4). Despite these substantial challenges faced by Black African women with overweight and obesity, there is a lack of comprehensive data on the nutritional status of Black Africans in the UK. The National Diet and Nutrition Survey, albeit including a very small proportion of Black populations, has not been able to delineate data analysed by ethnicity(Reference Chowbey and Harrop5). Other studies have focused on African Caribbeans,(Reference Vyas, Greenhalgh and Cade6) with relatively little information on the dietary behaviours of Black Africans, despite representing 62·5 % of the Black population in the UK(7–Reference Goff, Timbers and Style9).
Dietary assessment in Black and minority ethnic groups is essential for surveillance programmes in countries with diverse and transitional populations such as the UK, as well as for implementing effective interventions(Reference Leung and Stanner10). Various dietary assessment methods exist, each with strengths and limitations, including diet records, 24-h recalls, FFQ and biochemical markers such as urinary nitrogen or blood lipid profiles, which confirm self-reported intake(Reference Satija, Yu and Willett11–Reference Foster, Lee and Imamura13). Advances in digital technologies have also introduced novel tools, such as mobile dietary tracking apps, image-based food logging and wearable sensors, which help mitigate certain limitations of traditional methodologies(Reference Vijayan, Connolly and Condell14). FFQ have been widely used in large epidemiological studies due to their ability to assess habitual food intake over extended periods and rank individuals according to dietary patterns(Reference Schatzkin, Kipnis and Carroll15,Reference Mumu, Merom and Ali16) . Despite recall bias and other limitations, they are considered affordable, relatively low burden for participants and straightforward to administer(Reference Mumu, Merom and Ali16,Reference Subar17) . However, these tools, including FFQ and systems like Intake24, rely on embedded food lists, which may not adequately represent the foods actually consumed by all individuals. The use of FFQ developed for the majority of the population may therefore be suboptimal for many individuals with different eating patterns. Black and ethnic minority populations consume both foods common in the mainstream culture and foods that are specific to their own culture. As such, modification of the existing food list is crucial(Reference Thompson and Subar18).
The European Prospective Investigation into Cancer and Nutrition (EPIC) FFQ has been widely utilised in various populations, including British adults(Reference Bingham, Gill and Welch19,Reference Welch, Luben and Khaw20) as well as in Spanish(Reference Larroya, Tamayo and Cenit21) and Lebanese adults(Reference Khaled, Hundley and Bassil22), with adaptation and localisation to reflect culturally specific dietary patterns. It has been validated against other dietary assessment methods and dietary biomarkers in the UK, demonstrating reasonable accuracy in assessing habitual diet(Reference Bingham, Gill and Welch19,Reference McKeown, Day and Welch23) . However, it has not been validated for Black African populations, and its lack of traditional African foods limits its cross-cultural applicability. To ensure its suitability for this population demographic, modification and validation are necessary(Reference Mumu, Merom and Ali16). Since self-reported dietary assessment methods are subject to measurement error, determining the extent of this error is essential before use(Reference Thompson and Subar18). Although no universal gold standard for dietary assessment exists, validation studies provide important insights into the reliability of these methods(Reference Willett, Sampson and Stampfer24,Reference Willet25) .
This study aimed for the first time to modify and validate the EPIC FFQ for assessing dietary intake among Black African women living in the UK, ensuring its relevance and validity performance in capturing dietary patterns within this population.
Materials and methods
Participants
This cross-sectional study included n 112 Black African women aged 18 years or older residing in the UK. The sample size aligns with expert recommendations, which suggest that at least 105 participants are needed to assess the agreement between dietary assessment tools(Reference Mumu, Merom and Ali16,Reference Willet25) . Eligible participants were first- or second-generation Black African immigrant women, who self-identified as such and had a self-reported BMI greater than 25 kg/m2. Individuals with diagnosed chronic conditions such as type 2 diabetes, pre-diabetes, hypertension or coeliac disease were excluded. The assumption was that these individuals would already be receiving dietary guidance, potentially affecting their dietary patterns(Reference Ekong, Hewitt-Taylor and Regmi26).
Participants were recruited between September 2022 and March 2023 using a combination of strategies, including posters, leaflets, social media and more effective informal approaches such as snowball sampling, peer influence and engagement with community gatekeepers. While initial methods yielded limited responses, trusted local figures, particularly respected Black African women played a critical role in encouraging participation through culturally embedded, trust-based networks. Gatekeepers included religious leaders, community organisers and long-standing residents who held informal influence. All participants were fully informed about the study and provided written informed consent prior to their involvement.
Data collection
Social demographic data
Self-reported socio-demographic information including age (years), ethnicity, country of origin, marital status, migration status, length of residence in the UK (years), employment and household income (pounds) was collected from all participants via the Jisc online survey. Additionally, self-reported anthropometric measures of height (m) and weight (kg) were collected to determine BMI of participants using the formula: BMI = Weight (kg)/Height (m2). The BMI classification system categorises individuals into underweight, normal/healthy weight, overweight/pre-obesity and different levels of obesity (obesity 1, obesity 2 and obesity 3) (NICE, 2014)(27).
24-h multiple pass recalls
Participants first completed three 24-h recalls on separate days; two weekdays and one weekend day, to account for intra-individual variability. The recalls were primarily interviewer-administered, although a small number of participants completed them independently (self-administered) due to scheduling constraints. The recalls were conducted using Intake24 (https://intake24.org, UK V2_2022, system version 3, 2022–2023), a web-based, open-source tool using the multiple-pass 24-h recall to assess individual food and drink intake from the previous day(Reference Foster, Lee and Imamura13,Reference Bradley, Simpson and Poliakov28) .
Intake24 provides a structured question order reflecting multiple pass methodology to guide data collection(29). In the initial step, participants entered the time of each eating occasion and provided a quick list of all foods and drinks consumed, in any order they chose. The second step (detail pass) involved reviewing each item on the quick list to select the closest matching foods from the database, with prompts to clarify types, brands, cooking methods and combinations (e.g. tea with sugar and milk). Portion sizes were then estimated using food-specific image options or standard household measures. In the third step (meal gap review), the tool prompted for any missing items, particularly where large gaps or sparse entries were detected. The final step (last chance review) included a checklist of commonly forgotten foods, questions about takeaway consumption in the past seven days, dietary changes since the recall, and additional details such as supplement use and special diets. Traditional African foods required a different approach, as Intake24 was not representative of the dietary practices and commonly consumed foods of Black African populations at the time of data collection. These items were therefore flagged as ‘missing’ within the system. For all missing foods, participants were asked to provide as much detail as possible about the recipes and ingredients, as well as estimates of the portion sizes consumed, to support accurate manual coding and improve the completeness of dietary data.
Modification of the European Prospective Investigation into Cancer and Nutrition FFQ
On completion of the three 24-h recalls, each participant received an invitation via email or text to participate in the completion of the modified version of the EPIC FFQ after a gap of approximately three weeks. The FFQ was completed using the Jisc online software (version 3). The 131-food item EPIC semi-quantitative FFQ was adapted to more accurately reflect the dietary habits of Black African populations in the UK. Although the structure and frequency categories of the original EPIC FFQ ranging from ‘never or less than once per month’ to ‘more than six times per day’, were retained for consistency within a UK-based context, the tool was modified through a series of systematic steps aimed at improving cultural relevance while maintaining methodological integrity.
First, a comprehensive review of scientific literature and existing dietary data on Black African populations in the UK was conducted to identify foods and food groups that were missing or underrepresented in the original FFQ(Reference Goff, Timbers and Style9,Reference Apekey, Copeman and Kime30,Reference Saint Hill and Madukah31) . This process involved evaluating documented nutritional intakes, cultural food preferences, and preparation methods to ensure the inclusion of items that reflected usual consumption patterns within this demographic.
Second, foods items were integrated from the collected 24-h recalls. These recalls yielded a rich dataset of commonly consumed items, which were analysed for their frequency and cultural significance. Drawing from this analysis, additional food items were identified and incorporated into the FFQ. This method mirrors the approach used by Neelakantan and colleagues(Reference Neelakantan, Whitton and Seah32), who highlighted the value of enhancing FFQ content by leveraging complementary dietary assessment tools to improve both cultural relevance and measurement validity.
Third, while modifications focused on improving cultural relevance, all original food items in the EPIC FFQ were retained. This decision ensured the tool remained broadly applicable and supported cross-study comparisons with other populations. Importantly, preserving the original structure facilitates future validation work by allowing comparisons between the modified and original versions of the FFQ. Retaining these items was also appropriate given that UK-based Black African populations may consume Western foods alongside traditional West African dishes.
Finally, newly added food items were carefully categorised and reorganised within the FFQ to reflect their nutritional content and typical usage in meals. For instance, Egusi soup (a traditional melon seed-based dish often eaten with starchy sides) was categorised under ‘soups and sauces’, while Jollof rice was added as a new food item under the ‘potatoes, rice and pasta’ section. Similarly, other commonly consumed foods such as Fufu (a dough-like staple made from pounded starchy roots or grains) were placed in categories that aligned with their culinary roles and nutritional characteristics. This stage of categorisation was informed by a detailed review of the composition and cultural significance of each item. Input was also sought from three nutritionists and dietitians familiar with African diets, who provided informal feedback on the appropriateness and usability of the modified FFQ, helping to ensure content validity during its development.
Data analysis
The FFQ data were analysed through FFQ EPIC Tool for Analysis software that is designed to derive food composition (energy, macro- and micronutrients)(Reference Mulligan, Luben and Bhaniani33). For foods already represented in the Intake24 database(Reference Amoutzopoulos, Steer and Roberts34). Total energy intake and nutrient values were automatically calculated based on the 24-h recall data. For missing foods commonly reported during dietary recalls, a structured coding process was undertaken in collaboration with the Intake24 team at the Medical Research Council. This work represented a major contribution towards improving the database’s coverage of foods regularly consumed by Black African populations. A total of forty-seven missing foods, identified through participant recalls were documented and coded using the West African food composition table(Reference Stadlmayr35), published academic literature(Reference Adepoju and Etukumoh36,Reference Sanusi and Olurin37) , and culturally specific recipe book(38,39) . Each item was assigned a distinct food code and standardised descriptors, along with data on raw and cooked weights, edible portion percentages and nutrient composition per 100 g. Portion sizes for the missing traditional foods were estimated using a combination of standardised methods for household measures based on published data on cultural serving sizes(Reference Sanusi and Olurin37) and direct weighing for non-household measures. Once portion sizes were established, nutrient intakes were manually calculated by multiplying the frequency of consumption by the nutrient composition per 100 g/d and the estimated portion size in grams. These values were then summed to determine the total daily contribution of traditional foods to each participant’s intake(Reference Sharma, Cade and Riste40).
Descriptive results from both the FFQ and 24-h recalls were expressed as means and sd or medians and interquartile range (IQR). Nutrient variables that were not normally distributed did not achieve normality following transformation(Reference Osborne41); therefore, non-parametric methods were used for subsequent analyses.
Total energy intake and nutrient intakes from the FFQ were compared with the average of three 24-h recall questionnaires using Spearman’s rho correlation coefficients. In general, correlation coefficients ranging from 0·4 to 0·6 are often presented as evidence of moderate validity for an instrument(Reference Thompson and Subar18). Therefore, Spearman’s rho coefficient within this range suggests that the FFQ demonstrates a moderate correlation with the 24-h recall method. Adjusted correlation coefficients for total energy intake were calculated using the residual method(Reference Willett42) (with total energy intake as the independent variable and the nutrient as the dependent variable), which adjusts for total energy intake to control for confounding and better isolate associations between specific nutrients and outcomes. The de-attenuated correlations(Reference Rosner and Willett43) were calculated to remove the within-person variability found in the 24-h recall questionnaires using the following formula:
 $rt = r0{\rm{ }}\sqrt 1 + {\rm{ }}\lambda /n$
where rt is the corrected correlation between the energy adjusted nutrient derived from the FFQ and 24-h recall questionnaires, r0 is the observed correlation, λ is the ratio of estimated within-person and between- person variation in nutrient intake derived from the three 24-h recall questionnaires, and n is the number of replicated recalls (n 3). Bland–Altman plots were used to assess agreement between the two methods(Reference Bartlett and Frost44,Reference Bland and Altman45) . For this analysis, the average values of the FFQ and three 24-h recalls ((FFQ + Mean 24 HR)/2) were plotted against the difference in intake between the two methods. The differences were assessed for approximate normality, and the limits of agreement (mean difference ± 1·96 sd (differences)) were used to evaluate the degree of concordance between the two methods. In addition to this, linear regression (24-h recall as dependent and FFQ as independent variables) was conducted for each nutrient to derive the slope coefficient to determine the degree of overestimation or underestimation of nutrient intakes from the FFQ compared with the average of the three 24-h recalls. The assumptions of linear regression were assessed by examining linearity, normality of residuals, homoscedasticity and the presence of outliers. All analyses were conducted using SPSS version 29. A P < 0·05 was considered statistically significant for all analyses.
Results
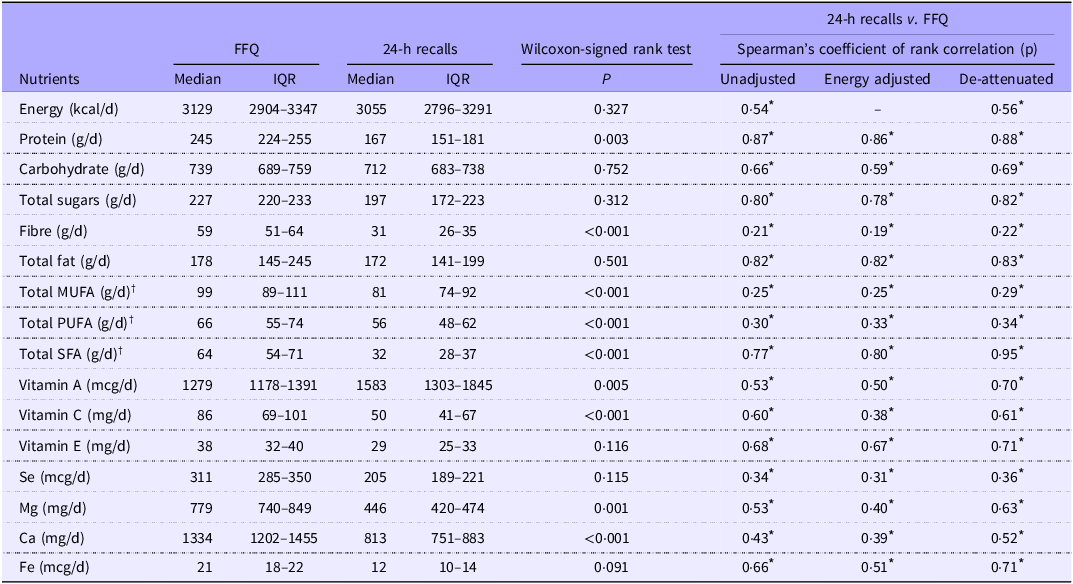
The final version of the adapted FFQ contained 141 food items, which were classified into ten groups as follows: (1) Meat and Fish, (2) Bread and savoury biscuits, (3) Cereals, (4) Potatoes, rice and pasta, (5) Dairy products and fats, (6) Sweets and snacks, (7) Soups, Sauces and spreads, (8) Drinks, (9) Fruits and (10) Vegetables. This represents an increase of ten items compared with the original EPIC FFQ, which originally contained 131 items. Before final use, the adapted FFQ was piloted among ten Black African women to ensure clarity, cultural appropriateness and comprehension. Minor adjustments were made based on participants’ feedback, such as rewording some items. The pilot data were used solely for refining the tool and were not included in the main analysis. A total of 112 participants completed both three 24-h recalls and the FFQ dietary assessments. Participant characteristics are presented in Table 1. Overall, median (IQR) daily nutrient intakes reported via the FFQ were higher than those estimated from the 24-h recalls. For example, protein intake was significantly higher when measured by the FFQ, with a median of 245 g/d (IQR: 224–255), compared with 167 g/d (IQR: 151–181) from the 24HRs. A similar trend was observed for fibre, where the FFQ yielded a median intake of 59 g/d (IQR: 51–64) v. 31 g/d (IQR: 26–35) from the 24HRs, a difference that was statistically significant (P < 0·001). Other nutrients such as total saturated fat, Ca, Mg, vitamin C and Se also showed significantly higher median values when assessed using the FFQ (Table 2) (P < 0·05).
Characteristics of study participants (n 112)

NB: n = number of participants.
Median, 25th and 75th percentile for daily nutrient intakes from the FFQ and 24HR, correlation coefficients and Wilcoxon signed rank test (n 112)

* Correlation is significant at P < 0·01.
† MUFA, PUFA and SFA.
Correlation coefficients between nutrient intakes estimated by the FFQ and the mean of the 24HRs varied by nutrient, with all values being statistically significant. Crude (unadjusted) Spearman rank correlations ranged from 0·21 for fibre to 0·87 for protein. After adjusting for total energy intake, correlations slightly decreased but remained statistically significant, ranging from 0·19 for fibre to 0·86 for protein. De-attenuation of these correlations to account for within-person variability in the 24HR recalls led to an increase in all coefficients, ranging from 0·22 for fibre to 0·88 for protein. These findings suggest that the FFQ performs well in estimating some nutrients, particularly protein and sugar, while demonstrating lower validity for others such as fibre and polyunsaturated fats. (Table 2).
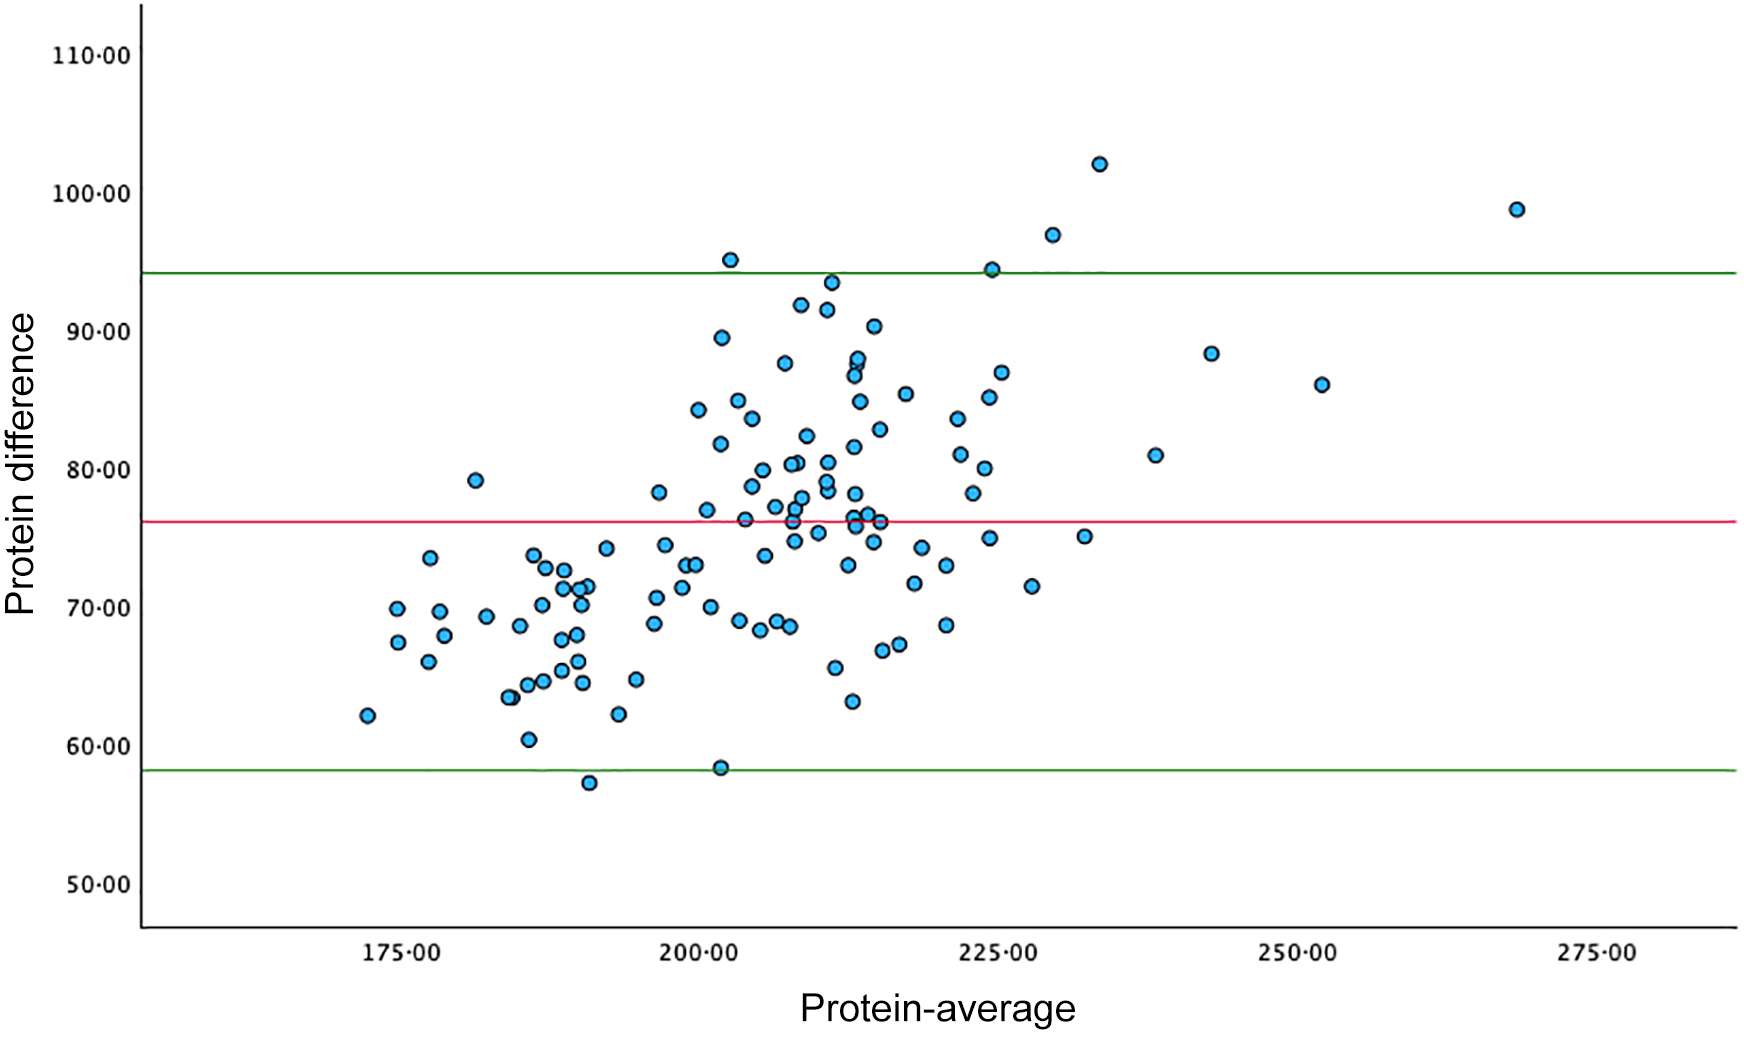
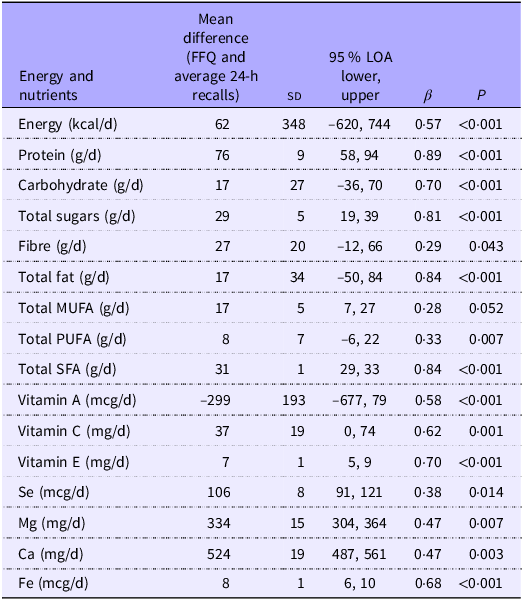
Bland–Altman plots were used to assess the agreement between the FFQ and 24HR methods for energy, key macronutrients (protein, carbohydrate and fat) and sugar (Figures 1–5). The plots revealed that, on average, the FFQ overestimated nutrient intakes compared with the 24HRs, with varying levels of agreement. For energy, the mean difference was +62 kcal/d, but the limits of agreement were wide (from −620 to +744 kcal/d), indicating considerable variability at the individual level. Protein showed a mean difference of +76 g/d with relatively narrow limits of agreement (58–94 g/d) and a high β-coefficient of 0·89 (P < 0·001), suggesting strong agreement. Carbohydrate intake was overestimated by 17 g/d on average, with limits of agreement from −36 to +70 g/d and a β-coefficient of 0·70 (P < 0·05). Total sugar intake was overestimated by 29 g/d with limits of agreement between 19 and 39 g/d, while total fat showed a mean difference of +17 g/d with broader agreement limits (from −50 to +84 g/d), but both nutrients demonstrated high agreement as indicated by β-coefficients of 0·81 and 0·84 respectively (P < 0·05). Fibre had a poorer agreement, with a mean difference of +27 g/d and limits ranging from −12 to +66 g/d, reflecting both the FFQ’s consistent overestimation and the variability in its estimates compared with the 24HR method. These results, presented in Table 3 and Figures 1 through 5, indicate that while the FFQ generally overestimates intake levels relative to 24HR recalls, it demonstrates acceptable validity and agreement.
Bland–Altman plot of difference between energy as predicted by the FFQ and mean of three 24-h recalls.

Bland–Altman plot of difference between protein as predicted by the FFQ and mean of three 24-h recalls.

Bland–Altman plot of difference between carbohydrate as predicted by the FFQ and mean of three 24-h recalls.

Bland–Altman plot of difference between sugar as predicted by the FFQ and mean of three 24-h recalls.

Bland–Altman plot of difference between fat as predicted by the FFQ and mean of three 24-h recalls.

Limits of agreement (LOA) and β-coefficients between FFQ and average of three 24-h recalls *

* Mean difference and LOA were derived through a one-sample t test. β-coefficients and P values were derived through a linear regression.
Discussion
This study demonstrates that the culturally adapted version of the EPIC FFQ is a valid tool for assessing habitual dietary intake among Black African women residing in the UK. The FFQ, modified to reflect culturally specific foods and eating patterns, showed moderate to strong validity for a range of nutrients when compared with three non-consecutive 24-h recalls, with all correlation coefficients reaching statistical significance. Notably, de-attenuated Spearman coefficients ranged from 0·22 for fibre to 0·88 for protein, indicating good performance for key macronutrients, particularly protein and fat. Bland–Altman analyses supported these findings, with relatively small mean differences and acceptable limits of agreement for most nutrients, especially protein and sugar, further reinforcing the FFQ’s capacity to provide reasonable group-level estimates of dietary intake in this population.
A consistent trend observed across nutrients was the overestimation of intakes by the FFQ relative to the 24HRs, a well-documented phenomenon in validation research(Reference Saravia, Moliterno, Skapino, Caballero, Finglas and Toldrá46). This may be attributed to the nature of FFQ, which prompt respondents to recall typical intake over extended periods and may encourage over-reporting, especially for frequently consumed or culturally salient foods. The inclusion of a broader, culturally relevant food list may have amplified this tendency by increasing respondents’ likelihood of recognising and affirming intake of familiar items. Notably, the expansion of the FFQ from 131 to 141 items included energy-dense and commonly consumed foods, which may have further contributed to overestimation through repeated reporting of similar items and higher cumulative intake estimates. For example, the FFQ overestimated protein intake by 76 g/d on average and fibre by 27 g/d, reflecting not only methodological biases but potentially also a more comprehensive capture of habitual consumption patterns, especially of traditional foods.
These findings align with those of El Kinany et al. (Reference El Kinany, Garcia-Larsen and Khalis47), who validated a culturally adapted FFQ among Moroccan adults compared with 24-h recalls. Their tool, which incorporated 255 culturally specific items, yielded de-attenuated correlation coefficients ranging from 0·24 (fibre) to 0·93 (total MUFA). The strong correlations reported in their study mirror those in the current analysis and further support the notion that cultural adaptation enhances the accuracy of dietary tools. Similar validation efforts in other populations such as those by Shatylo and Solovyova(Reference Shatylo and Solovyova48) in Ukraine and Khaled et al. (Reference Khaled, Hundley and Bassil22) in Lebanon, who reported more weak correlations with coefficients in the range of 0·07–0·46 and −0·002–0·34, respectively. Despite differences in methodology, food environments and population characteristics, a common pattern across all studies, including ours, was the FFQ’s tendency to overestimate intake compared to reference methods. These consistent trends underscore the reliability of culturally adapted FFQ in capturing habitual dietary patterns, particularly when used at the population level.
The present study contributes significantly to an under-researched area of nutritional epidemiology by focusing on a demographically distinct and culturally rich population often overlooked in dietary research. The inclusion of both traditionally African and Westernised food items ensures that the adapted FFQ reflects dietary transitions occurring within Black African communities in the diaspora. This is particularly important given the increasing interest in understanding the nutrition-related health risks among migrant and ethnic minority populations(Reference Leung and Stanner10). The capacity to accurately capture both traditional and modern eating patterns makes this FFQ especially relevant for assessing the impact of dietary acculturation and for designing culturally appropriate nutrition interventions.
Beyond its cultural relevance, the study is methodologically rigorous. The use of three non-consecutive 24HRs as a reference method is in line with best practices in dietary validation studies and helps mitigate day-to-day variation in dietary intake(Reference Thompson and Subar18). However, as a self-report tool, Intake24 remains subject to measurement error and underreporting, as shown in validation studies using doubly labelled water(Reference Foster, Lee and Imamura13,Reference Bradley, Simpson and Poliakov28) . The decision to apply de-attenuation procedures further strengthens the analysis by correcting for within-person variation inherent in the 24HR method(Reference Lombard, Steyn and Charlton49). Nevertheless, energy adjustment led to slightly weaker correlations, a trend observed in previous studies and likely due to the reduction of inter-individual variability following standardisation for energy intake(Reference El Kinany, Garcia-Larsen and Khalis47).
However, some limitations must be acknowledged. First, the relatively short data collection period may not have captured seasonal dietary variations. This is particularly relevant for populations with food traditions tied to religious or cultural calendars. Second, the FFQ’s length-141 items, though justified by the need for cultural specificity, may have introduced respondent fatigue or reduced accuracy among individuals with lower literacy levels. In addition, the inclusion of energy-dense and commonly consumed foods within the expanded FFQ may have contributed to overestimation of intake, as discussed earlier. Third, the study sample was skewed towards women with higher educational attainment, potentially limiting generalisability to the broader Black African population in the UK, which spans diverse socioeconomic and educational backgrounds. Expanding recruitment to include individuals with lower literacy levels and those from a broader range of African subgroups would enhance representativeness.
A further methodological limitation arises from the inherent differences between FFQ and 24HRs(Reference Thompson and Subar18,Reference Moshfegh, Rhodes and Baer50) . While the former assesses long-term intake and is susceptible to recall and social desirability bias, the latter reflects short-term intake and may underrepresent episodically consumed foods. Thus, while the use of both tools is complementary, correlations between them must be interpreted with caution, as they may reflect the unique biases inherent in each dietary assessment method. The application of statistical corrections such as de-attenuation helps address this issue but does not eliminate the underlying methodological discordance between tools.
Despite these limitations, the adapted EPIC FFQ has significant potential for use in epidemiological research, dietary surveillance and public health nutrition targeting Black African women in the UK. Its modification and validation represent a critical advancement in the pursuit of equitable, inclusive and accurate dietary assessment tools. As the UK population continues to diversify, the need for culturally sensitive methodologies becomes increasingly urgent; not only to improve dietary measurement but also to inform effective, targeted health interventions.
Conclusion
To the best of our knowledge, the present study provides the first validation of a culturally adapted EPIC FFQ for use among Black African women living in the UK and demonstrates that the tool has acceptable validity in assessing habitual intake, particularly of macronutrients. The inclusion of traditional and Westernised foods enhanced the FFQ’s relevance and applicability to this population, and its performance compares favourably with similar validation efforts globally. While further refinement, longer-term testing and broader population inclusion are recommended, the tool represents a meaningful step toward addressing the lack of culturally appropriate dietary assessment methods in nutritional epidemiology. Future research should continue to explore ways to adapt and validate the instrument for diverse populations to ensure more equitable and accurate dietary data collection. Additionally, future research investigating the validity of the modified EPIC FFQ further, incorporating nutritional biomarkers for a more rigorous evaluation is warranted.
Acknowledgements
We sincerely appreciate all the participants whose involvement was essential to the success of this study. Our gratitude extends to the staff from Intake24, Medical Research Council Epidemiology Unit at the University of Cambridge. Intake24 is an open-source dietary assessment tool, originally created by Newcastle University (UK) and funded by Food Standards Agency, Scotland. Intake24 is now maintained and developed by the University of Cambridge (UK) and Monash University (Australia), in collaboration with research users. The version of Intake24 used in this study was provided by the University of Cambridge.
This study did not receive dedicated funding. However, elements of the work were supported by the NIHR Cambridge Biomedical Research Centre (NIHR203312). The views expressed are those of the authors and not necessarily those of the NIHR or the Department of Health and Social Care.
Study conception and design: I. O., E. K., K. M., N. B. and F. T. Data collection: I. O. Analysis and development of tools: I. O., B. A., S. A., P. P., M. A. A., T. E. A., A. E. Statistical analysis: I. O., E. K., K. M., N. B. and F. T. Manuscript preparation: I. O. Manuscript revision: I. O., E. K., K. M., N. B., F. T., B. A., S. A., P. P., M. A. A., T. E. A. and A. E. All authors have read and approved the final manuscript.
The authors declare no competing interests.
This study was conducted according to the guidelines laid down in the Declaration of Helsinki, and all procedures involving human subjects/patients were approved by the St Mary’s University Research Ethics Committee, with approval reference number (SMU_ETHICS_2021-22_368). Written informed consent was obtained from all participants.
Patient consent for publication: Not applicable.