

Background
Traditionally, the role of neuroimaging in the assessment of cognitive impairment and dementia has been limited to excluding unsuspected causes such as tumours and inflammatory and metabolic disorders. Clinical guidelines in the USAReference Knopman, DeKosky and Cummings1 and EuropeReference Waldemar, Dubois and Emre2 (UK guidance: http://www.nice.org.uk/cg42) recommend that patients with suspected dementia have computed tomography (CT) or MRI scans, with some guidance strongly favouring MRI,Reference Waldemar, Dubois and Emre2 largely because of the ability of MRI to reveal microvascular changes in more detail.Reference Scheltens and Korf3 Recent research criteria for AD now also include MRI features.Reference Dubois, Feldman and Jacova4 So increasingly, people with early memory symptoms will have MRI. New approaches that maximize the amount of information gleaned from these scans are of considerable interest.
The potential of volumetric MRI to reveal underlying patterns of neurodegeneration, thus supporting and refining the diagnosis of specific subtypes of dementia is being recognized increasingly.Reference Fox and Schott5 Methods are emerging that extract information about the pattern of grey matter loss from volumetric T1-weighted images, which can be acquired on most scanners as part of a routine clinical MRI study. Furthermore, developments such as the Alzheimer's Disease Neuroimaging Initiative (ADNI),Reference Mueller, Weiner and Thal6 the most comprehensive effort to date to identify neuroimaging biomarkers, is leading to greater standardization of MRI acquisition.
The ultimate diagnostic value of MRI will rely on progress along three axes: first, the application to increasingly early stages of disease. For AD, this involves moving from clinically established AD to mild cognitive impairment (MCI), a term for early symptomatic cognitive problems that encompasses prodromal AD, and beyond that to the discrimination of successful from less successful ageing. Second, to fulfil a diagnostic role, a marker needs to progress from identifying differences between groups to predictions in individuals. Third, techniques that provide diagnostic predictions from increasingly short periods of observation should be sought: an ideal method would provide a diagnosis from a single time-point or snapshot.
The onset of neurodegeneration needs to be identified from a background brain structure that is dynamic rather than static: the volumetric changes of normal ageing provide a shifting frame of reference against which possible degenerative changes have to be evaluated. Neurodegeneration in AD is not anatomically uniform and follows a pattern of hierarchical vulnerability, beginning in regions that include the entorhinal cortex and subfields of the hippocampus and spreading to involve limbic and then neocortical regions.Reference Braak and Braak7 This pattern is distinct from that of ageing and provides a basis for drawing diagnostic information from MRI scans.Reference Fox and Schott5
Search strategy
Initial search terms were ‘Alzheimer's disease’ (or ‘AD’), ‘mild cognitive impairment’ and ‘MRI’. These were supplemented, for specific parts of the review, by the terms ‘hippocampus’, ‘hippocampal atrophy’ and ‘ageing’ (or ‘aging’). Secondary searches were performed with the additional search terms ‘automatic diagnosis’, ‘automatic classification’ and ‘support vector machine’ alone and in combination with previously entered terms. The reference lists of key papers identified with the above terms were also searched for relevant articles.
Ageing: neocortical and medial temporal grey matter
Volumetric studies have reported ageing effects in topographically widespread areas of the neocortex and grey matter structures of the medial temporal lobe that include the entorhinal cortex, perirhinal cortex, hippocampus and amygdala. However, there is considerable variability and inconsistency in the existing data.Reference Walhovd, Westlye and Amlien8 Part of this variability arises from overall study design (longitudinal or cross-sectional) and variations in the methods for image acquisition and analysis. Even taking account of methodological and design variations, ageing effects in the cerebral cortex are highly heterogeneous, with some cortical regions displaying much more striking ageing effects than others. In a meta-analysis that standardized methods across multiple different ageing samples, the strongest age effects were seen in frontal cortex and superior temporal lobe, with the inferior temporal cortex and anterior cingulate relatively spared.Reference Walhovd, Westlye and Amlien8 A number of regions show non-linear age effects. For example, in the hippocampus accelerating atrophy is seen with increasing age,Reference Walhovd, Fjell and Reinvang10, Reference Lupien, Evans and Lord11 so that variations in the age range studied could also be a factor in inconsistencies between studies.
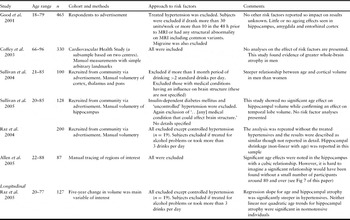
A less frequently acknowledged and less transparent source of variability is the definition of what constitutes ‘normal ageing’. One manifestation of this is variability in the approach to vascular risk factors and common medical conditions that have a proven or suspected impact on brain structure. For example, hypertension, type 2 diabetes and use of medication are increasingly common with age and some degree of white matter abnormality on MRI is almost ubiquitous.Reference De Leeuw, de Groot and Achten12 Studies of brain structure in ageing differ widely in their approach to these factors (see Table 1), with some meticulously excluding individuals with factors thought to influence brain structure, generating ‘clean’ cohorts of healthiest ageing, while others take a more inclusive and demographically representative view.
Analysis and impact of vascular risk factors in selected volumetric studies of ageing

Notes: classical risk factors include hypertension, diabetes mellitus, hypercholesterolaemia and smoking. Studies vary in their approach to alcohol, so this is described separately. The table includes studies that provide at least some information about risk factors and those that provide measurements of either the cortex or medial temporal grey matter. The table includes studies of over 100 participants as well as selected smaller studies. In general, stronger age effects on the hippocampus are found in studies that include individuals with risk factors. Gender effects are also prominent in some of these studies.
Ageing, risk factors and the hippocampus
Perhaps the best example of the effects of age and vascular risk on heterogeneity between studies is provided by the hippocampus. This is a critical structure for memory and memory impairment in AD, yet has generated some of the most inconsistent findings in volumetric studies of ageing. Ageing effects in the hippocampus tend to be strikingly non-linear so that variations in the age range of individuals recruited (Table 1) is one factor likely to have contributed to inconsistency in the strength of ageing effect.Reference Espeseth, Westlye, Fjell, Walhovd, Rootwelt and Reinvang13, Reference Raz, Gunning-Dixon, Head, Rodrigue, Williamson and Acker14 In the analysis of multiple samples carried out by Walhovd et al.,Reference Walhovd, Westlye and Amlien8 significant effects were seen in 4 of 5 samples, and a non-linear relationship that accelerated with age was found across samples. The one sample in which age effects had not been found had an upper age limit of 56 years, so that ageing effects in the hippocampus would have been expected to be weak.
The profile of vascular risk may also influence ageing effects in this region. Many, but not all studies that have carefully excluded vascular risk have shown that the hippocampus is relatively resistant to age-related change.Reference Good, Johnsrude, Ashburner, Henson, Friston and Frackowiak9 For example, a study of 465 adults adopting voxel-based morphometry found that hippocampal volume declined less with age than the global grey matter average.Reference Good, Johnsrude, Ashburner, Henson, Friston and Frackowiak9 This study was assiduous at excluding vascular risk (Table 1). The fact that some ageing studies have excluded individuals with white matter lesions is also relevant, as in some cohorts lesion burden correlates both with risk factors and with hippocampal volume.Reference De Leeuw, Barkhof and Scheltens15 In one of the few longitudinal studies of ageing, observed hippocampal atrophy was driven by the inclusion of treated hypertensives, to the extent that ageing effects were not significant when this subgroup was excluded.Reference Raz, Lindenberger and Rodrigue16
Diagnosis of AD and hippocampal volume: from groups to individuals
Knowledge of the pattern of hierarchical vulnerability in AD provides a basis for diagnosis from simple visual inspection of scans. Based on experience and prior knowledge, trained radiologists correctly classify 65–95% of scans into either normal ageing or AD, but accuracy varies across studies, samples and individual raters.Reference Likeman, Anderson and Stevens17, Reference Kloppel, Stonnington and Barnes18
The place of the hippocampus early in the hierarchy of vulnerability in ADReference Braak and Braak7 has made it an obvious focus for more detailed interrogation by MRI. As a result of this, a number of techniques have emerged for deriving accurate quantitative measures of hippocampal volume.Reference Jack, Petersen, O'Brien and Tangalos19, Reference Pruessner, Li and Serles20 Furthermore, these measurements have been shown to correlate with the density of neurofibrillary tangles at post-mortem.Reference Zarow, Vinters and Ellis21, Reference Zarow, Vinters and Ellis22 Studies of monogenic AD have strengthened the rationale by showing that hippocampal atrophy begins 3–4 years before symptoms, so that hippocampal measurements should be useful at the time of clinical presentation.Reference Schott, Fox and Frost23
At a group level, differences in hippocampal volume between established AD and age-matched controls, and between MCI and controls, have been delineated consistently across a number of studies.Reference Jack, Petersen and Xu24–Reference Gerardin, Chetelat and Chupin26 Furthermore, at a group level, hippocampal volume is associated with risk of conversion from MCI to AD.Reference Jack, Petersen and Xu25, Reference Visser, Scheltens and Verhey27
At an individual level, use of hippocampal volumes adds sensitivity to the diagnosis of AD. Put differently, in some patients in whom cognitive scores are equivocal, evidence of small hippocampi can lead to a firm diagnosis. In studies of patients with clinically established AD, up to 80–85%Reference Colliot, Chetelat and Chupin28, Reference Frisoni, Laakso and Beltramello29 of individuals can be correctly categorized into AD or healthy older adult groups according to hippocampal volume alone. Hippocampal volume also helps to distinguish MCI from healthy older adults, albeit with lower accuracy – 73% in one study.Reference Colliot, Chetelat and Chupin28 Many of these studies have not sought explicitly to assess the added value of hippocampal measurements when put alongside clinical diagnosis. However, given that widely accepted clinical criteria achieve an accuracy of roughly 65–85% in predicting pathological diagnosis,Reference Tierney, Fisher and Lewis30 the impact at an individual level is likely to be moderate.Reference Wahlund, Almkvist and Blennow31
Why is the diagnostic value of hippocampal volumetry limited? At least part of the reason lies in variability in hippocampal size in normal individuals. Interestingly, this inter-individual variability is as great in young as in old individuals,Reference Lupien, Evans and Lord11 suggesting that this is due to factors other than the impact of ageing and age-related pathology. This true biological variability in size means that there will always be a limit to the diagnostic value of a single measurement of hippocampal volume.
Automatic computerized diagnosis: why and how does it work?
Although much work has focused on detecting structural changes in the hippocampus, by the time individuals become symptomatic in AD neuropathological changes are established in the neocortex.Reference Chetelat, Landeau and Eustache32–Reference Baron, Chetelat and Desgranges34 Making use of structural information across the whole brain might improve diagnosis on an individual basis.Reference Davatzikos, Xu, An, Fan and Resnick35 If the earliest stage of AD is associated with subtle but widely distributed loss of grey matter volume, it is possible that early changes might evade detection by the naked eye in any individual location (or even by volumetric measurement if they are ‘sub-voxel’, that is smaller in magnitude than a single MRI voxel). However, summing such subtle changes across the whole brain might make early detection of onset possible. Because the changes in cortical structure that accompany ageing and classical AD follow distinct anatomical patterns,Reference Driscoll, Davatzikos and An36–Reference Whitwell, Przybelski and Weigand38 the addition of spatial and anatomical information about cortical changes should improve the delineation of the boundary between ageing and AD in an individual brain. These issues have provided a rationale for efforts aimed at automated diagnosis based on computational analysis of brain images.
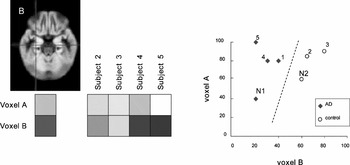
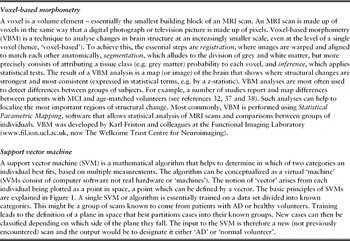
A number of image analysis methods allow structural measures across the whole brain to be considered simultaneously. Some, such as voxel-based morphometry (see Box), are adapted largely for detecting differences between groups rather than individual scans.Reference Ashburner, Csernansky, Davatzikos, Fox, Frisoni and Thompson39 The technique most widely applied to the problem of individual diagnosis of AD is the use of support vector machines (SVMs)Reference Kloppel, Stonnington and Chu40 (see Box). The basic principle behind SVMs is illustrated in Figure 1. The example in the figure shows how the image intensity at two voxels in the brain might be used to distinguish AD from controls. To use information from these voxels across a number of individuals, the corresponding locations must be identified in all individuals. This is done by registration – a process whereby scans of multiple individuals are aligned with each other and often with a widely used template. The intensity (corresponding, for example, to the density of grey matter) is plotted as a graph so that a line can be calculated that best separates the groups. In practice, a typical volumetric MRI scan is made up of several thousand voxels, not just two, so the result is not a line but a plane in multi-dimensional space (or hyperplane). An SVM is trained on a set of images with known diagnoses to define the optimal plane of discrimination. It then classifies new scans according to whether they fall on the ageing or AD side of the dividing plane.
The basic principles of diagnosis based on a support vector machine (SVM). The image (top left) is an image of grey matter density with bright signal indicating a higher proportion of grey matter within a voxel. In this example, the SVM uses intensity at two voxels – in cortical grey matter (A, not shown) and in the hippocampus (B, marked by the cross in the grey matter image). The intensity at each voxel is shown for the index subject and four further subjects with a known diagnosis (either AD or control). By plotting these intensities as a graph the SVM can calculate a line which best separates the diagnostic groups. New cases, labelled N1 and N2, can then be given a diagnosis based on which side of the line they fall.

Some terms in computational MRI

Automatic diagnosis: separating AD from ageing
SVMs trained on cases with established AD have been found to perform well, at an individual level, in making a diagnosis of AD. In one study, patients with mild, clinically probable AD were correctly classified in 89% of cases and up to 96% of pathologically verified cases were classified correctly.Reference Kloppel, Stonnington and Chu40 A direct comparison with radiologists has shown that SVMs perform as well as the most accurate neuroradiologist and better than less experienced radiologists.Reference Kloppel, Stonnington and Barnes18
Davatzikos and co-workersReference Davatzikos, Fan, Wu, Shen and Resnick41–Reference Misra, Fan and Davatzikos43 have extended these findings to progressively earlier stages of disease and most recently to healthy ageing to determine whether evidence of an AD-like footprint can be identified in some asymptomatic older individuals. In general in these studies, classification algorithms were trained on scans drawn from the AD Neuroimaging Initiative (ADNI) database: by using cohorts with clinically established AD and healthy controls from this database, the classification algorithm was able to generate simple measures to express the extent to which the structural pattern of a new individual scan was ‘AD-like’ or ‘normal ageing-like’. In studies of MCI, several conclusions have emerged:
(i) looked at retrospectively, the brains of individuals with MCI show faster development of an ‘abnormal’ pattern of atrophy, which appears to predate clinical symptoms so that the pattern is well-established by the time of MCI diagnosis.Reference Davatzikos, Fan, Wu, Shen and Resnick41
(ii) in subjects with MCI a greater degree of abnormality (i.e. a more ‘AD-like’ pattern of atrophy) is associated with more rapid decline in MMSE scores over one year.Reference Fan, Batmanghelich, Clark and Davatzikos42
(iii) this spatial pattern of atrophy also predicts conversion to AD over a 15-month follow-up period.Reference Misra, Fan and Davatzikos43
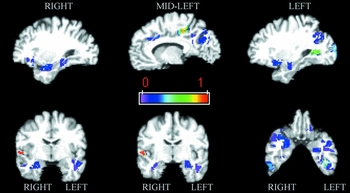
An additional, noteworthy aside is that these studies provide direct evidence that subtle, distributed changes across the brain, considered collectively, provide better predictions about diagnosis and progression than measurements from a small number of key regions. An SVM based on multiple regions was found to classify over 90% of new scans into MCI or control groups, while a combination of hippocampal and entorhinal cortex volumes at best correctly assigned 77% of individual scans.Reference Davatzikos, Fan, Wu, Shen and Resnick41 The optimal number of regions to provide diagnostic discrimination was approximately twenty,Reference Davatzikos, Fan, Wu, Shen and Resnick41 more than enough to make a region of interest approach unwieldy. The regions that contributed most to the discrimination between ageing and MCI are shown in Figure 2. Regions with discriminatory value included the hippocampi, posterior cingulate, temporal neocortex and orbitofrontal regions. Reassuringly, these results from an anatomically unbiased approach are consistent with studies based on regions of interest drawn a priori. Reference Driscoll, Davatzikos and An36 It is also noteworthy that the most discriminatory regions display only weak or inconsistent ageing effects in the studies of healthy ageing described above.Reference Walhovd, Westlye and Amlien8, Reference Good, Johnsrude, Ashburner, Henson, Friston and Frackowiak9
Brain regions that collectively form a spatial pattern of brain atrophy that allows discrimination of MCI from age-matched controls. These regions were identified by generating an SVM classifier. The scale of 0 to 1 indicates the importance of each region for classification. Further details of how this map was derived are given in reference 41. Note that regions known to be involved in AD offer discriminatory value including the hippocampi, superior, middle and inferior temporal gyri, left fusiform gyrus and the posterior cingulate cortex. Reproduced, with permission from Elsevier: Davatzikos et al., Neurobiology of Aging 2008; 29: 514–523.

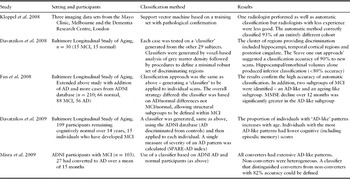
In a study based on the Baltimore Longitudinal Study of Aging cohort,Reference Davatzikos, Xu, An, Fan and Resnick35 the extent to which a scan was AD-like was expressed more explicitly as an index – the SPARE-AD index – with positive values indicating a more AD-like pattern of brain structure. A higher SPARE-AD index was associated with greater cognitive decline in ageing, suggesting that it was a corollary of less successful ageing. The most obvious conclusion is that the SPARE-AD index is pointing to unsuspected AD neuropathology in a subset of older adults who have pre-symptomatic AD. It remains to be seen whether this index will predict the development of MCI and ultimately AD in these individuals and other similar cohorts over time. Table 2 summarizes studies that have applied SVMs to the issue of AD diagnosis.
Studies of automatic scan classification in AD and MCI

Automatic differential diagnosis
The predictive value of hippocampal volumetry at an individual level is also hampered by low specificity. Considerable overlap is seen not only with age-matched healthy subjects but also across a range of other dementias including fronto-temporal lobar degenerations (FTLD)Reference Likeman, Anderson and Stevens17 and dementia with Lewy bodies (DLB).Reference Burton, Barber and Mukaetova-Ladinska44 This lack of specificity of hippocampal atrophy is perhaps reflected in studies of radiological diagnosis: while radiologists were able to separate AD from ageing with 87% accuracy, their ability to separate different subtypes of young-onset dementia was less good.Reference Likeman, Anderson and Stevens17
In many cases, the distinction between FTLD, AD and DLB will be based on clinical history and cognitive features but this is not always straightforward. A number of factors can muddy neuropsychological distinctions including language, education, pre-morbid IQ and co-operation during testing, so that in many cases MRI will be a useful adjunct.
SVM-based classification has been applied to this problem in pathologically confirmed subtypes of dementia. An SVM approach was able to correctly classify AD and FTLD in 85–95% of cases,Reference Kloppel, Stonnington and Chu40 which compares favourably with previous results based on visual inspection.Reference Likeman, Anderson and Stevens17 A distinct pattern of atrophy has been described in DLB, but so far automatic classification methods have not been applied to this group. More sophisticated approaches with multiple SVMs might adopt indices like the SPARE-AD index – for example, generating measures that express the extent to which a scan is DLB-like and FTLD-like, as well as AD-like. The approach could be applied to any group for which a training set can be defined so that the potential applications in differential diagnosis are wide-ranging.
Automatic diagnosis: the effect of age
One factor that appeared to interfere with the performance of an SVM in individual patients was extremes of age. Misclassified cases were often the oldest cases.Reference Kloppel, Stonnington and Chu40 In the comparison of pathologically confirmed AD and ageing for example, one 86-year-old control and an 89-year-old patient with clinically mild AD were misclassified. For classification errors between FTLD and AD there was no clear relationship with age. The effect of age on classification accuracy has not been studied systematically, but these examples suggest it does have an important effect. Furthermore, up to now the impact of cerebrovascular disease and vascular risk has not been examined. It will be an important next step to expose classification methods to the full range of age and co-morbidity encountered in common clinical settings and to examine the impact of these factors explicitly.
Strengths, limitations and future perspectives
Identifying patterns of atrophy: the strengths of computational neuroanatomy
Approaches based on computational neuroanatomy already provide highly accurate diagnostic classification at an early clinical stage (MCI) and at an individual level. Furthermore, these results have been achieved based on the cross-sectional analysis of a single snapshot scan. The potential of these techniques in the clinical domain is substantial: automatic analysis of scans could be performed rapidly and cheaply without specialist radiologists; and experience from one centre could easily be shared with others, through trained classification algorithms. Generating a probability of AD based on historical, well-characterized cohorts could be a valuable adjunct and a source of improved standardization between centres.
The most widely studied single structure to which volumetric methods have been applied is the hippocampus. This method has greater simplicity and, in turn, clear face validity (i.e. it is hard to argue with the relevance of a shrinking hippocampus). The main problem is that individual variations in normal hippocampal size make it hard to interpret a single snapshot measurement. Longitudinal measurements are needed to provide specificity, which delays clear predictions about diagnosis. The principal advantage of computational approaches is therefore the ability to make more accurate predictions from a single scan. Furthermore, the studies with SVMs have provided direct evidence that consideration of multiple regions including the neocortex improves diagnostic predictions compared with those based on the medial temporal lobe alone. These results suggest that interrogation of the detailed spatial pattern of atrophy reveals more latent information about the history of neurodegeneration and, by testing the boundary between ageing and AD at more than one point, sensitivity to abnormal patterns of atrophy can be improved.
The main outstanding question is how computational neuroanatomy techniques will deal with the heterogeneity – in terms of age, co-morbid conditions and mixed pathology – that is typical of normal clinical practice. Truly prospective studies, in representative samples and in comparison with existing alternatives such as assessment of hippocampal size and shape,Reference Gerardin, Chetelat and Chupin26, Reference Scher, Xu and Korf45 are now needed to evaluate the value in real clinical populations. These studies need to have three key ingredients. They need to address the issue of added value as an adjunct in diagnosis. Many studies provide data on sensitivity, specificity and correct classification rates, but fail to adequately define how these values compare with those obtained by conventional assessment, for example by clinical interview, examination and standard cognitive tests. Studies that have compared diagnostic rates based on MRI alone with conventional clinical diagnosis largely miss this point. It is important that future studies report full clinical and cognitive findings at the time of MRI to allow careful, direct comparisons. Secondly, validation studies need to adopt a clear gold standard, ideally based on pathological examination. More stringently, neuropathological validation should be performed in a sample representative of the setting in which a new technique might be applied. This is a challenging criterion as neuropathological examination is most likely to occur in unusual cases and at highly specialist centres,Reference Kloppel, Stonnington and Chu40 whereas SVMs are likely to be most useful in supporting high throughput early diagnosis (along the spectrum from MCI to ageing). Only one study so far has attempted to address these issues.Reference Kloppel, Stonnington and Chu40 Finally, truly prospective studies are needed. Classification methods have been applied to longitudinal data sets, but often not directly to prospective prediction of diagnosis. Selection bias is a major problem in retrospective analyses, even if applied to longitudinal data. Selection is usually based on final diagnosis, so is strongly biased towards those who achieve a clear unitary final diagnosis: paradoxically, those in whom new diagnostic techniques are most needed – those in mixed diagnostic categories, or in whom the diagnosis remains unclear – are most likely to be excluded.
Pathology, anatomy and dementia syndromes
Regional patterns of atrophy provide a footprint of neurodegeneration, but do not provide direct evidence of the type of underlying pathology. A recurring motif of the neurodegenerative dementias is that the links between the different levels of pathology, neuroanatomy and clinical syndrome are variable and can be both divergent and convergent.Reference Van Der, Sleegers and Van46 Pathological entities are often pleiomorphic – for example, AD has a classical amnestic form and a number of rarer variants including the subtypes of posterior cortical atrophy.Reference Alladi, Xuereb and Bak47 Conversely, disparate pathologies can cause seemingly indistinguishable clinical syndromes such as progressive non-fluent aphasia.Reference Alladi, Xuereb and Bak47 These biological properties place inherent limitations on the predictive power of recognition of a particular anatomical footprint, which would be expected to relate more closely to the clinical syndrome than the causative pathology.
However, the precise limits are unknown and automatic classification techniques provide a means of investigating as well as exploiting these limits. For example, it is not known whether progressive non-fluent aphasia due to AD has a pattern of atrophy subtly different from that of tau-positive neuropathology,Reference Josephs, Duffy and Strand48 which might be exploited to distinguish them when behavioural and cognitive assessments cannot. MRI classifications might therefore provide sharper tools with which to dissect neuroanatomical subtypes and thereby contribute to a better understanding of subtle differences in clinical syndromes.Reference Rohrer, Crutch, Warrington and Warren49
Integration with other imaging techniques
Positron emission tomography (PET) measures of blood flow and amyloid deposition (using Pittsburgh Compound B or PiB) have also been put forward as early markers of AD.Reference Jack, Lowe and Weigand50 However, the diagnostic utility of PiB-PET at an individual level is limited by the observation that a proportion of cognitively intact individuals (often recruited as controls) demonstrate increased PiB uptake. The information gleaned from PiB-PET has been shown to be complementary to that from MRI-based hippocampal measurements.Reference Jack, Lowe and Weigand50 It remains to be seen how PET imaging markers might be integrated with more sophisticated MRI methods such as those for automatic diagnosis, but the anatomical patterns of atrophy and PiB uptake are not perfectly overlapping, so it is likely they will provide complementary information.
Studies of subtle atrophy based on volumetric T1-weighted imaging have shown that changes in white matter regions also contribute to diagnostic discrimination.Reference Davatzikos, Fan, Wu, Shen and Resnick41 For example, the classifier derived by Davatzikos et al.Reference Davatzikos, Fan, Wu, Shen and Resnick41 included clusters in inferior temporal and frontal white matter, as well as the grey matter regions shown in Figure 2. Diffusion tensor MRI is a recently established MRI technique that provides detailed information about the anatomy and structural integrity of white matter.Reference O'Sullivan, Jones, Summers, Morris, Williams and Markus51, Reference Johansen-Berg and Behrens52 In principle, an analogous approach could be taken to find patterns of change in white matter structure that discriminate between ageing and the onset of disease, which might also allow vascular factors, which are associated with loss of white matter tract structure, to be taken more explicitly into account.Reference O'Sullivan, Summers, Jones, Jarosz, Williams and Markus53
Conclusions
Analysis of MRI scans based on computational neuroanatomy has the potential to extract subtle but detailed information from everyday clinical MRI scans. The purpose of this review has been to make these approaches understandable and accessible to the clinician, as well as to point out some of their strengths and weaknesses. Early studies show that these techniques have considerable promise as an aid to diagnosis in the degenerative dementias. They also lend themselves well to large-scale collaborative studies and possibly even to web-based diagnostic applications. Methods that aid an accurate, early diagnosis of AD are likely to acquire great importance with the emergence of disease-modifying treatments.
Conflicts of interest
The author declares no conflicts of interest.
Acknowledgements
The author is supported by a fellowship from the Medical Research Council, UK.