New Zealand English contains a much documented chain-shift in its short front vowels. This chain-shift has been underway since the first generation of New Zealand English speakers, born in the mid 19th century. It involves the raising of

(trap) and

(dress) and the subsequent centralization of

(kit). (In this article, we use key words (Wells, 1982) to indicate both individual phonemes and the lexical sets to which they belong.) Gordon et al. (2004) provide some evidence that the fronting of the bath/start/palm vowel /a/ (referred to henceforth as start, even though NZE is non-rhotic) may have been the initial cause of the shift. However, they are tentative in this conclusion, given that start /a/ and the short front vowels are members of different subsystems, and so should not, theoretically, interact in a chain-shift. This article documents the continued raising of dress

for young New Zealanders, such that it now completely overlaps the space of fleece /i:/. We demonstrate that fleece /i:/, in turn, has become part of the on-going chain-shift by becoming increasingly diphthongal. We demonstrate that these two shifts (the raising of dress

and the diphthongizing of fleece /i:/) are causally linked, and show that the diphthongization is most advanced in tokens of fleece /i:/ which are followed by voiceless codas. These are the tokens of fleece /i:/ which are most endangered by the high dress

vowel, as they are then distinguished neither in acoustic space, nor by length.
BACKGROUND
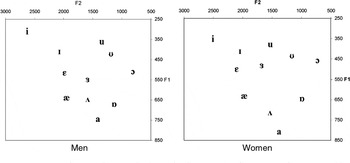
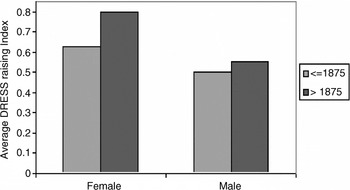
The chain shift raising of the New Zealand English (NZE) short front vowels kit, dress, and trap is well documented, both auditorily (Bauer, 1979, 1986; Bell, 1997; Maclagan, Gordon, & Lewis, 1999) and acoustically (Maclagan, 1982, 2000a; Watson, Maclagan, & Harrington, 2000). There has been debate as to whether the shift is a pull chain with kit leading (Maclagan, 2000a) or a push chain with trap in the lead (Bauer, 1979, 1992; Trudgill, Gordon, & Lewis,1998), but historical data has now clarified the situation (Gordon et al., 2004). It is now clear that the earliest immigrants to New Zealand brought relatively raised tokens of both trap (

and higher) and dress (

and higher) with them, but that both vowels continued to raise after the immigrants arrived in New Zealand. Auditory analysis of 115 speakers and acoustic analysis of ten speakers (Gordon et al., 2004) showed that trap started to raise before dress. From the auditory analysis, raised variants of trap were

and

and constituted 59% of the 5,076 tokens analyzed (see Gordon et al., 2004:105). Raised tokens of dress were

and

, and constituted 52% of the 5,709 tokens analyzed (Gordon et al., 2004:111). For speakers born during the 19th century, there is little evidence of the centralization of kit, which is a highly salient characteristic of modern NZE pronunciation. However, there was sufficient kit centralization, with 5% of the 5,990 tokens analyzed centralized to

or

(Gordon et al., 2004:117), to demonstrate that the front vowel movement is a push chain, not a pull chain. The vowel spaces of ten speakers born between 1865 and 1885 are shown in Figure 1, where the clear separation of fleece and dress can be seen for both men and women. At least 20 tokens of each vowel are included in this analysis, with the data taken from connected speech. The data is normalized. Figure 2 shows the degree of dress raising over time for 59 speakers born during the 19th century. The y-axis shows the average dress-raising index, where 0 =

, 1 =

, 2 =

and 3 = [e] or

. Higher values are related to greater degrees of raising. Women show a greater degree of dress raising than men and they show a greater degree of raising over this time period.

Mean formant frequencies in Hz for five men and five women from the Mobile Unit born between 1865 and 1885 (based on Gordon et al., 2004). At least 20 tokens of each vowel were analyzed for each speaker. All tokens were taken from stressed words in spontaneous speech. The data is normalized.

Degree of dress raising over time for 59 speakers born during the 19th century (Gordon et al., 2004:112). The y-axis shows the average dress-raising index, where 0 = , 1 = , 2 = and 3 = [e] or . 5709 tokens were included in the auditory analysis. All tokens were taken from stressed words in spontaneous speech.
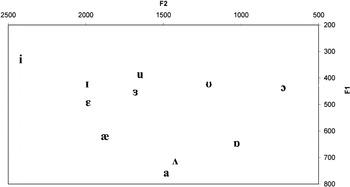
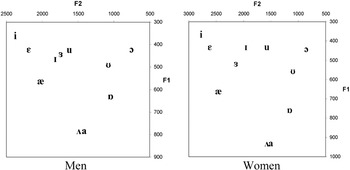
Speakers born around 1900 and later show increasing kit centralization (Langstrof, 2003, 2004a, 2006a) and confirm that the front vowels are indeed involved in a chain shift that is a push chain. Figure 3 (based on Langstrof, 2004a) shows the vowel spaces of four male speakers born between 1890 and 1900. At least 20 tokens were analyzed for each vowel, with the data taken from connected speech. The data is normalized. These speakers still keep fleece and dress well distinct in height and kit is not centralized. However, dress is closer to kit than in Figure 1, indicating that dress is encroaching on the acoustic space of kit, which is typical of a push chain shift. Figure 4 shows formant plots for 25 men and 25 women, aged about 20, who were born in the mid 20th century and recorded in 1979 (based on Maclagan, 1982). These speakers show more centralized kit and considerably higher dress vowels, so that fleece and dress are considerably closer together. The women's fleece and dress are closer together than the men's. In contrast to the other studies that analyzed spontaneous speech, Maclagan (1982) analyzed tokens in an /h_d/ frame in the carrier phrase Please say /h_d/ again. Because this data is read, it is likely to be more conservative than the data analyzed by Gordon et al. (2004) or Langstrof (2004a). Note that Figures 3 and 4 also show other changes that are typical of the development of NZE, but are not relevant to the current article.

Formant frequency plot in Hz for four New Zealand men born between 1890 and 1900 (based on Langstrof, 2004a). At least 20 tokens of each vowel were analyzed for each speaker. The data is normalized.

Formant frequency plots in Hz of Modern NZE speakers (25 men and 25 women) born in the 1950s, recorded in 1979 (from Maclagan, 1982). Tokens were placed in an /h_d/ frame in the carrier phrase Please say /h_d/ again. The data is not normalized.
Over the last five to ten years, it has become evident that dress is continuing to raise in NZE. Informal observations from academic visitors to the University of Canterbury indicate that the raised NZE dress vowel creates considerable confusion when they first arrive in New Zealand. Auditory analysis of speakers in the Canterbury Corpus (discussed later) confirmed that dress was continuing to raise. It also showed that this raising is not stigmatized, in that women from the higher social classes were leading in the change (Maclagan et al., 1999; see Labov, 1990 for a discussion of the relationship between social class and sound change). Some speakers in the Canterbury Corpus showed different behavior, and broke dress into a diphthong,

or

. When this diphthongization is added to the effects of the near/square merger (Gordon & Maclagan, 2001) in the non-rhotic NZE variety, bed, beard, and bared potentially all rhyme for these speakers (see Batterham, 1995 for further evidence of dress breaking before /d/). Diphthongization of dress is restricted to the older speakers in the Canterbury Corpus, with the younger speakers raising dress rather than breaking it (see Maclagan, 1998).
The first acoustic evidence of the continued raising of dress came from nine speakers, aged fourteen and recorded in 1983, whose dress vowels were higher than their fleece vowels (Maclagan, 2000b). However, because similar speakers born ten years later did not show the same trend, evidence from the 1983 speakers was regarded at the time as an aberration.
Speakers are aware of changes that affect the closing diphthongs, face, goat, price, and mouth, and women tend to avoid extreme realizations of these diphthongs (see Maclagan et al., 1999). People are similarly aware of the merging of the centering diphthongs, near and square, with deliberate plays on words such as hair dressing salons called Hair to Please, Hair 'N' Beyond, and Hair Today (see Maclagan & Gordon, 1996:126). However there is almost no indication that speakers are aware of the current raising of the dress vowel. The “complaint” tradition of letters to the editor of national papers is usually the first indication that sound changes are above the level of consciousness. So far, we have only found one such reference to the raising of dress in a letter to The Christchurch Press newspaper:
George Best or George “Beast”? The latter was the way it was pronounced by a Kiwi radio news reader on air recently. I wonder how the British public would react to their football icon being referred to in this way.1
Vimala Menon, letter to the editor, November 30, 2005.
By contrast, visitors to New Zealand informally report finding the fleece/dress contrast very difficult to understand, and New Zealanders make similar informal reports of being misunderstood overseas. One young New Zealander asked for “four tens” in a London bank, only to get the response “we don't have fourteens” (personal comment from Elizabeth Gordon, 2005).
This article presents an acoustic analysis of 80 speakers from the Canterbury Corpus and shows that these speakers have continued to raise dress so that it is as high as fleece. For some speakers, the dress and fleece vowel spaces totally overlap. We also present evidence that fleece is becoming increasingly diphthongal. Speaker groups for whom dress and fleece largely overlap in acoustic space have relatively pronounced on-glides for fleece.
DATA
Speakers
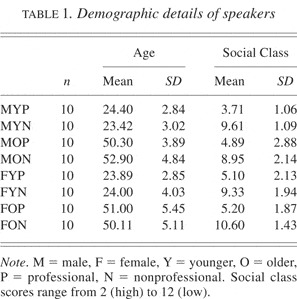
The data analyzed come from recordings in the Origins of New Zealand English Corpus (ONZE) held in the Linguistics Department at the University of Canterbury (see Gordon, Maclagan, & Hay, forthcoming for details). ONZE contains three different archives, each spanning a different section of the history of NZE. The Mobile Unit (MU) archive contains recordings of speakers born between 1851 and 1910, the Intermediate Archive (IA) contains recordings of speakers born between 1890 and 1930, and the Canterbury Corpus (CC) contains speakers born between 1930 and 1984. Because we are tracking changes in progress, we used data from the most recent of the archives, the CC. The CC contains material collected by students in the NZE course at the University of Canterbury (see Maclagan & Gordon, 1999). It is structured so that it contains approximately equal numbers of men and women, of younger speakers (aged 20–30) and older speakers (aged 45–60), and speakers from higher social classes (described as professional) and lower social classes (described as nonprofessional). Data collection started in 1994 and the corpus currently consists of 400 speakers. The speakers chosen for this analysis are a subset of 80 speakers, 10 from each cell. Table 1 gives the demographic information for the speakers. Social class is calculated by adding together an occupation measure (Elley & Irving, 1985) and an education measure. Each measure has a value of 1 (high) to 6 (low), and the combined measure ranges from 2 (high) to 12 (low). A two-point social scale obviously has considerably fewer divisions than those used by others (e.g., Labov, 1990, 2001; Trudgill, 1974). However, it is difficult to make such fine-grained distinctions within New Zealand society—New Zealanders do not readily acknowledge an overt class system. Using two groups allows for a crude but relatively robust division, which other studies have shown to have significant linguistic correlates (Batterham, 1993; Bell & Holmes, 1992; Maclagan et al., 1999, all of whom make two class distinctions, though they use different terminology to refer to what is most likely the same division).
Demographic details of speakers

Materials
Vowels from the NZE Word List were analyzed acoustically (see Maclagan & Gordon, 1999 for the full word list). Each speaker produced each line once, reading from a laminated card containing the entire word list. The focus of this analysis is the acoustic analysis of eleven tokens of dress and five tokens of fleece for each speaker:

Sociolinguists recognize that there are problems with using data from read material, as against data from casual speech. Many researchers prefer to use data from casual speech (e.g., Gregersen & Pedersen, 1991; Labov, 1972; Trudgill, 1974). Others use word lists and read material to facilitate exact comparisons between the pronunciations of different speakers in the samples (e.g., Di Paolo & Faber, 1990; Gordon & Maclagan, 1989, 1995; Habick, 1980). Milroy (1987:172–182) discussed the pros and cons of read material versus casual speech, and indicated that there are problems with both types of data. The CC contains both word list and read material. McKenzie (2005) compared results from word list and casual speech data for eight speakers and found that their dress/fleece realizations were closer together in the word list data than in casual speech. Since we are interested in the most extreme versions of the current shift, and because we wish to make exact comparisons between the speakers, we here focus on data from the word lists.
The speakers were recorded on Sony Walkman recorders (various models). The tokens were digitized on SndSampler™ (44100 Hz, 16 bit) and analyzed in Emu/R (http://emu.sourceforge.net). Formants were automatically generated and hand corrected. The data were hand-labeled and vowel targets were marked. The targets were taken during a steady state portion of the vowel, chosen to minimize the effects of the consonant environment. If there was no steady state, the target was taken at the maximum point of the second formant (F2) (i.e., the point at which the vowel was maximally “front”). This was also the minimum point of the first formant (F1) (i.e., of maximum height). For length measurements, consonant transitions were included within vowel measurements, so long as vowel formants could be seen.
RESULTS
F1/F2 space
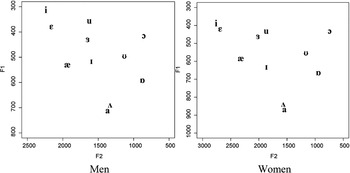
Figure 5 shows the overall vowel spaces for the men and the women whose dress and fleece vowels are the focus of this article. It can be seen that fleece and dress are now extremely close together, especially for the women.

Vowel spaces for all men and women included in this study. The data is not normalized.
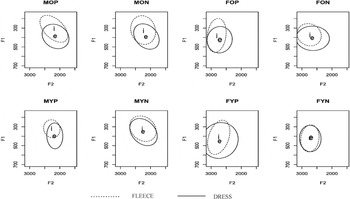
Figure 6 shows the results for fleece and dress only for each of the eight speaker groups. The ellipses enclose 95% of the tokens for each vowel. Dress is lower than fleece for the older speakers and for the younger, male, professional speakers. However, for the younger, male nonprofessional speakers and the younger female speakers, dress and fleece become closer, until for the younger, nonprofessional female speakers, dress and fleece are in fact in the same position, and their ellipses overlap totally. For these groups, then, these two vowels occupy the same acoustic space. We will turn next to an investigation of other factors that may help distinguish the vowels.

Ellipse plots for fleece and dress for all speaker groups. M = male, F = female, P = professional, N = nonprofessional, Y = younger, O = older.
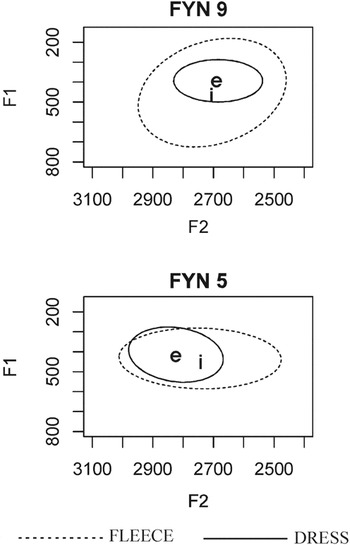
Taken as groups, none of the sets of speakers analyzed here show the results found in the younger speakers recorded in 1983, with dress higher than fleece (Maclagan, 2000b). However, some individual speakers in the younger, nonprofessional female group do pronounce dress higher than fleece. Figure 7 shows two speakers, FYN 5 and FYN 9, for both of whom dress is higher than fleece. For FYN 9, fleece is just front of dress, but for FYN 5, fleece is more central than dress, a pattern we have also seen in some more recently recorded speakers. It is possible that FYN 5 is showing the start of a movement whereby, as well as having a marked on-glide, fleece is becoming more central, and leaving dress as the highest front monophthong in the NZE vowel system.

F1/F2 vowel spaces for two speakers for whom dress is higher than fleece.
Diphthongization
The ellipses in Figure 7 show that for innovative speakers, fleece and dress occupy similar acoustic space. However, they only show measurements at a single point in the vowel. This raises the question of the degree to which other factors may be helping to keep the two vowels distinct. One likely candidate for this is diphthongization. Many varieties of English have a high degree of diphthongization in their fleece vowel. NZE certainly does have some fleece diphthonging, but this has historically been much less extreme than many other varieties. For example, Turner (1966), Wells (1982), and Bayard (1995) all commented that NZE fleece has a much less pronounced on-glide than its Australian counterpart. However, Bayard (1995) observed that the degree of diphthongization is increasing, and in a more recent study, Watson, Harrington, and Evans (1998) found no significant difference in degree of diphthongization between NZ and Australian fleece.
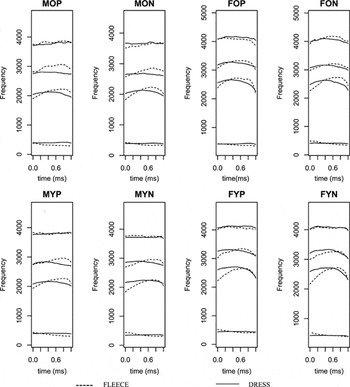
Figure 8 presents time-normalized formant tracks for fleece and dress for each speaker group. Compared with dress, fleece has a clear on-glide for all speaker groups and reaches its target frequency later. The older male and female professional groups have less pronounced on-glides than the other groups. Note that these groups are also particularly conservative in acoustic space (Figure 6). The younger male nonprofessional speakers and both groups of younger female speakers, whose dress and fleece vowel spaces largely overlap, all show relatively pronounced on-glides for fleece. This diphthongization will help to differentiate the two vowels and seems to be an indication that fleece is responding to dress's encroachment on its space by becoming more diphthongal.

Time-normalized formant tracks for fleece and dress for each speaker group.
Overall summary of dress height and fleece diphthongization
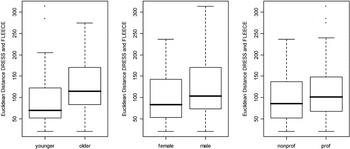
Inspection of the ellipses (Figure 6) and trajectories (Figure 8) certainly gives the impression that dress and fleece are becoming closer over time, and that fleece is diphthongizing in response. In this section we present some simple statistics that reinforce this analysis. In order to more formally compare the degree of separation between dress and fleece for individual speakers, we calculated the Euclidean distance between their average dress and their average fleece formant values. Because this compares the relative closeness of the two vowels, it enables us to directly compare values across speakers without the need for normalization. The Euclidean distance will be zero for speakers who have dress and fleece right on top of one another, and will be large for speakers who have a good separation between the two vowels. Figure 9 shows box plots comparing younger and older speakers (left panel), female and male speakers (middle panel), and nonprofessional and professional speakers (right panel). Younger speakers have significantly smaller distances between dress and fleece than older speakers (Wilcoxon, p < .005). Females have significantly less separation than male speakers (p < .05). Nonprofessionals have slightly less separation than professional speakers, but this does not reach significance (p = .26). Thus the impression (from Figure 6) of closer dress and fleece vowels for females and younger speakers is significantly robust.

Box plots showing the Euclidean distance between fleece and dress for younger and older speakers (left panel), female and male speakers (middle panel), and nonprofessional and professional speakers (right panel).
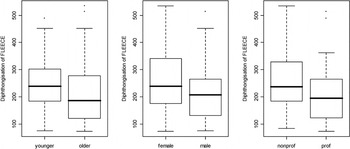
To assess the degree of fleece diphthongization, we took a similar approach. From the hand-corrected trajectories generated by the Emu analysis system (http://emu.sourceforge.net), we automatically extracted the formant values at a point that was 0.25 of the way through the vowel. This was done to provide a point that was near the beginning of the vowel, while still far enough through to avoid the effects of consonant transitions. Because many of the words in the word list begin with /b/, it is particularly important to avoid the transitions, so that any increase in diphthongization is not inappropriately exaggerated. For each vowel, we then calculated the Euclidean distance between this fleece “onset” and the fleece target. As indicated earlier, targets were taken during the steady state portion of the vowel. This value would be zero for vowels that are entirely monophthongal, and it would be high for highly diphthongal tokens. These values were averaged for each speaker, to provide a value that (albeit crudely) estimated that speaker's degree of fleece diphthongization. Figure 10 shows the degree of diphthongization by age (left panel), gender (middle panel), and social class (right panel). Neither the age nor the gender comparison reaches significance. The trends indicate that younger speakers in this corpus show more diphthongization than older speakers (Wilcoxon, p < .1), and that female speakers show more than male speakers (p < .2). There is, however, a significant overall effect of social class, with nonprofessionals showing more diphthongization than professionals (p < .05). The trends for diphthongization certainly line up with those for the distance between dress and fleece, although they are not so statistically robust. This is likely to be because these figures combine dress tokens before both voiced and voiceless consonants—a distinction that is important, as discussed later. For convenience, tokens before voiceless consonants are referred to as voiceless dress/fleece and those before voiced consonants are referred to as voiced dress/fleece.

Box plots showing the degree of diphthongization for fleece for younger and older speakers (left panel), female and male speakers (middle panel), and nonprofessional and professional speakers (right panel). Diphthongization was assessed by measuring Euclidean distance between the “onset” (0.25 from the start of the vowel to avoid consonant transitions) and the vowel target.
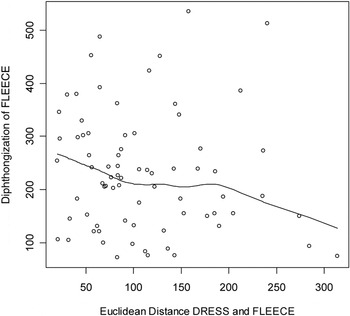
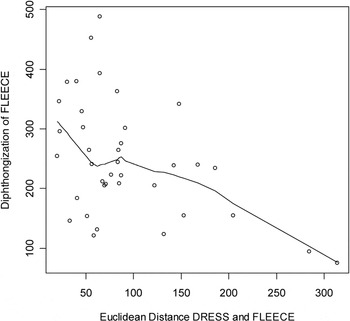
In order to more directly assess the potential causal relationship between dress/fleece overlap and fleece diphthongization, we investigated the degree to which they correlate with one another across individual speakers. Are those speakers who are most innovative in terms of dress/fleece overlap also the speakers who produce the most diphthongal realizations of fleece? Figure 11 plots dress/fleece Euclidean distance against average fleece diphthongization. Each point represents a single speaker, and the line is a nonparametric scatter plot smoother fit through the data. The trend is that individuals with closer dress and fleece are more likely to produce more diphthongal fleece tokens. A correlation does not reach significance, although it does when restricted just to the younger speakers (Spearman's rho = −.38, p < .02). These data are shown in Figure 12. Notable here is the empty triangle in the top right, which indicates that there are no younger speakers in our corpus who have both a large separation between dress and fleece and a highly diphthongal fleece vowel.

Plot of dress/fleece Euclidean distance against average fleece diphthongization. Each point represents a single speaker, and the line is a nonparametric scatter plot smoother fit through the data.

Plot of dress/fleece Euclidean distance against average fleece diphthongization for younger speakers only. Each point represents a single speaker, and the line is a nonparametric scatter plot smoother fit through the data (Spearman's correlation, rho = −0.38, p < .02).
Length
In addition to the increasing diphthongization of fleece, it is worth investigating whether the raising of the dress vowel is having any effect on vowel length. Investigating this proved relatively difficult because of the different speech rates of the different participants. Our male participants, for example, have markedly shorter durations for both fleece and dress—which may well be an effect of speech style, rather than a reflection of different stages in the vowel shift. Comparing the raw duration measurements across individuals, then, is likely to be relatively unrevealing.
Instead, we measured the length of a third “benchmark” vowel—strut. This is a vowel that is relatively stable in F1/F2 space in New Zealand English, and so we guessed that any differences in length across participants would be likely as a result of stylistic differences, rather than intrinsic differences in the realization of the vowel. Measurements were taken from productions of the following words from the NZE word list: but, bud, buck, bug, and bun.
Wilcoxon tests reveal that the duration of strut is not significantly different by age or social class. There is a significant difference by gender. As with both fleece and dress, males tend to produce shorter vowels (Wilcoxon test, p < .03). This reinforces the interpretation that there is a speech style difference between the male and female participants. To establish whether there are any developments within our corpus in the duration of dress and fleece, we therefore considered the duration of each of these vowels relative to the duration of strut. We hoped that this would eliminate the otherwise strong effect of individual speech rate on vowel duration.
For the older speakers, there is no significant length difference between strut and voiceless dress (as indicated earlier, voiceless dress/fleece refers to dress/fleece tokens before voiceless coda consonants), but for younger speakers strut is longer than voiceless dress (p < .05). Because we have no reason to believe that strut is changing, this suggests that voiceless dress may be shortening as it raises.
Voiced dress is significantly longer than strut for all speakers. But, the length difference between voiced dress and strut is significantly greater for older speakers than younger speakers (median difference = 66 ms vs. 47 ms, p < .04). This indicates that voiced dress also shortens as it raises. Older speakers do not have a significantly different strut/voiceless dress length ratio than younger speakers, but the strut/voiced dress length ratio is significant (p < .03).
In terms of fleece, the strut/voiceless fleece length ratio is not significantly different across the ages (mean younger strut/voiceless fleece ratio = .99, older = .99). However, the strut/voiced fleece ratio is significantly different—younger people have significantly shorter voiced fleece (p < .01) (younger: mean voiced fleece duration: 254 ms, mean strut/voiced fleece ratio: .52; older: mean voiced fleece duration: 280 ms, mean strut/voiced fleece ratio: .48).
In English, vowels that are high are usually shorter than more open vowels (Peterson & Lehiste, 1960:701–702; Wells, 1962). In this sense, the shortening of dress as it rises is not surprising. However, Watson et al. (2000) noted that as kit and dress rose for the four speakers they studied, they did not actually decrease in length. Although we do see some evidence of dress shortening, this shortening is perhaps not as dramatic as one might predict.
In particular, the fact that dress is, overall, shortening as it raises, might lead one to suspect that this shortening facilitates the maintenance of contrast between dress and fleece. However, inspection of individuals' systems reveals that this is not, in fact, always the case. While only two of our participants have voiced dress longer than voiced fleece, surprisingly, 23 of them actually have their voiceless dress vowels longer than their voiceless fleece vowels. It is also worth noting that voiced dress is significantly longer than voiceless fleece (p < .0001)—there are only three speakers for whom voiceless fleece is actually longer.
The distinctiveness of voiceless fleece, then, is not well protected by its length. Nearly all speakers have voiced dress longer than voiceless fleece, and for a nontrivial number of speakers, voiceless dress is also longer. Importantly, those speakers with voiceless dress longer than voiceless fleece also have significantly more diphthongization in their voiceless fleece than those for whom voiceless fleece is longer (p < .02).
This suggests that we may need to take length into consideration in our analysis of the diphthongization of fleece, and—importantly—we need to consider voiced and voiceless variants separately.
Voiced and voiceless phonemes
Fleece seems to be reacting to the encroachment of dress on its space by becoming more diphthongal. Because there is a length difference between vowels before voiced and voiceless coda consonants (see, e.g., Luce & Charles-Luce, 1985), the raising of dress would seem to place more pressure on fleece before voiceless consonants (voiceless fleece) than fleece before voiced consonants (voiced fleece). To compare the effects of voicing, we restricted our data set to the words that were /b/- or /h/-initial, with a following coronal plosive. This provided us with a set of directly comparable fleece and dress vowels in voiced and voiceless contexts, bead, beat, bed, bet, etc.
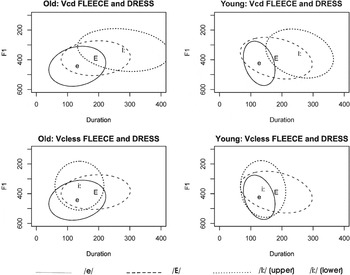
Ellipses for these tokens are shown in Figure 13, which plots duration × F1 for the older (left panel) and younger (right) speakers. We use capital letters to indicate vowels before voiced coda consonants and lower case letters to indicate vowels before voiceless coda consonants. The top panel shows how voiced (E) and voiceless (e) dress are positioned relative to voiced fleece (I:). The bottom panel shows how voiced (E) and voiceless (e) dress are positioned relative to voiceless fleece (i:). Several things are apparent from these plots. First, as shown on the y-axes, voiced dress is considerably more raised than voiceless dress for all groups of speakers (paired Wilcoxon comparing F1 for voiced and voiceless dress over all speakers: p < .0001). Second, as shown on the x-axes, voiced dress is quite long—and is reliably longer than voiceless fleece (p < .0001). Third, and most striking, it is voiceless fleece that is under most pressure from the rising dress, particularly for the younger speakers (see the increased overlap in the ellipses in the bottom right graph in Figure 13). And it is under most pressure from voiced dress, which is almost as high as it, and actually slightly longer than it. While voiced dress is also almost as high as voiced fleece, voiced fleece is somewhat protected by its length (see the top panel of Figure 13).

Duration (in ms) and F1 (in Hz) for the older (left panel) and younger (right panel) speakers. The top panel shows the position of dress before voiced (E) and voiceless (e) coda consonants relative to fleece before voiced coda consonants (I:). The bottom panel shows the position of dress before voiced (E) and voiceless (e) coda consonants relative to fleece before voiceless coda consonants (i:).
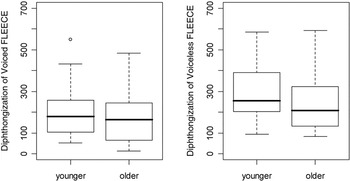
If the diphthongization of fleece is causally related to the height of dress, we would predict that the diphthongization should be most advanced in the voiceless tokens. Figure 14 shows box plots of the degree of diphthongization of voiced (left panel) and voiceless (right panel) tokens, for both older and younger speakers. It shows that there is more diphthongization in the voiceless tokens than the voiced tokens, and that the voiceless tokens are increasing in diphthongization more rapidly than the voiced ones. Voiceless tokens are significantly more diphthongal—this holds over the entire data set (paired Wilcoxon, p < .00001), and within the younger (p < .001) and the older (p < .005) speakers. For the voiceless tokens, younger speakers show significantly more diphthongization than the older speakers (p < .05), however, this difference does not hold for the voiced tokens (p < .4).

Box plots showing the age difference in the diphthongization of voiced fleece (left panel) and voiceless fleece (right panel).
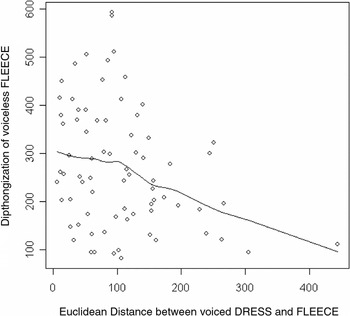
Figure 15 demonstrates the relationship between the height of voiced dress (as assessed by the Euclidean distance between voiced dress and fleece), and the diphthongization of voiceless fleece. It reveals a significant connection (Spearman's rho = −.29, p < .02) such that the smaller the Euclidean distance between the two vowels, the greater the diphthongization of voiceless fleece.

The Euclidean Distance between voiced dress and fleece, and the diphthongization of voiceless fleece (Spearman's correlation, rho = −.29, p < .02). Each point represents a speaker. The line shows a nonparametric scatter plot smoother fit through the data.
DISCUSSION
Our results indicate that the New Zealand dress vowel has continued to raise, leading to extreme overlap in the acoustic space of fleece. It appears that fleece has begun to react to this intrusion by the development of a more pronounced on-glide, which helps to differentiate the two vowels. Perhaps paradoxically, then, the long vowel fleece is now being affected by the New Zealand “short front vowel” shift.
The fact that fleece is reacting to the high dress vowel (certainly by further diphthonging, and perhaps by centralization) appears, at first glance, curious. Fleece is a long vowel, and so belongs to a different subsystem than the short vowels, and should theoretically not be affected by their movement. The fact that it is affected could be taken as evidence in support of Labov's (1994:285) claim that the New Zealand short front vowels are in fact tense, and thus in the same subsystem as fleece. The NZE short front vowels would then not provide a counter-example to the generalization that short vowels fall in chain-shifts.
We have previously tentatively suggested (Gordon et al., 2004:205–206) that start fronting might have precipitated the NZ short front vowel chain shift, even though the long vowel system is conventionally regarded as separate from the short vowel system (see, e.g., Lass, 1976). This seemed to be what the ONZE data suggested, but we were reluctant to claim it strongly, as it would be very unusual for a long vowel to enter into a push-chain relationship with a short vowel.
There was no suggestion in the Mobile Unit or the Intermediate Archive data that the movement of trap, dress, and kit impacted on fleece in any way. The behavior of fleece in the present data indicates that a long vowel is affected by movements of the short vowels, and adds weight to the earlier tentative suggestion that start might also be involved in the NZE “short vowel” chain shift.
If the long vowel start was initially involved in the short vowel chain shift, and the long vowel fleece is currently involved in the same shift, one interpretation may be that all of the “front short vowels” are tensed in New Zealand English. While this could perhaps be argued for dress and trap, it would be much more difficult for kit (c.f. Langstrof's (2006b) measurements showing that this vowel is much shorter than both dress and trap in speakers born between 1900 and 1930). A more plausible explanation would seem to be that the traditional distinction between longer and shorter, tense and lax vowels has broken down in the NZE vowel system, at least for the front vowels. The front vowels simply form a single system. A similar argument has recently been put forward by Langstrof (2004b; 2006b).
This speculation raises the question as to whether length is still important in NZE for any phoneme pairs. NZE does not have the traditional British/American English long short vowel pairs of fleece/kit, goose/foot, thought/lot (Maclagan, 1982, Easton & Bauer, 2000), but it does have length contrasts in start/strut (bard/bud, cart/cut). Maclagan (1982) indicated that fleece/dress similarly formed a long short pair, so that in NZE, fleece/dress took the place of the British English Received Pronunciation (RP) fleece/kit pair. For all but three of the speakers analyzed here, dress with a voiced coda (head) is actually longer than fleece with a voiceless coda (heat) indicating that length difference between fleece and dress is no longer simple. Dress has already been implicated in the near/square merger (Gordon & Maclagan, 1989:218). For some time in NZE, the first element of near has been associated with the long vowel fleece rather than the short vowel kit because of the centralization of kit (see Langstrof 2006b). At the same time, square was associated with dress, so that one centering diphthong was associated with a short vowel and one with a long vowel, indicating a degree of fluidity in the long and short vowel systems in NZE. Because fleece and dress are now so close together, it is difficult to see which monophthong near and square are now related to (Gordon & Maclagan, 2001).
We would suggest that, for NZE, it is no longer useful to consider formant structure and length as independent elements for the front vowels. To understand what is happening in the front vowels, we need to consider the effects of formant structure and length together.
With the centralization of kit for most current NZE speakers (and for all the speakers included in this study, see Figure 1) dress now remains as the highest of the traditional short vowels. If fleece centralizes, NZE will be left with dress as the highest front vowel in the entire vowel system. If this were to happen, it would further suggest that the traditional distinction between longer and shorter, tense and lax vowels has broken down in the NZE vowel system, at least among the front vowels.
While it is, on the surface, surprising that fleece should react to dress, the fact that its reaction should be diphthongization is not surprising. Labov indicated two possible outcomes as front vowels rise in a chain shift. Vowels can leave the front peripheral series via the mid-exit principle or the upper exit principle (1994:602). Both principles involve diphthongization: via the mid-exit principle, whereby tense mid-close long vowels develop in-glides, and via the upper exit principle, whereby long high monophthongs develop either in-glides or up-glides. In both cases, the vowels leave the system of monophthongs and become diphthongs. At one stage, NZE dress developed an in-glide for some speakers (Maclagan, 1998) and seemed set to leave the monophthong system via the mid-exit principle, even though it is traditionally regarded as a short vowel not a long vowel. However, this option did not continue over time, and dress now continues to raise as a monophthong.
To use Labov's terminology, fleece is becoming an increasingly up-gliding diphthong. Like other Southern Hemisphere varieties of English, NZE has what Wells (1982:256) called diphthong shifting in the face, price, choice, mouth, and goat diphthongs, and to a lesser extent in fleece and goose (see Gordon et al., 2004:148 ff). This on-glide in fleece was present before fleece was under any pressure from dress and has been reported as auditorily less pronounced than the on-glide for Australian English fleece (Turner, 1966:96; Wells, 1982). Figure 8 shows that NZE fleece does have a visible on-glide for all speaker groups, and that this appears to be becoming more pronounced. It therefore appears to be affected by the New Zealand “short front vowel” shift, and to be behaving in a manner consistent with the upper exit principle. The on-glide produced by diphthong shifting undoubtedly facilitated the greater diphthongization that is now clearly visible and audible in NZE fleece.
There are some more general lessons that can be taken from our results in the context of the study of chain-shifts. M. J. Gordon (2002) summarized the chain-shifting literature very nicely—documenting many cases in which a phoneme encroaches into the phonological space of another, and the second phoneme changes in a way that maintains contrast. A perusal of this literature provides an array of F1/F2 plots, and extensive discussion about what happens when one vowel moves into the acoustic space of another. It is very focused on what happens when the distinctiveness of a vowel is threatened in F1/F2 space.What the results in this article very clearly show is that there are more than two dimensions involved in the maintenance of contrast.
Overlap in F1/F2 space appears to be more tolerated when length is able to mark a distinction. In languages and dialects in which length clearly distinguishes between two vowel subsystems, the effect of this is that vowels operate in different subsystems, which can overlap in acoustic space (see, e.g., Labov, 1994). The robust length difference is sufficient for the maintenance of contrast, and so the “long” and the “short” vowels do not interfere with one another. Interestingly, recent work by Labov and Baranowski (forthcoming) showed that, even within the “same subsystem,” a very short length difference (50 ms) seems to be sufficient for the maintenance of a vowel contrast in the Northern Cities Shift.
However, in New Zealand English, length is not sufficient to distinguish fleece (and, particularly voiceless fleece) from dress. It is threatened in F1/F2 space, and also threatened in the length dimension. It seems reasonable to assume that vowels most likely to react in a chain-shift are those that are threatened in all three dimensions. Thus, voiceless fleece diphthongizes most vigorously, because all three dimensions are under pressure. Note that we do not mean to imply that these are the only dimensions that are relevant. The dynamic properties of the vowels, for example, could presumably also play a role in maintaining distinctions. Indeed, they are crucially involved in our case, as it is the dynamic properties that change in order to preserve a distinction. One point, then, to take away from these results, is that a focus on F1/F2 space alone may not provide a complete picture of what is driving a chain-shift.
In addition, length is not necessarily stable in a chain-shifting scenario. In future work we should consider whether length might, itself, be the feature that adjusts in order to maintain contrast. In our own data, we do see a length change, but not one which, on the surface, is particularly helpful for the purposes of contrast maintenance. Voiced fleece appears to be shortening. We should note, however, that all of our speakers still produce a voiced fleece that is longer than their voiceless fleece. We can speculate that perhaps for the younger speakers, length is becoming less reliable as a cue. They cannot, after all, rely on length alone as a cue to voicing for fleece. Relying on length alone would lead to voiced dress being misheard as voiceless fleece. The contrast in diphthongization, then, must surely be playing a perceptual role in demarcating the identity of voiceless fleece. And, as voiceless fleece is, at this stage, more diphthongal than voiced fleece, perhaps this cue is taking on some of the allophonic work that length is performing for our older speakers.
Note that voiceless fleece is relatively stable in terms of length. One strategy for avoiding dress might theoretically be to lengthen, but there is no space available to lengthen into—that space is occupied by voiced fleece. Although it is not traditional to assume that one of the important “contrasts” to be maintained through chain-shifting is the contrast between two allophones of a single phoneme, that does seem to be what is happening here. This should, in fact, be unsurprising, as the length difference for the different allophones has been shown to be a primary cue to voicing in speech perception for English (see, e.g., Jones, 1950; Raphael, 1971; Klatt, 1976). Voiceless fleece diphthongizes, then, because this is all that it can do.
One final point of note is the fact that contrast maintenance is operating at a subphonemic level here. The primary driver of our effect is the reaction of fleece before voiceless consonants diphthongizing to avoid overlap with dress before voiced consonants. This subtle relationship between allophones of adjacent phonemes suggests that the drive for contrast maintenance occurs at a less abstract level than the phoneme.
CONCLUSIONS
This article has presented an acoustic analysis of the dress and fleece vowels of 80 New Zealanders. The results show that dress continues to raise in contemporary New Zealand English. Dress and fleece now completely overlap in acoustic space for many young speakers, and for some innovative individuals dress has risen above fleece and can be more front than fleece. We argue that changes in the trajectory of fleece have arisen as a consequence, making fleece a part of the New Zealand “short front vowel” shift. The diphthongization of fleece is most advanced in tokens that are followed by voiceless codas. These are the tokens that are most endangered by the high dress, as they are then distinguished neither in acoustic space, nor by length. That dress and fleece should be linked in a chain-shift suggests that the short/long distinction in New Zealand English may have broken down, at least for the front vowels. It also points to considerations that should perhaps be given attention in the study of other chain-shifts, such as the relationship between formant structure and length, the degree to which distinct allophones of a single phoneme are retained, and the degree to which contrast between adjacent phonemes may be threatened at the subphonemic (allophonic) level.