NOMENCLATURE
- ACARE
Advisory Council for Aviation Research and Innovation in Europe
- APU
Auxiliary Power Unit
- ASK
Available Seat Kilometres
- ATC
Air Traffic Controller
- LEBL
Barcelona–El Prat Airport
- CODA
Central Office for Delay Analysis
- DMC
Direct Maintenance Cost
- DOC
Direct Operating Cost
- EASA
European Aviation Safety Agency
- ECDT
Engine Cool Down Time
- ECS
Environmental Control System
- EGT
Exhaust Gas Temperature
- EGTS
Electric Green Taxiing System
- EI
Emission Index
- ESNZ
Åre Östersund Airport
- ESUT
Engine Start Up Time
- EU ETS
European Union Emission Trading System
- FAA
Federal Aviation Administration
- FCOM
Flight Crew Operating Manual
- FF
Fuel Flow
- FH
Flight Hours
- FOD
Foreign Object Damage
- HC
Hydrocarbon
- IATA
International Air Transport Association
- ICAO
International Civil Aviation Organization
- LFBZ
Biarritz Pays Basque Airport
- LFPG
Charles De Gaulle Airport
- EGKK
London Gatwick Airport
- LLBG
Ben Gurion Airport
- LLP
Life Limited Parts
- LTO
Landing and Take-Off
- MRO
Maintenance, Repair and Overhaul
- MLW
Maximum Landing Weight
- MTBPR
Mean Time Between Parts Replacement
- MTOW
Maximum Take-off Weight
- NASA
National Aeronautics and Space Administration
- OTP
On-time Performance
- PR
Power Restoration
- R
Ideal Gas Constant
- SET
Single engine taxi
- SLST
Sea-level Static Thrust
- T
Temperature
- TET
Twin engine taxi
- TIT
Taxi-in time
- TOT
Taxi-out time
- TXI
Taxi-in
- TXO
Taxi-out
- UTS
Ultimate Tensile Stress
- V
Volume
- Do
Outside Diameter
- EAPU
APU emission
- Edual
Dual engine emission
- EIAPU
APU emission index
- EIENG
Engine emission index
- Esingle
Single engine emission
- FAPU
APU fuel consumption
- Fdual
Dual engine taxiing fuel consumption
- FFAPU
APU fuel flow
- FFENG
Engine fuel flow
- Fsingle
Single engine taxiing fuel consumption
- nEnd
Number of engines
- Rlabour
Labour rate
- te−taxi
E-taxi time
- ttaxi
Taxiing time
- ρjetA1
Density of jet fuel
- p
Pressure
- t
Wall Thickness
1.0 INTRODUCTION
Modern aircraft face the challenge of reducing fuel consumption and emissions in an economically viable way. Much of the attention is focused on in-flight release of CO2. However, there is renewed importance placed on local emission of CO2 and NO x and the ACARE FlightPath 2050 Goals for emissions reduction targets aim for zero-emission taxi. An e-taxi system is based on the idea of introducing alternative power sources to achieve ground manoeuvring without the need to run the main engines. The alternative power sources can either be an external aircraft tractor or an on-board electric motor. Generally, 6% of airline total fuel budget is consumed when aircraft are operating on the ground, and an even higher proportion is consumed at congested airports( 1 ). Previous research findings indicate that based on the crude oil price of US$100 per barrel, the introduction of electric taxiing to 50% of the current narrow body airliners would contribute about 2.8% reduction in life cycle CO2 emissions per aircraft( Reference Schäfer, Evans, Reynolds and Dray 2 ).
The idea of using a hydrogen fuel cell to power the electrical taxiing system is proposed. The concept intends to integrate the entire hydrogen fuel cell system (including fuel cell, hydrogen tank, controllers, and waste management associations) inside a standard LD3-45W or LD3-46 air cargo container. In this way, it can be located in the lower cargo hold, forming an independent power supply module which can only be activated during ground operation and is isolated during in-flight phases. With provision for electrical motors integrated on both main landing gear units, the aircraft’s main engines can remain off until after taxi out and only a few minutes prior to take-off. About 50,000 tonnes of jet fuel and associated CO2 emissions reduction per year have been initially estimated for a typical large European low-cost carrier. The entire project aims to study this idea in detail and attempt to assess the feasibility of applying this system on a conventional short-haul airliner.
2.0 AIRCRAFT PERFORMANCE PREDICTION METHODS
2.1 Taxiing fuel consumption and emission
For conventional taxiing, the taxiing phase fuel consumption and emissions for dual-engine taxiing can be estimated by the following equations:
 $$F_{{\rm dual}} {\equals}t_{{\rm taxi}} {\times}n_{{\rm Eng}} {\times}{\rm FF_{{Eng}}} $$
 $$E_{{\rm dual}} {\equals}F_{{\rm dual}} {\times}{\rm EI_{{\rm Eng}}} $$
For APU powered electric taxiing system, the only fuel consumptions during taxiing are contributed by the APU at high load condition. With the proposed fuel cell system, the APU is only required to operate at ECS mode providing cabin air-conditioning( Reference Swedish 3 ). Therefore, the following equations can be applied to estimate the fuel burn and emissions based on APU operating time, fuel flow, and the emission indices of the specific APU
 $$F_{{\rm APU}} {\equals}t_{{\rm e{\minus}taxi}} {\times}{\rm FF_{{APU}}} $$
 $$E_{{\rm APU}} {\equals}F_{{\rm APU}} {\times}{\rm EI_{{APU}}} $$
2.2 Additional en-route fuel consumption
The application of new on-board systems creates additional fuel consumption associated with carrying the extra weight. The electric taxiing system weight varies from 136 kg (WheelTug) to 300 kg (EGTS), and this additional weight may be for compensated by less fuel carried for the taxiing phase( Reference Carey 4 , Reference Cox 5 ). However, strict limitations for carrying taxiing fuel on e-taxiing aircraft may still be imposed by aviation authorities considering the reasons of safety( Reference Hospodka 6 ). According to the analysis of A320 fuel performance, the additional fuel burn for carrying every 100 kg of weight varies between 3 kg and 9 kg with related sector length from 1.5 h to 3 h ( 7 ). Conservatively, the value of 3 kg/100 kg/h has been derived and used for the estimation of additional en-route fuel consumption. For the aircraft using electric taxiing system, the amount of taxi-in fuel in each sector is no longer needed, which could partially counteract the additional en-route fuel consumption caused by extra system weight. However, this is ignored in this paper considering the safety reasons imposed by aviation authorities, which lead to a conservative fuel reduction result in the end.
2.3 Engine maintenance cost
Engine maintenance cost can be divided into three aspects which are engine performance reset cost, LLP replacement cost and FOD cost( Reference Ackert 8 ).
The performance reset cost is defined as the cost to restore the engine performance from deteriorating by the effect of heat, fatigue and corrosion during the routine operation in each flight cycle.
The components that are required to be replaced after a certain number of flight cycles is known as LLP which contributes about 20–30% of total engine maintenance cost( Reference Ackert 9 ).
Finally, engine FOD cost covers the maintenance cost related to the damage from the foreign object. The main engines are not the only components threaten by FOD. Same damage also increases the maintenance cost of tyre and airframe. The introducing of electric taxiing system can significantly reduce the ground phase FOD cost.
3.0 DATUM CLIENT BUSINESS ANALYSIS
To quantify the performance impact brought by the e-taxi system, a Europe-based, low-cost, large-scale A320 family operator has been selected as the datum client, and this section presents the business performance of this company in 2016 which is used in the further cost and benefit analysis in Section 6.
3.1 Taxi-in and taxi-out time analysis
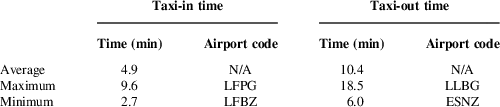
This section covers the analysed TIT and TOT data for the datum operator’s destination airports based on the original worldwide airports taxiing time data published by CODA( 10 ). Table 1 presents the analysed taxiing time for datum operator’s 129 destination airports in Europe.
Summarised 2015 taxiing time of datum operator’s destinations

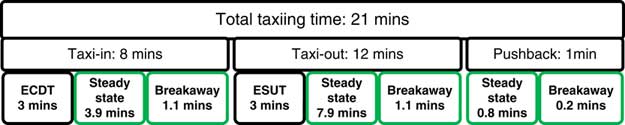
The average total taxiing time for the datum operator is 15.3 min. To target the best hydrogen storage efficiency in a spherical tank carried in Section 4.4, 8 min for taxi-in and 13 min for taxi-out in each flight are set as the system designed maximum operating time which covers 96.9% and 88.4% of all destination airports.
The time of pushback when using EGTS is set at 1 min which is included in the taxi-out time( 1 ). An additional 3 min are considered for both ECDT and ESUT which conservatively meet the requirements of A320 FCOM (Flight Crew Operating Manual)( 11 ). The detailed taxiing time allocation result is presented in Fig. 1.
Taxiing time allocation.

Refer to the average 15.3 min taxiing time, by subtracting ECDT (3 min) and ESUT (3 min), the average electric taxiing time can be calculated as 9.3 min which is used as input in the benefit calculations.
3.2 Fleet scale in 2016
As of 9 January 2017, the datum operator had 235 aircraft in operation including 133 A319s (equipped with CFM56-5B5/3 engines) and 102 A320s (equipped with CFM56-5B4-3 engines)( 12 ). Together with three different cabin configurations, the entire fleet offers 39,174 available seats. Between 2016 and 2021, this operator intends to update their fleet from a majority of A319s (156 economy class seats) to a fleet that includes over 70% of A320s (186 economy class seats)( 13 ). Therefore, the A320 is selected as the datum aircraft in this project considering the fleet composition and to ensure that the system has the capability to power the largest aircraft for the selected operator.
3.3 Aircraft utilisation analysis and flight assignment
 $${\rm Fleet\,utilisation_{{Jan}} {\equals}{{Number\,of\,flight_{{Jan}} } \over {Number\,of\,days_{{Jan}} {\times}Number\,of\,aircraft_{{Jan}} }}}$$
Referring to Equation (5), the fleet utilisation can be calculated based on the number of flights (excluding cancelled flights), the total number of aircraft, and the number of days in each month. Therefore, with 490,754 valid flights in 2016, each aircraft in the datum operator’s fleet flies at least 5.91 sectors everyday on average( 14 ). However, in the actual operation, it is unlikely to have all aircraft in service constantly. Therefore, the actual aircraft utilisation would be higher than 5.91 flights/day/aircraft which would potentially increase the system benefit so that, conservatively, the aircraft utilisation of 6 flights/day/aircraft is applied in the further analysis in this project.
3.4 Average sector length
The average sector length of datum operator in 2016 is 1,098 km, which is approximately equivalent to the distance from London Gatwick to Barcelona( 15 ). According to the recorded data of flight EZ8517 (EGKK-LEBL), the average flight time is about 1.5 h and this has been used as the average sector length in this paper( 16 ).
4.0 SYSTEM DESIGN
4.1 System power requirement and sizing
As the speed is relatively low during the taxiing phase, most power is used to overcome the rolling friction which is defined as the friction force opposing the motion of a freely rolling tyre. The rolling friction coefficient is increased due to the tyre hysteresis and increasing speed, but it is common to use a constant value in ground performance calculations( 17 ). A recommended tyre rolling friction coefficient between 0.008 and 0.02 is also widely used in ground performance analysis( Reference Currey 18 ). The upper value of rolling friction coefficient has been considered to provide conservative approach.
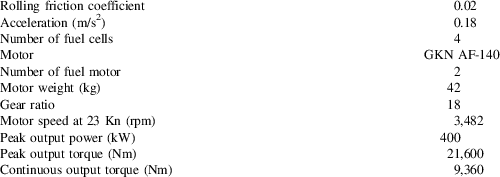
The target top speed of current available and in development electrical taxiing system varies largely from 10 Kn (WheelTug) to approximately 20 Kn (EGTS). The official recommended maximum taxiing speed for A320 family aircraft is 30 Kn in straight and 10 Kn at 90° turn( Reference Parks 19 ). Therefore, the target maximum taxiing speed of this system is set at 23 Kn which is close to the current aircraft taxiing speed and same as the designed operating speed of TaxiBot( 20 ). According to the standard safety procedures, the maximum speed for towing aircraft at ramp should not exceed normal walking speed (6 km/h) which is approximately 1.67 m/s and this is also selected as the designed pushback speed for electrical taxiing system( 21 ). Moreover, airbus specifies that the aircraft is required to have the ability to accelerate to 20 Kn within 90 s in case of crossing an active runway, which resulted in an acceleration of about 0.18 m/s2 ( Reference Gubisch 22 ).
The fully integrated intelligent energy 100 kW EC automotive fuel cell was selected as the power source for this study, which includes fuel cell stack, fuel management, air management, water management, thermal management, and control module( 23 ). Although the maximum efficiency of the selected fuel cell is currently about 55%, the value of 60% is assumed in this paper because it is the target efficiency at the technology level in 2020 which is estimated as the time when this system enters into service( 24 ). Table 2 presents the summarised results of system power requirements.
Summarised system initial design results

4.2 Energy and hydrogen requirement sizing
4.2.1 Hydrogen requirement
 $${\rm Required}\,{\rm electric}\,{\rm energy}{\equals}{\rm required}\,{\rm electric}\,{\rm power}{\times}{\rm operation}\,{\rm time}$$
 $${\rm Required}\,{\rm hydrogen}{\equals}{{{\rm Required}\,{\rm electric}\,{\rm energy}} \over {{\rm hydrogen}\,{\rm calorific}\,{\rm value}{\times}{\rm fuel}\,{\rm cell}\,{\rm efficiency}}}$$
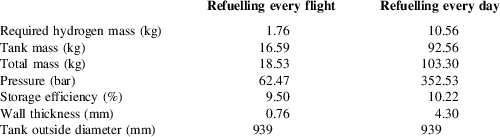
Equations (6) and (7) were used to calculate the quantity of hydrogen consumed by the system. Table 3 presents the summarised results. The breakaway hydrogen requirement for taxi-out is slightly higher than taxi-in phase because MTOM and MLW are used for taxi-out and taxi-in, respectively, when sizing the system.
System hydrogen requirement for one flight cycle

An increased total taxiing time can be caused by airport congestion. However, due to the lack of relevant input data, the method applied in this paper only considers one breakaway action for both taxi-in and taxi-out phase which may not accurately represent the frequent stop-and-go situations in congested airports (Tables 4 and 5).
Spherical tank initial sizing results

a The percentage of maximum stored hydrogen in comparison to the tank mass.
System overall weight breakdown (excluding hydrogen)

4.2.2 Oxygen and water management
Oxygen and water management is always critical for the efficiency of hydrogen fuel cell. Since the entire system is integrated inside an LD3-45W/46 container stored in the lower deck cargo hold, the analysis of the additional effects on the aircraft’s ECS due to the requirement of oxygen and production of water vapour is essential. For the sized system, the additional airflow rate is estimated at 66.1 g/s. The current ECS for A320 has a capacity of providing cabin airflow rate from a minimum of 1.2 kg/s up to 2 kg/s( Reference Martinez 25 ). Comparing with the minimum ECS performance, the estimated additional required air flow is only about 5.5% of total cabin air supply. In addition, the fuel cell system is designed only to be active when the aircraft operating on the ground, so that at this stage the lower deck is not pressurised and oxygen can be easily obtained from the ambient environment so that the impact to aircraft ECS is minimal.
The extra 15.5 kg of water vapour produced by fuel cell in each flight cycle can be either directly drained overboard through a drain mast (such as that used for the existing water and waste system) or condensed and stored in an on-board water tank for potential use (e.g. flushing the toilet). Comparing to the 200 l potable water tank in A320, the total additional water produced by fuel cell only contains about 7.8% of tank capacity( 11 ).
4.3 System packaging
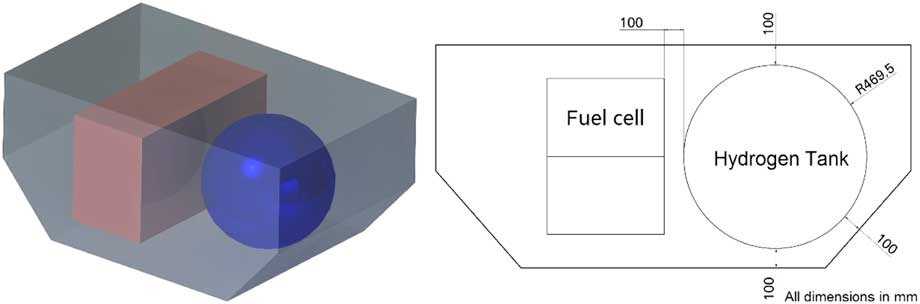
Both spherical and cylindrical tank shapes are commonly used for the hydrogen storage. Considering the relatively small hydrogen capacity requirement for the e-taxi system, the spherical tank was finally selected as it has optimal storage efficiency due to structural advantages. The system packaging method has been checked to fit in both container types used for the A320 family and demonstrated in Fig. 2 with the LD3-45W container as an example. The maximum tank outside radius is limited at 469.5 mm with 100 mm clearance to each wall of the container considering the tank mounting and ventilation requirements.
Packaging with spherical tank.

4.4 Hydrogen tank initial sizing
The ideal material for a high-pressure tank has a very high tensile strength, a low density and does not react with hydrogen or allow hydrogen to diffuse into it. High strength aluminium and stainless steel are commonly used as the materials for hydrogen tanks. As the density of steel is roughly 2.7 times that of aluminium, for the same internal pressure and outside diameter, the steel tank tends to have less wall thickness than the aluminium tank, thus providing more available inside volume. Therefore, stainless steel has been selected for the initial sizing. The tank is initially sized with the maximum available outside diameter and two refuelling methods have been considered.
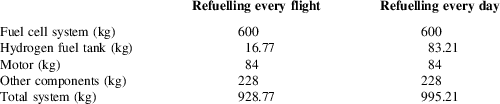
A version of the daily-fill tank using composite materials is designed in detail in Ref 26. This enables a mass saving of almost 10 kg, achieving a mass of 83.21 kg is used for the cost and benefit analysis calculations.
4.5 System weight estimation
The weight of fuel cell system, hydrogen tank, and motor can be quantified either from product specifications or detailed structural analysis. However, the weight of auxiliary parts like gearboxes, wiring, and electronics cannot be accurately quantified at this stage. A rough estimation has been made by comparing to the weight of EGTS because both systems are main gear driven configurations. As the estimated system weight of EGTS is about 150 kg on each wheel which include one 36 kg motor; therefore, the weight of auxiliary parts is assumed as 114 kg in this project( Reference Ganev, Chiang, Fizer and Johnson 27 ). Below is the weight breakdown list of two different systems with different refuelling methods.
4.6 Alternative method using lithium batteries
Apart from using a hydrogen fuel cell, high energy density lithium-ion batteries can also be considered as the power source for an electric taxiing system. The pack specific energy of 140 Wh/kg and 50 Wh/kg have been proved in powering the Airbus eFan and Boeing 787, respectively( Reference Fusalba 28 ). The reasonable specific energy for the lithium-sulphur battery is expected to reach about 300–400 Wh/kg at the technology level of 2020 which matches the estimated service time of the electric taxiing system( Reference Fusalba 28 ). Therefore, relevant battery system weight at both Airbus eFan and 2020 technology level has been estimated for both system configurations. The weight comparison results are presented in Table 6.
System weight comparison between fuel cell and battery methods

a In comparison with the fuel cell & hydrogen tank weight.
The electric taxiing system weight will be significantly increased if the fuel cell power is replaced by a lithium battery at current battery technology level. However, weight reduction can be achieved if the battery energy density of 400 Wh/kg is realised in the future. Therefore, the idea of using a battery to replace fuel cell system is still recommended in the future and relevant work can be considered as a further extension to this paper.
5.0 FUEL and EMISSION BENEFIT ANALYSIS
5.1 Net fuel reduction analysis
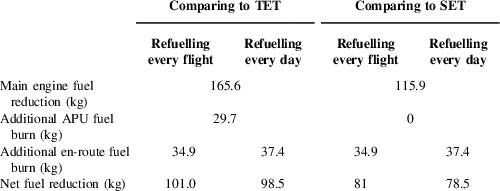
Fuel saved is generally calculated by the difference between taxiing with the main engine and with the e-taxi system in addition with extra en-route fuel burn caused by additional system weight. However, with an on-board hydrogen fuel system and daily refuelling method, the system weight gradually decreases from the first sector to the last sector of each day. This led to the unequal additional en-route fuel consumption for each flight. In this paper, for the daily refuelling method, the additional en-route fuel burn for each single flight has been estimated and the average value has been used for the analysis of system benefit. Table 7 presents the summarised fuel reduction. For average taxiing time in 2015, comparing with twin traditional engine taxi (TET) operation, about 165.6 kg fuel can be saved from not operating the main engine, and about 29.7 kg additional fuel is burned by the APU. The additional en-route fuel consumption varies with the system overall weight and refuelling method from 34.9 kg to 37.4 kg. Therefore, 101 kg and 98.5 kg fuel can be saved in each flight for daily and per-flight refuelling method, respectively. However, SET is now widely implemented in most European airport and the SET and single-engine taxi without APU (SETWA) operating procedure are also included in A320 FCOM( 29 ). Although SET can reduce up to 40% fuel during taxiing phase comparing to TET, but the typical 30% reduction is used to calculate the fuel saved by using e-taxi system comparing with the fuel consumption with SETWA procedure( Reference Fleuti and Maraini 30 ). Therefore, 81 kg and 78.5 kg fuel can be saved in each flight for daily and per-flight refuelling method, respectively, comparing with SET.
Fuel reduction at each flight

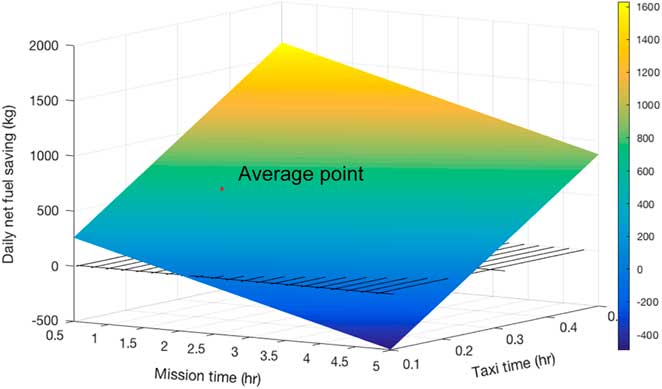
Combined with the number of actual flights flown by the datum operator in 2016, the estimated annual fuel reduction can be obtained. 49,566 t and 48,339 t annual net fuel reduction can be achieved for per-flight and daily refuelling method, respectively, comparing to TET operation. Similarly, 39,751 t and 38,524 t annual net fuel reduction can be achieved for per-flight and daily refuelling method, respectively, comparing to SET operation. One of the other key factors that directly linked to net fuel reduction is the length of each mission and total time spent during the taxiing phase. Therefore, sensitivity studies have been carried to investigate the break-even boundary of fuel reduction and are presented in Fig. 3. Positive net fuel saving is more likely to be achieved on the relative short-range mission but with relative high proportion of taxiing time. This result is positive for datum operator (low-cost carrier) as their business focusing on high frequent short-range route.
Sensitivity study of taxiing time to net fuel saving (comparing with TET).

5.2 Hydrogen consumption analysis
The annual hydrogen consumption for the datum operator in 2016 can be estimated by the required hydrogen at each flight and the total number of flights flown. This can be calculated based on the basic chemical reaction equation in addition with fuel cell efficiency. Totally 863.87 t hydrogen is estimated for the datum operator in 2016.
5.3 Emission reduction analysis
The civil aircraft emissions near the airport are normally quantified based on ICAO engine exhaust emission databank and ICAO standard LTO cycle(
Reference Yılmaz
31
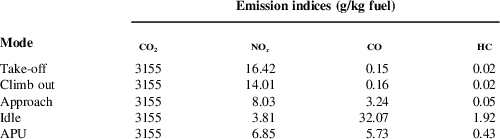
). According to the fleet scale summarised in Section 3.2, the datum operator’s A320s and A319s use different engines which have different emissions characteristics. Therefore, the lowest emission indices between these two engines are picked out and used in the calculation of emission reduction to obtain conservative results. Summarised engine emissions indices and APU emissions indices in the mode of providing ECS are presented in Table 8. The emission of CO2 is normally calculated based on the amount of fuel consumed and about 3,155 g of CO2 will be released for 1 kg of burned modern Jet A1 fuel(
32
). The reason why the EI of CO and HC are inversely proportional to the thrust setting is that they are the result of incomplete combustion due to the extremely low efficiency of fuel atomisation and mixing in low-temperature air(
Reference Penner, Lister, Griggs, McFarland and Dokken
33
). The emission characteristic of
 ${\rm NO}_{x} ,{\rm CO and HC}$
varies with different thrust settings. Engine idle thrust setting is used for taxi phase analysis and the emission index at climb out thrust setting is used in the calculation of en-route emission reduction to obtain conservative results.(
32
,34)
Main engine emission data

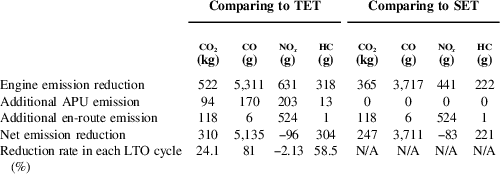
The reduced emissions from the main engines and additional emissions from the APU and those associated with the extra weight en-route can be calculated using Equation (8). Therefore, the net emission reduction can be obtained by Equation (9) and the results are summarised in Table 9:
 $${\rm Emission}\,{\rm reduction}{\equals}{\rm fuel}\,{\rm reduced }{\times}{\rm EI}$$
 $$\eqalignno{ & {\rm Net}\,{\rm emission }\,{\rm eduction}{\equals}{\rm main}\,{\rm engine}\,{\rm emission}\,{\rm reduction} \cr & \hskip15pt {\minus}{\rm additional}\,{\rm APU}\,{\rm emission}{\minus}{\rm additional}\,{\rm en}{\minus}{\rm route emission} $$
Average emission reduction in each flight (refuelling each flight)

As shown in Table 9, comparing to the LTO emission data published by ICAO, the overall emission reduction is prominent especially cutting 81% of CO emission. However, unexpected increases have been found on NO x emission because the formation of NO x requires high temperature at high power setting which resulted in the en-route phase dominated emission characteristic. Therefore, the NO x emission reduced during taxiing phase cannot fully counteract the penalty of the additional emission in the en-route phase.
Considering the number of flights that the datum operator flew in 2016, the estimated annual emissions reduction for the two hydrogen refuelling methods are presented in Table 10. The total annual CO and HC emissions reductions through both refuelling methods are the same, which is caused by the extremely low engine CO and HC emissions index at high power setting, so that the emission reduction is dominated by the taxiing phase when engines operate at idle setting.
Estimated datum operator annual net emission reduction in 2016

6.0 DOC BENEFIT ANALYSIS
6.1 Fuel cost reduction analysis
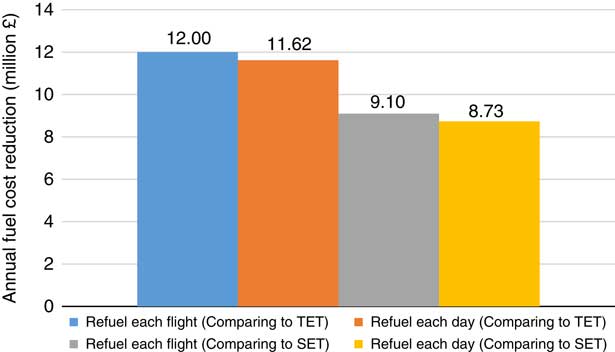
The cost of hydrogen depends on the production method, starting from 1.7 £/kg using biomass gasification, rising to 14.2 £/kg with a photoelectrochemical method( 35 ). For this analysis, the current price of distributed natural gas reforming (3.1 £/kg) has been selected, considering about 66% of industry standard hydrogen is still produced from fossil fuel currently( Reference MacDonald 36 ). Therefore, the net fuel cost reduction can be calculated considering the fuel saved, fuel price hydrogen used, and hydrogen cost in Equation (10). Figure 4 summarises the net annual fuel cost savings for the datum operator in 2016:
 $${\rm NNet}\,{\rm fuel}\,{\rm cost}\,{\rm reduction}{\equals}\left( {{\rm fuel price}{\times}{{{\rm net}\,{\rm fuel}\,{\rm reduction}} \over {{\rm \rrho }_{{{\rm jet A}1}} }}} \right){\minus}({\rm H}_{2} {\rm price}{\times}{\rm H}_{2} {\rm consumption})$$
Estimated net fuel cost saving in 2016.

Comparing with the £1,114 m annual fuel cost in 2016 of the datum operator, up to 1% of direct fuel cost reduction is estimated to be achieved by using this system. This is lower than the predicted 3% fuel cost reduction claimed by Safran and Honeywell( 1 ).
6.2 Emission cost reduction analysis
Substantial CO2 emission reduction has been proved in previous analysis. The EU ETS carbon price is determined by trading and so varies over time. In 2017, it is at a historical low (approximately £3.36/tCO2) since the current phase of the scheme started in 2013( Reference McCreary 37 ):
 $${\rm Carbon}\,{\rm fee}\,{\rm reduction}{\equals}{\rm CO}_{2} {\rm reduction}{\times}{\rm carbon}\,{\rm price}$$
Referring to Equation (11), the reduced carbon fee has been calculated based on the ETS carbon price of £3.36/tCO2 and presented in Table 11. The additional CO2 emission which could be released during the production of hydrogen is not included in this result because it is assumed to be paid from hydrogen production and included in the price of hydrogen.
Estimated datum operator annual emission cost reduction in 2016

6.3 Powerplant maintenance cost reduction analysis
6.3.1 Main engine cost reduction
For the flight length of 1.5 h, engine performance reset rate of £82/FH can be referred for CFM56-5B4 engine( Reference Ackert 8 ). Therefore, following Equation (12), the estimated performance reset cost reduction is calculated as 25.42 £/flight. As LLPs are forced to be replaced by a certain number of flight cycles, so that the reduction of engine operation time in each flight cycle will not contribute to the cost reduction of LLPs replacement. Typically, the direct FOD-related engine maintenance cost is about 17 £/flight and the reduced value of 10.33 £/flight can be obtained by using Equation (13)( Reference Santo 38 ):
 $${\rm PR}\,{\rm cost}\,{\rm reduction}{\equals}{\rm PR}\,{\rm rate}{\times}{\rm electrical}\,{\rm taxiing}\,{\rm time}{\times}n_{{{\rm eng}}} $$
 $${\rm FOD}\,{\rm cost}\,{\rm reduction}{\equals}{\rm FOD}\,{\rm rate}{\times}{{{\rm electrical}\,{\rm taxiing}\,{\rm time}} \over {{\rm total}\,{\rm taxiing}\,{\rm time}}}$$
6.3.2 Additional APU maintenance cost
General maintenance cost of the APU used on the A320 is about 28
 ${\rm \pounds}\,/\,{\rm APU FH}$
and the additional APU maintenance cost is estimated at about 4.34 £/flight based on the additional APU operating time by using electric taxiing(
Reference Ackert
8
):
 $${\rm Additional APU cost}{\equals}{\rm APU MRO rate}{\times}{\rm electrical taxiing time}$$
6.3.3 Net powerplant maintenance cost reduction
The annual MRO costs reduction for the datum operator are summarised in Table 12 and 13, based on the relevant reduction rate obtained in the preceding sections and the total number of flights in 2016.
Summarised datum operator powerplant maintenance cost reduction in 2016 (comparing to TET)

a Compared to the total maintenance cost of £237 million in 2016( 14 ).
6.4 Carbon brakes wear-out cost reduction
The high wear rate generally occurs when the brake is at relatively low temperature and the wear caused by several light brake applications is more severe than one firm brake because the wear of carbon brakes is primarily dependent on the number of brake applications( Reference Su, Xiao, Liu, Meng, Peng, Gu, Li and Xing 39 ). However, crews tend to constantly apply brakes to adjust taxiing speed because of the thrust response lag of jet engines. Therefore, the application of electrical taxiing system enables the crew to control taxiing speed more accurately, the wear-out of carbon brakes can be significantly reduced. The typical Mean Time Between Repair for carbon brakes is 1500–2000 cycles and the overhaul cost of carbon brakes can be up to £40,000( Reference Kern 40 , Reference Allen, Miller and Preston 41 ). Generally, about 20% to 30% of a carbon brake’s life is reduced through the multiple brake applications during the taxiing phase( 42 ). According to these data, the brake wear-out cost reduction is finally estimated at about 4 £/flight, so that the estimated annual brakes wear-out cost reduction is £ 1,963,015 which is about 0.8% of the datum operator’s total maintenance cost in 2016 (Table 13):
 $${\rm Brake}\,{\rm cost}\,{\rm reduction}{\equals}{{{\rm Brake}\,{\rm cost}} \over {{\rm Brake}\,{\rm life}}}{\times}20{\rm \,\%\,}$$
Summarised datum operator powerplant maintenance cost reduction in 2016 (comparing to SET)

6.5 Gate operation cost reduction
In current gate operations, aircraft are pushed back by tractors and the process is charged typically no less than £80/cycle( Reference Cox 5 ). With electric taxiing system, self-pushback can be realised without the additional assistance from ground services, and the cost can be reduced substantially. However, in real operations, boarding bridge availability is sometimes limited and no pushback process is required if aircraft are parked on a remote apron. Moreover, the additional visual assistant device may be needed as the backward visibility is essential when process self-pushback. Therefore, the reduction in pushback cost can be guaranteed but has not been quantified due to the unknown data of boarding bridge utilisation rate.
Apart from direct cost, shortened gate operation time can alternatively increase the airline profit. Simplified pushback processes directly lead to the reduced gate operating time as the crew can immediately take the action after receiving ATC clearance. Pushback time reduction of up to 2 min is estimated for EGTS with the eliminated tow bar connection and disconnection process( 1 ). Combined with the WheelTug twist operation method, total turnaround time reduction of up to 20 min can simply be achieved by allowing passenger boarding from both front and rear doors( Reference Cox 5 ). As aircraft can only be dispatched until the brakes are cooled below a certain specified temperature. With reduced brake application during taxiing phase, more time is gained for the brake to cool down, and so avoid the use of brake cooling fans which further improve turnaround time. The benefits explained above can be realised by using an e-taxi system. However, it is hard to quantify them in detail due to the reason of uncertainty and lack of input data at the current research stage. Some operational surveys in the future will improve the accuracy of the cost saving predictions.
6.6 Summary of DOC benefit
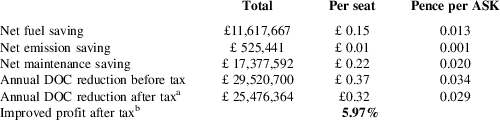
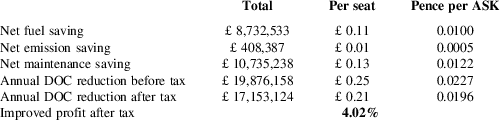
Based on the combined effects of the above aspects, the net benefit of using a fuel cell powered electric taxiing system are summarised and presented in Table 14 and 15. Comparing with the after-tax profit of £427 m in 2016, about 5.73% net profit improvement can be achieved for the datum operator.

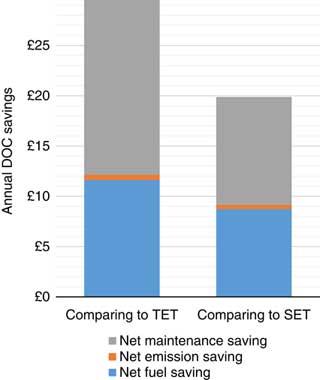
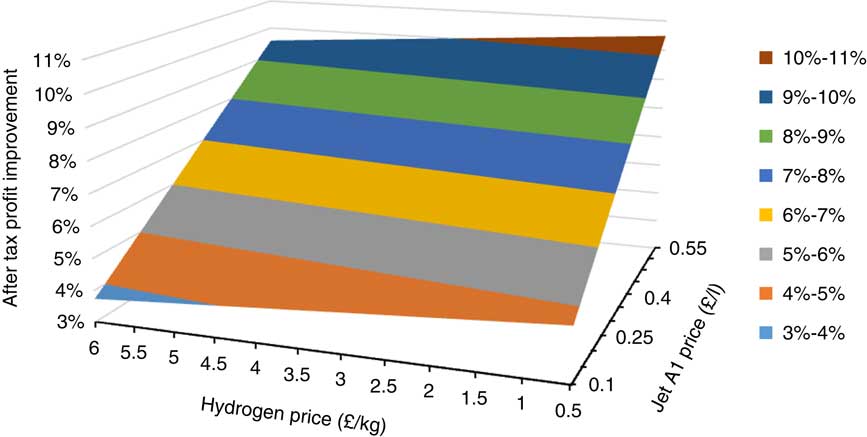
As presented in Fig. 5, the reduction contributed by fuel saving takes less than half of the total system DOC reduction. This is caused by the combination of current relatively low jet fuel price and high hydrogen production cost. A sensitivity study has been carried to investigate the potential benefit of the different combination of jet fuel and hydrogen price. As can be seen in Fig. 6, the profit improvement is more sensitive to jet fuel price than the price of hydrogen. Up to 10.5% overall profit improvement can be realised if the jet fuel price rises back to the 2012 level (about 0.55 £/l) (Table 15).
Annual DOC reduction constitution.

Sensitivity study for the effect of jet fuel and hydrogen price to profit improvement.

Estimated datum operator DOC reduction in 2016 (comparing to SET)

7.0 CONCLUSION
Starting with the system initial sizing, this project focused on evaluating the performance impact of using a hydrogen fuel cell powered electric taxiing system on a midsize commercial airliner like the Airbus A320. The analysis has been applied to a typical Europe-based, low-cost, larger scale A320 family operator. Using conservative estimation, a system formed of four fuel cells and one spherical hydrogen tank with total power output of 400 kW is proposed. The benefit of fuel consumption and emissions are evaluated based on the ICAO engine emission data and applied with the reduced engine operating time which is a result of using the electric taxiing system. To predict the DOC reduction and profit improvement, the evaluation process has been carried out with the conservative input parameters, such as the low taxiing fuel burn rate, high emission indices, and low maintenance cost. Using the financial overview of the datum operator in 2016, up to 1% block fuel cost reduction can be achieved, and the reduction in total maintenance cost is up to 7.3%. With the implementation of a hydrogen fuel cell e-taxi system, up to 5.97% net profit improvement is estimated using the annual after-tax profit of the datum operator in 2016 comparing to TET. The net profit improvement comparing to SET is about 4.02%. Sensitivity studies have been carried out which indicate the potential overall profit improvement of 10.5% can be realised when the jet fuel price is at a high level as predicted for the future. Therefore, the idea of using a hydrogen fuel cell powered electric taxiing system is initially proved to have positive profit improvement for the datum operator.
This research has been based on many published operational statistics. However, cost estimations can be improved by future operational surveys focusing on the ground phases. The system design can also be refined by continuing with detailed design and integration studies. To transit from traditional taxiing to hydrogen powered e-taxiing, both airlines and airports need a transitional period to implement hydrogen storage, handling, and fuelling facilities. Therefore, a hybrid system with kinetic energy recovery system and high energy-density battery may be a choice for the transitional period which using the energy recovered during landing deceleration to partially power the e-taxi system.