


Ten to forty percent of students experience some degree of test anxiety in the form of physical, behavioural, and/or affective symptoms that can include, but are not limited to, excessive perspiration, rapid heartbeat, headaches, muscle tension, nervousness, negative self-statements, test avoidance, and difficulty sleeping, eating, or concentrating (Salend, Reference Salend2011; von der Embse, Barterian, & Segool, Reference von der Embse, Barterian and Segool2013). It is notable that Whitaker Sena, Lowe, and Lee (Reference Whitaker Sena, Lowe and Lee2007) suggested that children experiencing test anxiety may be more likely than adolescents or adults to display associated physical symptoms. Experiencing test anxiety can be emotionally difficult and is associated with a negative impact on a student’s wellbeing and educational performance, as measured by test scores (Salend, Reference Salend2011; Whitaker Sena et al., Reference Whitaker Sena, Lowe and Lee2007). Test anxiety can affect students of all ages despite levels of achievement (Stroud & Reynolds, Reference Stroud, Reynolds, Gutkin and Reynolds2009). It may appear as early as age 7 (Connor, Reference Connor2003), with Hembree (Reference Hembree1988) noting a sharp increase in test anxiety for elementary students between 3rd and 5th grade, followed by more constant levels through high school. Students diagnosed with disabilities and students from diverse cultural and linguistic backgrounds demonstrate high levels of test anxiety (Salend, Reference Salend2011; Whitaker Sena et al., Reference Whitaker Sena, Lowe and Lee2007). Even students who are comfortable with exam content may perform poorly due to test anxiety (Terry, Reference Terry2006).
The growing international research literature on student stress, worry, and anxiety in relation to high stakes tests, recently noted by Banks and Smyth (Reference Banks and Smyth2015), provides a compelling case for a cross-cultural interest in test anxiety. This relationship has been explored at both the elementary (primary) and secondary levels. For example, Putwain, Connors, Woods, and Nicholson (Reference Putwain, Connors, Woods and Nicholson2012) recently assessed stress and anxiety levels of primary students in England related to the Standard Assessment Tests (SATs). Student perceptions of self-competence, performance pressure, and teacher and peer interactions influenced whether they reported the exam to be challenging versus stressful. In Ireland, Banks and Smyth (Reference Banks and Smyth2015) studied the influences of individual and school factors on the stress levels of secondary students prior to completing the Leaving Certificate examination. They found that students reported increased levels of stress prior to exams, but those students with more positive teacher and peer interactions reported relatively lower levels of stress. Test anxiety in Australian secondary students was studied in relation to item omissions on the Queensland Core Skills (QCS) test, with higher rates of omissions found to be associated with higher levels of test-irrelevant thinking (a cognitive component of test anxiety; Matters & Burnett, Reference Matters and Burnett2003). With the introduction of new national exams required for all for 3rd-, 6th-, and 9th-graders in Sweden, Nyroos, Korhonen, Linnanmäki, and Svens-Liavåg (Reference Nyroos, Korhonen, Linnanmäki and Svens-Liavåg2012) assessed test anxiety levels of Swedish 3rd-graders and compared them to 3rd-graders in Finland, where national exams are administered to a random sampling of students, but local exams are more numerous. While Nyroos et al. (Reference Nyroos, Korhonen, Linnanmäki and Svens-Liavåg2012) found low levels of test anxiety in 3rd-grade students, they noted this could have been influenced by the participants’ young age and Swedish students not being aware of potential test-related consequences, due to the relatively recent introduction of the tests. Despite studies demonstrating the existence of test anxiety in different countries, Nyroos et al. (Reference Nyroos, Korhonen, Linnanmäki and Svens-Liavåg2012) cautioned against overgeneralising results due to culture-specific influences that may exist. Therefore, it remains important to explore the construct in the context of specific societies and educational systems.
The recent increase in standardised testing within the U.S. education system has brought new potential educational and administrative consequences for schools and districts that do not meet specific performance goals (von der Embse et al., Reference von der Embse, Barterian and Segool2013). The No Child Left Behind Act of 2001 (NCLB, 2001) and its successor, the Every Student Succeeds Act (ESSA, 2015), have required annual assessments of reading and math skills for all students in Grades 3 through 8 and once between Grade 10 and Grade 12, as well as at least one assessment in science at the elementary, middle, and high school levels (U.S. Department of Education, 2004, 2016, 2017). Student scores from state and national level exams are now reported to the public and used to make critical decisions about student progress and educational programs (Salend, Reference Salend2011; Segool, Carlson, Goforth, von der Embse, & Barterian, Reference Segool, Carlson, Goforth, von der Embse and Barterian2013), which subsequently increases the consequences of failure for students and potentially results in cognitive, emotional, and physiological symptomatology (Larson, El Ramahi, Conn, Estes, & Ghibellini, Reference Larson, El Ramahi, Conn, Estes and Ghibellini2010). This exact scenario was predicted by Hill and Wigfield (Reference Hill and Wigfield1984) more than 30 years ago. In the first study of test anxiety related to NCLB versus classroom tests, Segool et al. (Reference Segool, Carlson, Goforth, von der Embse and Barterian2013) found that elementary students experienced significantly higher levels of test anxiety in relation to NCLB assessments compared to classroom tests. These increased stressors, particularly for those who already experience anxiety when faced with a testing situation, underscore the need for additional research on the implementation of interventions to reduce test anxiety in the classroom.
Schools, with the expertise of school psychologists, have the opportunity to offer group and individual interventions for test anxiety as part of a multitiered service model that includes group and individual levels (von der Embse et al., Reference von der Embse, Barterian and Segool2013). A variety of intervention strategies for test anxiety have been suggested and researched. Salend (Reference Salend2011) suggested that teachers could assist in reducing test anxiety by modifying their approach to assessment. Modifications to assessment time limits, how instructions convey the nature of the test, and item difficulty were previously suggested as strategies to reduce test anxiety by Hill and Wigfield (Reference Hill and Wigfield1984). Teachers could also work toward creating more student-friendly tests, involving students in the testing process, providing accommodations, offering a range of scoring methods, using technology-based testing, and allowing collaborative test-taking (Salend, Reference Salend2011). Despite these options, interventions for test anxiety typically focus on the student. Academically based, student-centred approaches to decrease test anxiety include improving academic skills, study skills, test-taking skills, and time management (Salend, Reference Salend2011; Stroud & Reynolds, Reference Stroud, Reynolds, Gutkin and Reynolds2009). A literature review by von der Embse et al. (Reference von der Embse, Barterian and Segool2013) identified cognitive-behavioural techniques that have shown promise, including attention control, systematic desensitisation, building self-competence, and focusing on thought-emotion links. Studies that include relaxation techniques, such as diaphragmatic breathing, guided imagery, biofeedback, and progressive muscle relaxation (PMR), have also been effective at reducing test anxiety (von der Embse et al., Reference von der Embse, Barterian and Segool2013). While most of these techniques have been well represented in the literature, relatively little has been published on PMR. Following the suggestion of Whitaker Sena et al., (Reference Whitaker Sena, Lowe and Lee2007) that children (compared to adolescents or adults) may be more likely to exhibit the physical rather than cognitive symptoms of test anxiety, and with research supporting the use of interventions that include PMR in reducing the physiological symptoms of anxiety (Lohaus & Klein-Hessling, Reference Lohaus and Klein-Hessling2003; Varvogli & Darviri, Reference Varvogli and Darviri2011; Zaichkowsky & Zaichkowsky, Reference Zaichkowsky and Zaichkowsky1984), the use of PMR with elementary students merits further attention.
Progressive muscle relaxation
PMR is a technique developed in the 1920s and 1930s by Edmund Jacobsen (Jacobson, Reference Jacobson1938; Varvogli & Darviri, Reference Varvogli and Darviri2011). It involves the tensing and releasing of muscle groups in a prescribed sequence with the intent of inducing a state of relaxation. The technique is based on the premise that muscle tension is related to anxiety and its relief leads to decreases in anxiety. The use of muscle relaxation techniques to address anxiety has been discussed under the umbrella of cognitive-behavioural techniques (see Swearer, Givens, & Frerichs, Reference Swearer, Givens, Frerichs, Gimpel, Peacock, Ervin, Daly and Merrell2010; Wright, Basco, & Thase, Reference Wright, Basco and Thase2006). In PMR sessions, muscles in the face, arms, hands, legs, and feet are tensed for 10 seconds and then released for 20 seconds. Instructions for the sequence can be read by a therapist or heard via recording. During this process, the individual is taught to redirect their attention and focus on the sense of relaxation after the release of muscle tension (Varvogli & Darviri, Reference Varvogli and Darviri2011; Wright et al., Reference Wright, Basco and Thase2006).
In addition to the reduction of perceived anxiety, PMR has been found to have positive physiological impacts in adults, such as reduced cortisol levels, blood pressure, heart rate, and headaches (Varvogli & Darviri, Reference Varvogli and Darviri2011). Interventions that include PMR have been found to be effective at reducing physiological symptoms of anxiety in 4th- and 6th-graders (Lohaus & Klein-Hessling, Reference Lohaus and Klein-Hessling2003; Zaichkowsky & Zaichkowsky, Reference Zaichkowsky and Zaichkowsky1984). Score reductions in reported anxiety for 12th-graders (Rasid & Parish, Reference Rasid and Parish1998) and reported test anxiety of 3rd-graders (Larson et al., Reference Larson, El Ramahi, Conn, Estes and Ghibellini2010) have also been found with interventions that include PMR. Most recently, Putwain, Chamberlain, Daly, and Sadreddini (Reference Putwain, Chamberlain, Daly and Sadreddini2014) demonstrated the efficacy of a multimodal intervention for test anxiety, STEPS (Strategies to Tackle Exam Pressure and Stress), with secondary students. It includes instructions on identifying test anxiety symptoms, self-reflection, practice of strategies to manage anxiety (including abdominal breathing and PMR), and videos detailing the personal experiences and strategies of students with test anxiety. The STEPS intervention was designed with consideration to school resources and can be delivered utilising technology, rather than needing the assistance of a school psychologist or counsellor (Putwain et al., Reference Putwain, Chamberlain, Daly and Sadreddini2014).
PMR is not difficult for children to learn, and it can be incorporated into an academic environment (Larson et al., Reference Larson, El Ramahi, Conn, Estes and Ghibellini2010), which is consistent with Hintze’s (Reference Hintze, Shinn, Walker and Stoner2002) recommendation of employing newly learned skills at the point of performance. To be successful, however, the script should be developmentally appropriate. This could be accomplished through analogies for the muscle tensing and releasing process, such as the student pretending to squeeze lemons or squish a bug (Swearer et al., Reference Swearer, Givens, Frerichs, Gimpel, Peacock, Ervin, Daly and Merrell2010). Despite PMR and the use of technology for delivering a test anxiety intervention being supported by research, if the individuals involved in its implementation do not find it to be an acceptable intervention, its effectiveness may be negatively impacted.
Intervention acceptability
Building on the social validity research of Wolf (Reference Wolf1978), Witt and Elliott (Reference Witt, Elliott and Kratochwill1985) proposed a model that explores the interactions between intervention acceptability, intervention integrity, intervention effectiveness, and intervention utilisation. The premise holds that if an individual has a higher level of acceptability for an intervention, that individual will be more likely to implement the intervention and implement it with integrity, which will lead to greater efficacy and higher levels of subsequent utilisation. These interactions have been supported through numerous studies regarding the acceptability of interventions and assessments (Carter, Reference Carter2007; Cross Calvert & Johnston, Reference Cross Calvert and Johnston1990; Eckert & Shapiro, Reference Eckert and Shapiro1999; Miltenberger, Reference Miltenberger1990), but have yet to be assessed in relation to the use of PMR for test anxiety. With the efficacy of an intervention partially dependent upon the acceptability of the intervention, it is important to establish acceptability levels for the use of PMR to address test anxiety prior to implementation.
School-based interventions are typically implemented by teachers, thereby making the teacher’s level of acceptability for an intervention a critical consideration (Elliott, Witt, Kratochwill, & Stoiber, Reference Elliott, Witt, Kratochwill, Stoiber, Shinn, Walker and Stoner2002). The teacher’s acceptability for an intervention should also be considered when another professional is implementing the intervention within the teacher’s classroom. To date, there have been no studies published on teachers’ or any other school professionals’ acceptability of PMR as an intervention for test anxiety. With consideration to the use of technology for delivering test anxiety interventions (i.e., Putwain et al., Reference Putwain, Chamberlain, Daly and Sadreddini2014) and the possibility of PMR scripts being presented via recording (Varvogli & Darviri, Reference Varvogli and Darviri2011; Wright et al., Reference Wright, Basco and Thase2006), it is also important to determine whether levels of acceptability for PMR vary by the inclusion of technology. Howard (Reference Howard2011) found relationships between risk acceptability, affect, and value judgments when integrating technology into the classroom, but this was focused on its use for teaching, not for interventions.
Assessing acceptability levels for PMR with and without technology by teachers who are certified to teach in special education is particularly relevant because, in the United States, students with disabilities who receive services under special education are provided an individualised education plan (IEP) and may be permitted to use adaptive devices or technology under the Individuals with Disabilities Education Improvement Act (IDEIA, 2004). Therefore, teachers who are certified to work in special education may be more accustomed to implementing differentiated instruction and intervention techniques than teachers in general education. Acceptability levels by Nationally Certified Teachers (who must demonstrate competency in differentiated instruction) may also vary from their teacher colleagues. Teachers in the United States can apply to become a Nationally Certified Teacher after completing a bachelor’s degree from an accredited institution, obtaining a valid state teaching license, and completing three years of successful teaching. The Nationally Certified Teacher credential is available in 25 areas and administered by the National Board for Professional Teaching Standards (NBPTS). Over 112,000 teachers have earned the credential and can apply for renewal every five years. Applicants for the credential must successfully complete a computer-based assessment to demonstrate content knowledge and submit three portfolios for review under the headings of differentiation in instruction, teaching practice and learning environment, and effective and reflective practitioner (NBPTS, 2017). There is currently no research that differentiates teachers’ acceptability levels for technology based on type of certification.
Purpose of the study
As the international increase in the use of high stakes tests continues (see Banks & Smyth, Reference Banks and Smyth2015; Matters & Burnett, Reference Matters and Burnett2003; Nyroos et al., Reference Nyroos, Korhonen, Linnanmäki and Svens-Liavåg2012; Putwain et al., Reference Putwain, Connors, Woods and Nicholson2012), school psychologists and counsellors need to be equipped with effective school-based interventions for test anxiety. Interventions that directly address the causes of test anxiety would be ideal. However, test anxiety is a multidimensional construct with multiple theories regarding its etiology and structure (Hembree, Reference Hembree1988; Nyroos et al., Reference Nyroos, Korhonen, Linnanmäki and Svens-Liavåg2012; Whitaker Sena et al., Reference Whitaker Sena, Lowe and Lee2007). Until the future of high stakes testing is determined and the causative factors behind test anxiety are better delineated, school psychologists and counsellors need to focus on reducing the symptoms students are currently experiencing as a result of test anxiety. With differences in test anxiety levels identified across grades (Hembree, Reference Hembree1988) and the possibility that elementary students may manifest physical symptoms to a greater degree than adolescents and adults (Whitaker Sena et al., Reference Whitaker Sena, Lowe and Lee2007), it appears appropriate to differentiate intervention strategies by grade level. Consequently, school psychologists and counsellors may want to consider an intervention that focuses on physical symptom relief, such as PMR, at the elementary level. Although previous studies have demonstrated that interventions that include PMR can be effective at reducing anxiety in school settings (see Larson et al., Reference Larson, El Ramahi, Conn, Estes and Ghibellini2010; Putwain et al., Reference Putwain, Chamberlain, Daly and Sadreddini2014; Rasid & Parish, Reference Rasid and Parish1998; Zaichkowsky & Zaichkowsky, Reference Zaichkowsky and Zaichkowsky1984), the level of intervention acceptability by those involved with implementation can influence intervention integrity and outcomes (Cross Calvert & Johnston, Reference Cross Calvert and Johnston1990; Reimers, Wacker, & Koeppl, Reference Reimers, Wacker and Koeppl1987; Tarnowski & Simonian, Reference Tarnowski and Simonian1992; Von Brock & Elliott, Reference Von Brock and Elliott1987; Witt & Elliott, Reference Witt, Elliott and Kratochwill1985). Therefore, when implementing a classroom-based intervention, it is imperative to assess the classroom teacher’s level of acceptability for the intervention.
The current study used a vignette format to assess teachers’ levels of acceptability for the use of PMR within an elementary level classroom. By understanding these levels of acceptability, which influence intervention integrity, efficacy, and utilisation (Witt & Elliott, Reference Witt, Elliott and Kratochwill1985), school psychologists and counsellors will be better equipped to recommend interventions for test anxiety in the schools. Due to the increasing availability of technology within schools and the need for some students to use assistive technology (see IDEIA, 2004), acceptability for several variations of PMR were assessed. Teacher acceptability ratings were assessed for PMR using no technology, recorded instructions on a CD, and recorded instructions on a digital music player. Due to the absence of research in this area, no a priori hypotheses were formulated. The following exploratory research questions were posed:
(1) What are teachers’ levels of acceptability for the use PMR to address test anxiety? This information is currently absent in the literature.
(2) The integration of technology into the classroom has been found to influence teachers’ value judgements (see Howard, Reference Howard2011). Therefore, do teachers’ levels of acceptability for the use of PMR to address test anxiety vary depending on the inclusion of technology?
(3) As students who receive special education services in the United States are required to have IEPs (IDEIA, 2004), teachers certified in special education may be more accustomed to implementing differentiated instruction and intervention. Consequently, do teachers’ levels of acceptability for the use of PMR to address test anxiety vary depending on whether they are certified to work with students in special education?
(4) Research has indicated an increase in test anxiety during the late elementary grades (see Hembree, Reference Hembree1988). Do teachers’ levels of acceptability for the use of PMR to address test anxiety vary depending on grade level?
Method
Participants
A mailing list of 1,800 randomly selected first through fifth grade U.S. public school teachers was purchased from the company Market Data Retrieval. Participants were selected using Market Data Retrieval’s internal randomisation algorithm. Participants were limited to elementary level teachers in first through fifth grade due to test anxiety levels varying by grade (Hembree, Reference Hembree1988), the possibility that elementary students may exhibit more physical symptoms of test anxiety (Whitaker Sena et al., Reference Whitaker Sena, Lowe and Lee2007), and to reduce confounding variables that exist at the secondary level. For example, students at the secondary level switch classrooms for different subjects, resulting in a reduction in the time teachers have to spend with each student during the school day. All 50 states and the District of Columbia were represented, with the greatest representation from Texas (12%), California (10%), Florida (7%), and New York (5%). Representation from each of the remaining states was below 5%. Gender information was available for 92% of the individuals. Ninety percent of the individuals on the mailing list were female and 10% were male.
Of the 1,800 study packets that were mailed, 16 were returned due to incorrect addresses, leaving 1,784 possible participants. From these possible participants, 480 study packets were returned, resulting in a return rate of 27%. Seventy-six of the returned study packets were not included in the study due to declining participation (41 individuals; 9% of returned packets), indicating a grade or teaching position other than first through fifth grade (26 individuals; 5% of retuned packets), not completing the demographics page or IRP-15 (2 individuals; <1% of returned packets), and having more than 20% of the items on the IRP-15 blank (7 individuals; 2% of returned packets). This left a total of 404 participants for data analyses.
The sample included representation from 49 U.S. states and Washington, D.C., with no participants from Hawaii. The states with the greatest representation were California (12%), Texas (8%), Florida (6%), New York (5%), and Pennsylvania (5%). Representation from each of the remaining states was below 5%. Ninety-one percent of the sample participants were female and 9% were male. This gender representation was consistent with the most recent statistics, which indicated that 89% of U.S. public elementary school teachers during the 2015–2016 academic year were female (U.S. Department of Education, National Center for Education Statistics, 2017). Participant representation was distributed well across grade level, school district locale, and years of experience. Participant distribution across conditions was as follows: school psychologist or counsellor-assisted PMR – 139; CD player-assisted PMR – 145; and digital music player-assisted PMR – 120. A summary of demographic information can be found in Table 1.
Demographic Characteristics of Study Participants

Materials
Study packets consisted of a cover letter, demographics page, one of three scenarios, and the Intervention Rating Profile-15 (IRP-15; Martens, Witt, Elliott, & Darveaux, Reference Martens, Witt, Elliott and Darveaux1985). Each study packet for the initial mailing also included a $1 bill as an incentive for participation.
Demographics page. Participants completed a demographics page, which requested information on their setting and background. Setting questions included their state, grade level (kindergarten through 6th grade), and locale (urban, suburban, or rural). Options for kindergarten and 6th grade were included in the event that teachers previously identified, as first through fifth grade had changed levels. Individual background questions included the participant’s gender, degree (bachelor’s, master’s, or doctorate), years of experience as a teacher, if they were certified to teach special education, and if they were a Nationally Certified Teacher.
Scenarios. Three scenarios for the use of PMR in the classroom were created. Each scenario was similar, detailing that a hypothetical student in the teacher’s class was experiencing anxiety related to taking tests. Although not specifically stated in the instructions, this phrasing was intended as a prompt for the teacher to consider the intervention and intervention acceptability in the context of his/her own classroom, grade level, and student population. The scenario further detailed that the anxiety had resulted in emotional distress for the student and a reduction in academic performance, as measured by grades. This was followed by a brief description of PMR, a statement indicating that research has supported its use as an intervention for test anxiety in children, and the steps involved for a 10-minute session in the back of the room with no teacher participation necessary. The scenario further indicated that sessions would take place once per day, three days per week, over a five-week period. The three scenarios differed on how the script for the PMR session was delivered. In the first scenario, the script was read by a school psychologist or counsellor. In the second scenario, the student used a handheld CD player to listen to the PMR script. In the third scenario, the student listened to the PMR script using a handheld digital music player. Distinct scenarios for CD and digital music players were used to account for potential variations in resource availability. The scenarios using the CD and digital music players included that the devices were played at a volume other students could not hear. They also indicated that the devices ran on batteries, and had no radio, internet, or phone access. An example vignette (PMR with the school psychologist or counsellor) is included below:
A student in your class has been experiencing anxiety related to taking tests. It has resulted in emotional distress for the student and a reduction in academic performance as measured by grades. The following intervention involves training the student to use Progressive Muscle Relaxation (PMR) as a stress reduction strategy. Previous studies have demonstrated that children are capable of learning relaxation techniques and that progressive muscle relaxation can be used as part of a successful test anxiety reduction strategy in children. Progressive muscle relaxation requires the individual to alternately tense and relax various muscle groups one at a time within the body.
During each session, the student goes to the back of the room, lies down or sits against the wall, and closes his/her eyes. The script (set of instructions) for the order of tensing and relaxing muscle groups is read from a paper by the school psychologist or counselor during the intervention. No teacher participation is necessary. Each muscle group is tensed for 10 seconds and then relaxed for 20 seconds. The session lasts 10 minutes and the student returns to his/her desk when it is completed. Sessions take place once per day, three days per week, over a five-week period.
Intervention Rating Profile-15 (IRP-15). The IRP-15 (Martens et al., Reference Martens, Witt, Elliott and Darveaux1985) is a 15-item scale that assesses the rater’s level of acceptability for a specific classroom intervention. It is one of the most frequently used measures to assess acceptability (Carter, Reference Carter2007). Research by Martens et al. (Reference Martens, Witt, Elliott and Darveaux1985) has supported one primary factor for the IRP-15 and a reliability coefficient of .98. Cronbach’s alpha using data from the current study was .96. Each item is rated on a 6-point Likert-type scale from 1 = strongly disagree to 6 – strongly agree. Possible total scores range from 15–90. While acceptability ranges have not been established for the IRP-15, a total score of 53, which corresponds to a mean item rating of 3.5 on the scale, has been interpreted as a minimum level of acceptability (B.K. Martens, personal communication, September 3, 2015). For the purposes of the current study, a total score of 60, which corresponds to a mean item rating of 4 (exceeding the Likert-scale midpoint and representing the top third of rating options), was considered to be the threshold for ‘good’ intervention acceptability by study participants.
Procedure
Research design. Survey methodology with an analog case was utilised to reach a larger number of participants and improve representativeness at the national level. Scenarios were presented using a paper-based vignette format due to the study packet being delivered by mail. The written scenario describing the problem and intervention was included in the study packet to improve the ecological validity of the study’s results (see Carter, Reference Carter2007). Participants were randomly assigned to one of three conditions (student engaging in PMR with the assistance of a school psychologist or counsellor, CD player, or digital music player). Random assignment was completed using Research Randomizer (Urbaniak & Plous, Reference Urbaniak and Plous2013).
Mailings. Study packets were mailed to all participants at their school address on the same day and followed by a reminder postcard two weeks later. Three weeks after the reminder postcard was sent, a second study packet (without the $1 incentive) was mailed to participants who had not returned the study packet by that time. Two weeks after the second study packet was sent, a second reminder postcard was mailed to participants who had still not returned a study packet.
Data analysis and missing data. Data analyses were conducted using SPSS 21 and Microsoft Excel. Statistical significance was set at p – .05. Valid/person mean substitution, which maintains good representativeness when 20% or less of a participant’s data are missing (Downey & King, Reference Downey and King1998; Raaijmakers, Reference Raaijmakers1999), was used to address missing data. Participants who returned IRP-15 forms that contained more than 20% missing data were dropped from the study.
Valid/person mean substitution was used for 51 items distributed across 41 participants. Thirty-four of these participants had one missing item, four had two missing items, and three had three missing items. The percentage of missing responses for each item were: 0% (item 7); 0.3% (items 1, 6, 9, 10, 13, and 14); 0.5% (items 11 and 15); 0.7% (item 2); 1.2% (items 4, 8, and 12); 2.5% (item 3); and 3.2% (item 5).
Results
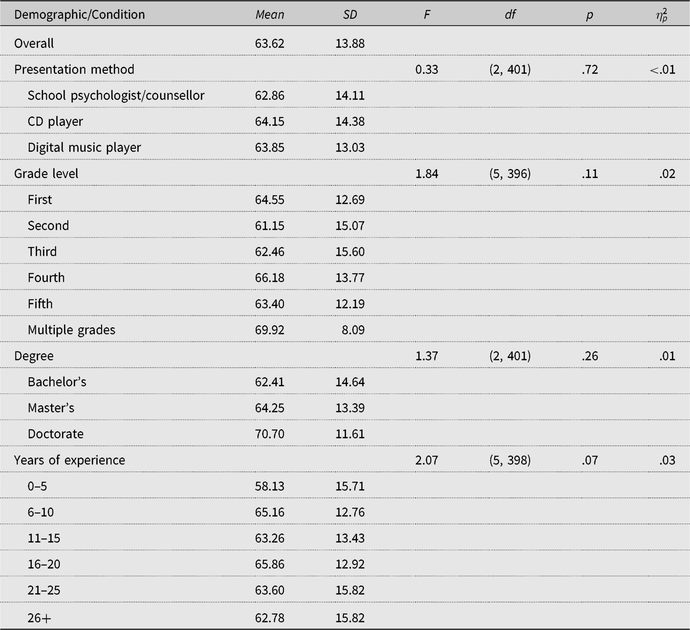
Total IRP-15 scores were used to compute acceptability means and standard deviations for each of the PMR scenarios. Good levels of acceptability were found when PMR involved the school psychologist or counsellor (M – 62.86, SD – 14.11), CD player (M – 64.15, SD – 14.38), and digital music player (M – 63.85, SD – 13.03). Combining the results from all three conditions resulted in a good overall level of teacher acceptability for PMR (M – 63.62, SD – 13.88). An analysis of variance (ANOVA) indicated no statistically significant differences, F(2, 401) – 0.33, p – .72, between the three conditions, with Levene’s test for homogeneity of variances not reaching significance (F – 0.48, p – .62). No statistically significant differences in acceptability for any of the conditions were found based on teacher grade level, degree, or years of experience. Means, standard deviations, and ANOVA results for acceptability of PMR by ANOVA condition can be found in Table 2.
ANOVA Results for Acceptability of PMR

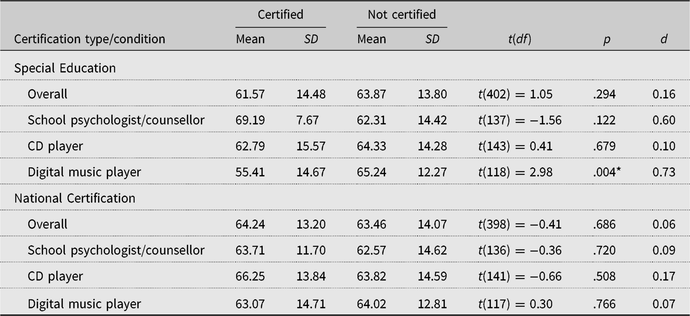
Overall, teachers who were certified to teach special education rated the acceptability of PMR lower (M – 61.57, SD – 14.48) than teachers who were not certified to teach special education (M – 63.87, SD – 13.80), but not to a statistically significant degree, t(402) – 1.05, p – .29. However, teachers who were certified to teach special education rated PMR using a digital music player to be significantly, t(118) – 2.98, p – .004, less acceptable (M – 55.41; SD – 14.67) compared to teachers who were not certified to teach special education (M – 65.24; SD – 12.27). Levene’s test indicated the equal variances assumption was met (F – 0.38, p – .54). Although the lower level of acceptability for PMR using a digital music player by teachers with special education certification did not reach the ‘good’ level of acceptability identified in the current study, it did reach the ‘minimum level’ of acceptability for the scale.
An analysis of demographic differences between teachers with and without special education certification indicated that teachers with special education certification had significantly more, t(402) – −2.90, p – .004, d – 0.44, years of teaching experience (M – 19.22, SD – 9.50) than teachers without special education experience (M – 15.27, SD – 8.51). However, the impact of years of teaching experience on IRP total score was not statistically significant based on years of teaching ranges (as a categorical variable), F(5, 398) – 2.07, p – .07,
 $\eta_p^2 $
– .03, and no significant correlation was found for years of teaching (as a continuous variable) and IRP total score, r – .05, p – .33. To further explore the possibility that years of experience may have been a covariate of special education certification when determining PMR acceptability, analyses of covariance (ANCOVAs) were performed to control for years of experience. The ANCOVAs were not significant for years of experience overall, F(1, 401) – 1.29, p – .26, the school psychologist or counsellor condition, F(1, 136) – 1.42, p – .24, CD player condition, F(1, 142) – 0.30, p – .58, or the digital music player condition, F(1, 117) – 0.10, p – .76. Special education certification in the ANCOVA results remained significant in the digital condition and non-significant in the other conditions. Levene’s test did not reach significance in any of the ANCOVAs. These results indicated that the years of experience variable was not a significant covariate of special education certification in predicting PMR acceptability.
No statistically significant differences between teachers with and without special education certification were found based on degree, χ2(2, N – 404) – 2.35, p – .308), grade, χ2(5, N – 402) – 0.75, p – .980, or possessing national certification, χ2(1, N – 400) – 3.02, p – .082. No statistically significant differences in acceptability for PMR were found based on national certification. Means, standard deviations, and t-test results for acceptability of PMR by certification type can be found in Table 3.
t Test Results for Acceptability of PMR by Certification Type

Note: *Significant at p < .05.
An item analysis of IRP-15 questions showed response means that ranged from 4.01 to 4.49 (4 – slightly agree) on 14 of the 15 questions, indicating good levels of acceptability for all questions. These questions included whether participants believed PMR to be an appropriate and potentially effective way to address the problem, as well as the likelihood of them using it in the classroom and suggesting its use to other teachers. The only question that had a mean lower than 4.01 (M – 3.19, SD – 1.38), which fell nearest to the slightly disagree descriptor, was related to whether PMR was consistent with other interventions the teacher had used in the past.
Discussion
Teachers in the current study reported good levels of acceptability for PMR as an intervention for test anxiety. Acceptability ratings did not significantly vary depending upon whether the intervention script was read by a school psychologist or counsellor or played using a CD-player or digital music player. No statistically significant differences in acceptability ratings for PMR were found based on teachers’ grade level, educational level (as measured by degree), years of experience, or attainment of national certification. Significantly lower levels of acceptability (though still reaching the ‘minimum level of acceptability’ for the scale) for PMR using a digital music player were noted for teachers certified to teach special education compared to those were not certified to teach special education.
Implications for practice
The current state of high-stakes testing in the schools and its consequences have created a critical need for research-based interventions to reduce test anxiety (Larson et al., Reference Larson, El Ramahi, Conn, Estes and Ghibellini2010; Salend, Reference Salend2011; von der Embse et al., Reference von der Embse, Barterian and Segool2013). While further research occurs in relation to the emerging high-stakes testing environment and other potential contributory factors in the development of test anxiety, school psychologists and counsellors need interventions that can address the symptoms students are currently experiencing. When selecting an intervention, school psychologists and counsellors should not only identify one with demonstrated efficacy, but also with good levels of acceptability to reduce potential barriers to implementation, intervention integrity, and positive outcomes. With good levels of teacher acceptability found in the current study and prior effectiveness as a component to interventions that reduce anxiety (Lohaus & Klein-Hessling, Reference Lohaus and Klein-Hessling2003; Rasid & Parish, Reference Rasid and Parish1998; Zaichkowsky & Zaichkowsky, Reference Zaichkowsky and Zaichkowsky1984) and test anxiety (Larson et al., Reference Larson, El Ramahi, Conn, Estes and Ghibellini2010; Putwain et al., Reference Putwain, Chamberlain, Daly and Sadreddini2014) in school-age children, PMR may be a viable school-based intervention for school psychologists and counsellors to recommend for the reduction of test anxiety. As the techniques for engaging in PMR are not specific to U.S. students or schools, PMR may also be option for students experiencing test anxiety in other countries. Based on the current results, classroom implementation could be attempted with school psychologist/counsellor assistance or via recording. In addition to the potential benefit of reduced anxiety and test anxiety in children and students, future studies could explore whether the use of PMR to decrease test anxiety also results in more accurate, and presumably higher, levels of performance on tests.
If elementary students are more likely to experience the physical symptoms of test anxiety, as suggested by Whitaker Sena et al. (Reference Whitaker Sena, Lowe and Lee2007), then PMR may be particularly applicable and beneficial to this group due to the intervention focusing on physiological/physical factors. While PMR has been implemented previously as part of an intervention for test anxiety at the elementary level, both in and out of the classroom (e.g., Larson et al., Reference Larson, El Ramahi, Conn, Estes and Ghibellini2010), the implementation may still require adaptations. For example, Swearer et al. (Reference Swearer, Givens, Frerichs, Gimpel, Peacock, Ervin, Daly and Merrell2010) identifies language and conceptual levels as concerns. School psychologists and counsellors may need to adapt phrasing in the script depending upon the student’s grade level and/or individual language skills. Consideration should also be given to the student’s developmental level and the presence of any physical disabilities or special needs that may necessitate a more personalised approach to the PMR process, such as the use of adaptive devices.
The current results provide school psychologists and counsellors with the knowledge that PMR may be an acceptable intervention to teachers teaching first through fifth grade, but practitioners should always verify the acceptability of any intervention with a specific teacher due to individual differences and potential situation-specific variables. Although good levels of acceptability were found for technology-assisted PMR, there is the possibility that these findings may be setting-, individual-, and/or device-specific. Analyses indicated that teachers certified to teach students in special education rated the use of a digital music player to be significantly less acceptable compared to teachers who were not certified to teach in special education. Although the lower ratings by special education teachers for the digital music player option still met the minimum level of acceptability for the scale, the finding may be pertinent to the setting. Depending upon the individual, the digital music player may introduce a more complicated interface for students with special education needs. As a result, special education teachers may find the interface to be less desirable due to student needs or the increased need for teacher assistance. Due to the current state of technology moving toward digital devices, school psychologists and counsellors will need to be aware of these concerns, and future studies may want to explore this dynamic of student needs, setting, and device-specificity.
Limitations of the study
Limitations of the current study were specific to the population surveyed and the presentation format of the scenarios. The current study population was limited to teachers from the United States. Although good levels of acceptability for PMR were found and the steps for PMR are not specific to the U.S. population, this appears to be the first study on teacher acceptability of PMR for test anxiety. Following the caution by Nyroos et al. (Reference Nyroos, Korhonen, Linnanmäki and Svens-Liavåg2012) on generalising test anxiety results across countries due to the possibility of cultural or social influences, teacher acceptability levels of PMR for test anxiety should be examined further internationally before generalising the outcomes of the current study. A second limitation of the sample population is that participants were randomly selected by Market Data Retrieval from their database. As a result, possible participants were limited to teachers listed in the database. To supplement this sampling method, future studies may consider including participants from state teacher registries and/or professional organisations, as well as students and parents, to gain multiple perspectives. With the possibility of school psychologists or counsellors being involved in the implementation of PMR in the classroom to address test anxiety, paired acceptability ratings should be obtained from these professionals and teachers. At the same time, availability of the school psychologist or counsellor to implement such an intervention could be assessed to identify any potential impact on acceptability ratings. The third limitation related to the population is the range of grade levels sampled. The logistics of implementing an intervention at the elementary level can be significantly easier than at the secondary level. Factors such as classroom fit, time constraints, and individual (vs. classwide) intervention delivery may impact on secondary level teacher acceptability for an intervention (State, Harrison, Kern, & Lewis, Reference State, Harrison, Kern and Lewis2017) and should be studied further with regard to PMR implementation. The final limitation to the current study is the analog nature of the scenarios. Due to the study packets being mailed to participants, scenarios were presented using a paper-based vignette format, which provides less detail than a case study and fewer visual cues than a video. Future studies might consider using a more detailed case study that includes assessment data and/or providing an internet-based video of a mock student’s test anxiety symptoms and related behaviour.
Summary
PMR is a research-supported intervention for the reduction of anxiety and has been successfully implemented in schools for the reduction of test anxiety (Larson et al., Reference Larson, El Ramahi, Conn, Estes and Ghibellini2010; Putwain et al., Reference Putwain, Chamberlain, Daly and Sadreddini2014). Teachers in the current study reported good levels of acceptability for PMR as an intervention for the reduction of test anxiety in the classroom. With good levels of acceptability, the potential for PMR to be implemented increases, as does the potential for positive outcomes (i.e., Witt & Elliott, Reference Witt, Elliott and Kratochwill1985). In addition, the levels of acceptability for PMR found in this study did not vary based on the use of technology, which should allow for equal opportunities for implementation in schools with and without technology resources.