1. Introduction
The extraction of palaeoclimate information from the sediment record is a complex task. The sedimentary environment of perennial lakes in balanced-filled and underfilled basins (Carroll & Bohacs, Reference Carroll and Bohacs1999) can be sufficiently stable to produce continuous climate records, but the resulting sediment records reflect an interplay between climate, tectonics and autocyclic processes. In sediments that contain detrital components, climatically driven transport routes are perhaps the most important mechanisms that record palaeoenvironmental changes such as precipitation (Robert, Reference Robert2004). The incorporation of wind-transported dust, changes in fluvial transport and the precipitation-controlled ratio between physical erosion and chemical weathering in the sediment source areas are examples of these mechanisms that have been identified in studies of Pleistocene climate dynamics. In studies of marine and lacustrine sedimentary successions of a sufficient duration (≈ 104 to 105 ka or more) and resolution (≈ 100 ka or better), easily accessible proxies for sediment composition, particularly those related to the ratio of autochthonous (organic) components to detritus or changes in the detrital grain size, are the most common targets of palaeoclimate characterization. If these proxies exhibit variations that are attributable to orbital forcing (as verified by frequency analysis), they are attributed to climate dynamics and are often used to establish or tune the age model. This approach has also been successfully used in studies of continental European Miocene sediment sequences (Abels et al. Reference Abels, Abdul Aziz, Calvo and Tuenter2009; Hohenegger et al. Reference Hohenegger, Ćorić, Khatun, Pervesler, Rögl, Rupp, Selge, Uchman and Wagreich2009; Mandic et al. Reference Mandic, de Leeuw, Vukovic, Krijgsman, Harzhauser and Kuiper2011; Paulissen & Luthi, Reference Paulissen and Luthi2011).
This approach has not been accepted without criticism. In the sedimentary records of actively subsiding basins, the climate, tectonics (palaeogeography) and autocyclic processes may overlap (Meléndez et al. Reference Meléndez, Liesa, Soria and Meléndez2009; Soria et al. Reference Soria, Muñoz, Liesa, Luzón, Meléndez and Meléndez2012). Tanner (Reference Tanner and Lucas2010) recently reviewed the results of cyclostratigraphy in Triassic sedimentary sequences that exhibited such overlaps and explicitly addressed several discrepancies in several seminal and well-cited studies. A critical discussion of the identification of orbital cycles in the sedimentary fill of the Miocene Terruel Graben, Spain can be found in Alonso-Zarza et al. (Reference Alonso-Zarza, Melendez, Martin-Garcia, Herrero and Martin-Perez2012). Lakes are generally more sensitive to tectonic activity than some other sediment archives. While ‘normal’ (not event-like) climate changes are expected to exhibit some kind of regular periodicity (particularly those driven by orbital forcing), tectonics is assumed to cause sharp, unidirectional, single or irregularly spaced events that are superimposed on the climate record (Abels et al. Reference Abels, Abdul Aziz, Calvo and Tuenter2009; Meléndez et al. Reference Meléndez, Liesa, Soria and Meléndez2009; Hohenegger et al. Reference Hohenegger, Ćorić, Khatun, Pervesler, Rögl, Rupp, Selge, Uchman and Wagreich2009; Soria et al. Reference Soria, Muñoz, Liesa, Luzón, Meléndez and Meléndez2012). The attribution of regular periodicity in sediments to orbital forcing is nearly a paradigm in marine environments and areas that are influenced by monsoons or glaciers, but the effect of insolation changes in other continental environments is less clear. One of the main hindrances is most likely the less stable nature of terrestrial sedimentary environments, which often contain more hiatuses and more relevant autocyclic processes than marine environments.
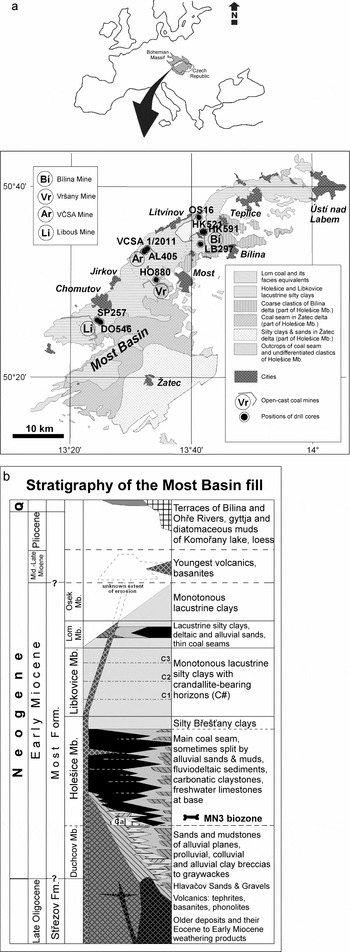
An approximately 300 m thick sequence of Burdigalian age (Early Miocene) swamp, fluviodeltaic and lacustrine sediments are present in the Most Basin in the northwestern part of the Czech Republic (Fig. 1). The sequence was deposited under conditions of tectonic subsidence within the Ohře (Eger) Graben (Rajchl et al. Reference Rajchl, Uličný, Grygar and Mach2009). A stratigraphic correlation, geochemical zonation and stratigraphic definition of the clastic sediments that lie above the main coal seam (upper part of the Holešice Member and the entire Libkovice Member) were recently proposed by Matys Grygar & Mach (Reference Matys Grygar and Mach2013). The thickest member of the Miocene fill, the monotonous mudstones of the Libkovice Mbr, was deposited in a perennial basin-wide lake. The sediments are macrofossil-barren and contain few visual features (Matys Grygar & Mach, Reference Matys Grygar and Mach2013). Certain geochemical characteristics of the sediments, on the other hand, have cyclic characteristics, which allowed for a frequency analysis to be performed. The aims of this study were to combine the results of geochemical, frequency and palaeomagnetic analyses to identify and interpret the orbitally driven changes in the sediment record, establish an age model for the sequence, compare the development of the Most Basin with the global and regional records of climate change, and contribute to our understanding of orbital forcing in a European continental sedimentary environment.
(a) Map of the Most Basin, Czech Republic, with position of cores marked. (b) Local stratigraphic scheme of the Most Basin.

2. Study area and methods
2.a. Geological settings and palaeogeography
The Most Basin (Fig. 1) is part of the Ohře (Eger) Graben (Rajchl et al. Reference Rajchl, Uličný, Grygar and Mach2009) and, in a broader context, is part of the European Cenozoic Rift System. The Ohře Rift is a half-graben whose main faults run in a SSW–NNE direction. The evolution of the Most Basin has been reconstructed from detailed lithostratigraphic correlations and geochemical analyses (Mach, Reference Mach, Hoppe, Rohling and Schuth2010; Matys Grygar & Mach, Reference Matys Grygar and Mach2013 and references therein), detailed fault and architectural analysis (Rajchl et al. Reference Rajchl, Uličný, Grygar and Mach2009), and palaeogeographic and palaeobotanic research (Kovar-Eder, Kvaček & Meller, Reference Kovar-Eder, Kvaček and Meller2001; Kvaček et al. Reference Kvaček, Böhme, Dvořík, Konzalová, Mach, Prokop and Rajchl2004 and references therein). In the pre-rift period, the basin floor was affected mainly by Oligocene volcanism and subsequent weathering, erosion and sedimentation in fluvial systems, local lakes and swamps (the Duchcov Member). In this period, the Ohře Graben was crossed by a river that entered the basin near Žatec and exited it near Jirkov. In late Oligocene and Early Miocene time, that river brought sediments with heavy mineral assemblages characteristic of the Bohemian Massif through the Ohře Graben and then further to paralic Tertiary basins in central Germany (Mach, Reference Mach, Hoppe, Rohling and Schuth2010 and references therein). Sediments from that period form relatively thin deposits in the Ohře Graben and are poorly correlated.
The basin floor was later covered by an extensive peat swamp. The preserved sediment fill includes the main coal seam and its lateral equivalents, fluvial to deltaic clastic sediments and finer sediments of local lakes (the Holešice Mbr). The Žatec River was still the main river that flowed through the basin to the NW. At the top of the Holešice Mbr, a second deltaic body was formed near Bílina (Fig. 1a). The Bílina River was either the Žatec River after extensive avulsion or an independent water course. Both of these rivers mixed siliciclastic sediments derived from the Palaeozoic and Cretaceous sediments of the Bohemian Massif with those from Oligocene volcanic rocks (Matys Grygar & Mach, Reference Matys Grygar and Mach2013); these deposits cannot be distinguished. Local streams flowed in an axial direction along the main fault system of the rift and brought weathering products of the Oligocene and lowest Miocene volcaniclastic sediments and weathered metamorphic rocks from the Krušné Hory block before it was uplifted to form the present-day Krušné Hory mountains (Mach, Reference Mach, Hoppe, Rohling and Schuth2010).
The thickest preserved Miocene lithofacies unit in the Most Basin is composed of mudstones that were subsequently deposited in a basin-wide lake with a total area of more than 1000 km2 (Libkovice Mbr). The formal stratigraphy of the Most Basin above the main (Holešice) coal seam was recently proposed (Matys Grygar & Mach, Reference Matys Grygar and Mach2013; Figs 1, 2) based on geochemical signatures because a conventional lithostratigraphy was insufficient.
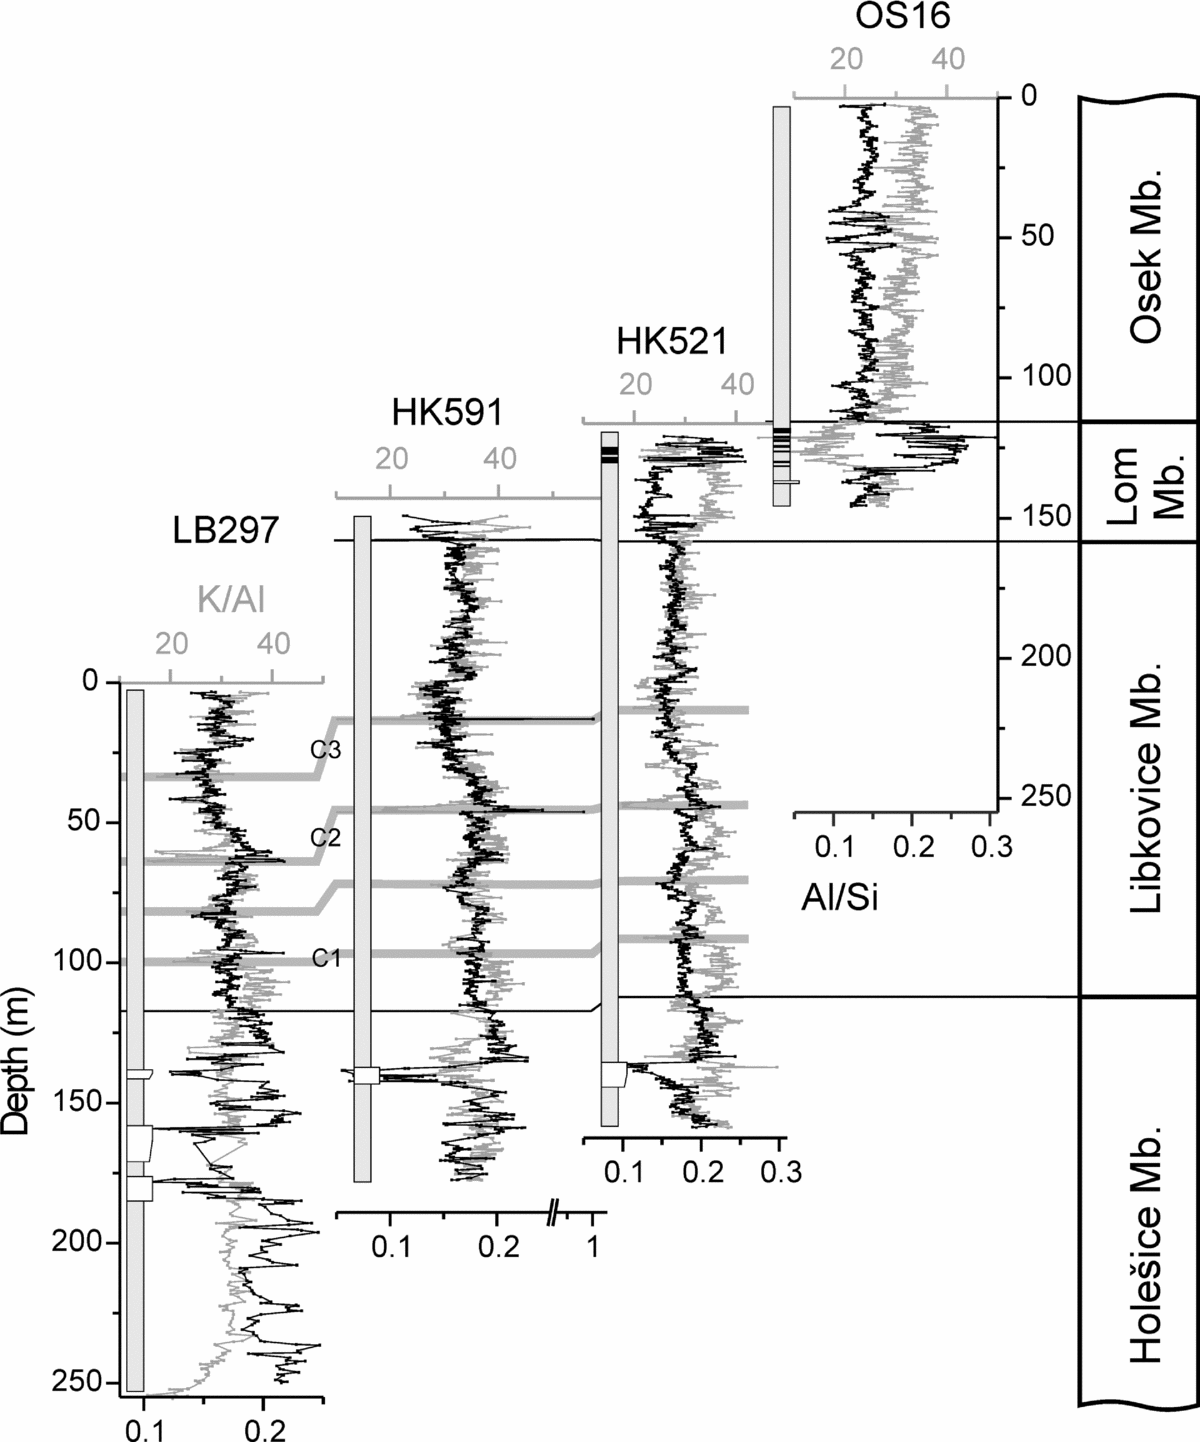
Composite log of K/Al (grey) and Al/Si (black) from cores LB297, HK521, HK591 and OS16 and the assignment to the local stratigraphic scheme adopted from Matys Grygar & Mach (Reference Matys Grygar and Mach2013). Grey highlights are chemical heterogeneities in the mudstones of the Libkovice Mbr allowing basin-wide correlation; C1 to C3 are crandallite-bearing horizons. Lithological column (left in each of the four panels): white – sand; grey – mudstones (silty clay or clayey silt); black – coal. Depth axis in HK521 and HK591 (not shown) has the same scale (0–250 m) as in the other cores (LB297 and OS16).

The overlying Lom Member has a variable lithology that resembles the lateral facies variability of the Holešice Mbr. It includes coarser clastic sediments, lacustrine muds and thin coal seams. There are no salt accumulations in these deposits and no other signs of the exposure of the lake floor to air. The uppermost preserved Miocene sediments are mudstones from a renewed water body (the Osek Mbr). The Lom and Osek Mbrs are poorly documented owing to a limited area of preservation. The period of basin subsidence was followed by uplift and erosion of part of the Libkovice Mbr in the southwestern part of the basin and younger sediments in a large part of the basin (Rajchl et al. Reference Rajchl, Uličný, Grygar and Mach2009).
2.b. Age constraints
Faunal localities with small mammals in the basal strata of the Holešice Mbr have been assigned to the MN3 Biozone (Fejfar, Reference Fejfar, Lindsay, Fahlbusch and Mein1988; Fejfar & Kvaček, Reference Fejfar and Kvaček1993; Fejfar, Dvorák & Kadlecová, Reference Fejfar, Dvorák and Kadlecová2003); the recently revised dates of the MN3 Biozone are from c. 20.1 Ma to 16.8–17 Ma (chrons C6n to C5Cr; Larrasoaña, Murelaga & Garces, Reference Larrasoaña, Murelaga and Garces2006) or ~19.5 to 17.2 Ma (the timescale of Gradstein et al. Reference Gradstein, Ogg, Schmitz and Ogg2012, p. 938). Kovar-Eder, Kvaček & Meller (Reference Kovar-Eder, Kvaček and Meller2001), Kvaček & Teodoridis (Reference Kvaček and Teodoridis2007) and Teodoridis (Reference Teodoridis2010) evaluated palaeoflora from several localities in the Holešice and Libkovice Mbrs and coeval Central European basins and concluded that these two members are of Burdigalian age (20.43–15.97 Ma; Gradstein et al. Reference Gradstein, Ogg, Schmitz and Ogg2012).
2.c. Locations of cores and their stratigraphic assignment
The coring, visual examination of the cored materials and sampling for laboratory analyses were performed by the North Bohemian Coal Mines, (SD, a.s.) during coal prospecting. The locations of the cores are shown in Figure 1, and their stratigraphic assignment according to the methodology of Matys Grygar & Mach (Reference Matys Grygar and Mach2013) is shown in Figure 2.
The sediments of the Bílina delta in the upper part of the Holešice Mbr were encountered by core LB297 in the area of the Bílina open-cast mine. The final stage of the stepwise extension of the local lake fed by the Bílina River is also documented in the lowermost part of the HK521 and HK591 cores. The basin-wide Libkovice lake deposits form the most substantial parts of the LB297, HK521 and HK591 cores (Matys Grygar & Mach, Reference Matys Grygar and Mach2013). These deposits are the main focus of this study. The Lom Mbr was encountered by the HK521 and OS16 cores and the Osek Mbr was only found in core OS16.
2.d. Sampling and analysis of sediments
Three to five samples per metre were taken from the cores and subjected to cation-exchange capacity (CEC) analysis (Meier & Kahr, Reference Meier and Kahr1999; Grygar et al. Reference Grygar, Kadlec, Žigová, Mihaljevič, Nekutová, Lojka and Světlík2009) and X-ray fluorescence spectroscopy (XRF). The XRF spectra were acquired using a MiniPAL4 spectrometer (PANalytical, Almelo, The Netherlands) with a Peltier-cooled Si detector and a 9 W Rh tube. The cores were correlated using a stratigraphic scheme based on the CEC and element analyses by XRF (Matys Grygar & Mach, Reference Matys Grygar and Mach2013). Al/Si is a proxy for sediment coarseness (ratio of usually finer aluminosilicates to usually coarser quartz; Peng & Guo, Reference Peng and Guo2001; Guo et al. Reference Guo, Peng, Hao, Biscaye, An and Liu2004; Grygar et al. Reference Grygar, Světlík, Lisá, Koptíková, Bajer, Wray, Ettler, Mihaljevič, Nováková, Koubová, Novák, Máčka and Smetana2010). K/Al or K/Ti ratios are proxies for illite (clay mica) percentage in aluminosilicate assemblages.
One sample per metre was collected for palaeomagnetic analyses within one to two weeks after the coring. The specimens were sampled in plastic containers and the direction towards the bottom was marked. The direction of the remanent magnetization was measured by a Type 755 4K SRM superconducting rock magnetometer (William S. Goree, Inc., Sand City, CA). Thermal demagnetization was not applicable because the samples were not sufficiently consolidated (mechanically consistent) to be exposed to heating (they are low in carbonate and weakly diagenetically affected; Matys Grygar & Mach, Reference Matys Grygar and Mach2013). Instead alternating field (AF) demagnetization was performed in 10–12 second steps up to a field of 100 mT for pilot samples. The results showed that demagnetization with a peak field of 60 mT is enough to find the primary component. The results were evaluated using the Remasoft software package (Chadima & Hrouda, Reference Chadima and Hrouda2006), and individual components of the magnetization were determined by conventional principal component analysis (Kirschvink, Reference Kirschvink1980).
To evaluate the magnetomineralogy of the sediments, the isothermal remanent magnetization (IRM) was acquired in 18 steps in the field range between 10 and 1500 mT. A MMPM10 pulse magnetizer was used for magnetization and a JR5a rotating magnetometer was employed for the measurement. The diverse results of the acquisition of the IRM on pilot samples proved a demand for S-ratio study on all samples. The S-ratio was calculated using the formula
S = −SIRM/backfield IRM
according to Heslop (Reference Heslop2009). A backfield of 100 mT was chosen owing to the low magnetic coercivity of most samples.
2.e. Spectral analyses and propositions of age models
2.e.1. Detection of sedimentary cycles
Spectral analysis and orbital tuning were performed for the depth interval from 180 to 30 m in the HK591 core after removal of heterogeneities related to crandallite-bearing horizons (more details are below). The series were linearly interpolated with a 0.01 m sample step and the long-term trends were subtracted from the series by applying a best-fit linear regression. Spectral analyses were performed using the multi-taper method with three 2π-tapers (2π-MTM; Thomson, Reference Thomson1982, Reference Thomson1990). Confidence levels were calculated at 90% (90% CL), 95% (95% CL) and 99% (99% CL) by smoothing the spectrum at one fifth of the Nyquist frequency and linearly fitting a red-noise model to this smoothed spectrum (Mann & Lees, Reference Mann and Lees1996). Amplitude spectrograms were performed in addition to the 2π-MTM analyses to follow the evolution of the sedimentary periods throughout the analysed series (e.g. Martinez et al. Reference Martinez, Deconinck, Pellenard, Reboulet and Riquier2013). The method consists of a series of fast Fourier transforms (FFT) on sliding windows of analysis. Prior to each FFT, the analysed part of the series is weighted using a Slepian sequence. A short window width allows the smallest periods to be precisely followed but the frequency resolution is lower. Thus, two amplitude spectrograms were performed: one using 60 m wide windows, adapted to the eccentricity and obliquity bands, and one using 40 m wide windows, for the obliquity and precession bands. For each analysed window, the procedure outputs the power spectrum for the middle of the analysed window, and hence the amplitude spectrogram starts in the middle of the first analysed window and ends in the middle of the last analysed window. Prior to the performance of the 60 m amplitude spectrogram, the 405 ka eccentricity band was treated as a long-term trend and removed from the series by low-pass filtering, while prior to the 40 m amplitude spectrogram, the whole eccentricity band was removed by low-pass filtering.
2.e.2. Attribution to orbital periods and orbital tuning
The interpretation of possible orbital signatures was performed using the average spectral misfit (ASM) method of Meyers & Sageman (Reference Meyers and Sageman2007). This method is suitable for data series with poor time constraints because it makes it possible to rigorously evaluate the null hypothesis of orbital control over a wide range of possible sedimentation rates. The method consists of calibrating a series to average sedimentation rates for the series. The sedimentary frequencies observed in the spectral analyses are thus converted from cycles/metre to cycles/ka and are compared to orbital frequencies. The most suitable sedimentation rate for the series is the one for which the misfit between the orbital frequencies and the sedimentary frequencies is minimal (see Meyers & Sageman, Reference Meyers and Sageman2007 for further details). In this study, the ASM analysis employed 100000 simulations over sedimentation rates between 1 cm/ka and 30 cm/ka at a resolution of 0.2 cm/ka. This study uses a slightly modified version of the ASM method in which the reference orbital parameters are set following Laskar et al. (Reference Laskar, Robutel, Joutel, Gastineau, Correia and Levrard2004, Reference Laskar, Fienga, Gastineau and Manche2011).
Then, the band of eccentricity was identified by applying a Taner low-pass filter (Taner, Reference Taner2000) while bands of obliquity and precession were identified by applying Taner band-pass filters. The results of the filtering procedures were correlated to the La2004 astronomical solution (Laskar et al. Reference Laskar, Robutel, Joutel, Gastineau, Correia and Levrard2004) to provide a refined age model for this time interval.
3. Results
3.a. Geochemistry of the Most Fm above the coal seam
A composite record of the Holešice Mbr (above the main coal seam) and the Libkovice, Lom and Osek Mbrs from the four cores in this study and their assignment to the local stratigraphy are shown in Figure 2. The Holešice clastic sediments above the main coal seam are lithologically variable and include laminated mudstones from local lakes, clastic sediments that occasionally contain carbonate concretions, and laterally unstable carbonate-rich laminae; in the Bílina area, the clastic sediments also contain coarser silty to sandy intercalations of the Bílina delta deposits. These coarser clastic sediments are indicated by sharp minima in the Al/Si ratios (Figs 2, 3). A layer with an increasing trend in the K/Al (or K/Ti) ratio is present in the lowermost part of the Holešice clastic sediments immediately above the main coal seam (Fig. 2). The overlying massive, monotonous mudstones (the Libkovice Mbr) are offshore lacustrine sediments that exhibit variations in their Al/Si and K/Al ratios in only limited ranges (Fig. 2). The only abrupt heterogeneities in the Libkovice Mbr are the horizons that are indicated by thick grey lines in Figures 2 to 4; they have sharp K/Al minima and generally have sharp Al/Si maxima. Three of these heterogeneities have crandallite-bearing horizons (CBHs) at their bases (denoted C1 to C3 in Figs 2 to 4). Crandallite is a calcium-aluminium phosphate (Dill, Reference Dill2001). In the Libkovice mudstones, some of the Ca in the crandallite is isomorphically substituted by Sr and Ba, and hence the crandallite has the formula (Ca,Sr,Ba)Al3(PO4)2(OH)5·H2O. These heterogeneities (horizons) can be used to correlate the cores shown in Figure 1, which was demonstrated by Matys Grygar & Mach (Reference Matys Grygar and Mach2013).
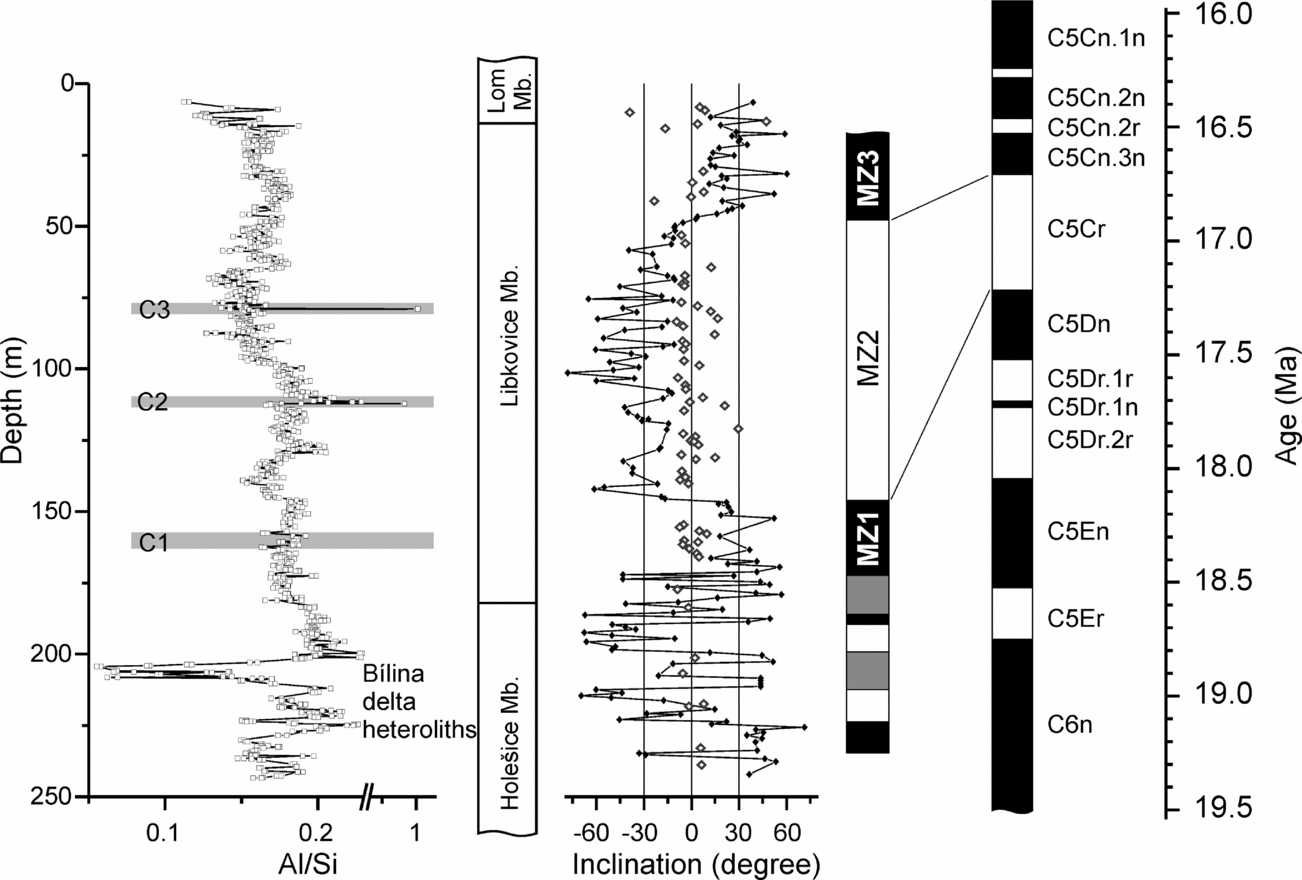
Proxy analysis of sediment coarseness (Al/Si), local stratigraphy according to Matys Grygar & Mach (Reference Matys Grygar and Mach2013), results of magnetic polarity analysis in core HK591 and a reference magnetic curve ATNTS12 (Gradstein et al. Reference Gradstein, Ogg, Schmitz and Ogg2012). Points of polarity considered as uncertain (see Section 3.c for explanation) are outlined in grey; points used to construct magnetozones are solid black connected by a line.

The CBHs are 1–10 cm thick layers that can be recognized by their lighter colour in outcrops and drill cores after a few weeks (or longer) of exposure to ambient conditions. The CBHs have extremely high Al/Si ratios owing to the crandallite and minor kaolinite, which are the main Al-bearing minerals, while quartz is nearly absent. Two of three CBHs were found during the description and sampling of core HK591. The K/Al (or K/Ti) minima above the CBHs can always be identified in XRF logs even though much thinner CBHs are generally overlooked during the core description and sampling. According to Dill (Reference Dill2001), crandallite may be formed by crystallization from phosphates, alkaline earth metal ions and reactive Al oxides or silicates, such as kaolinite, mainly in a weakly acidic environment (Dill et al. Reference Dill, Dohrmann, Kaufhold and Weber2011). We do not have a definitive explanation for the formation of the CBHs; a discussion of this topic can be found in Matys Grygar & Mach (Reference Matys Grygar and Mach2013).
The Libkovice Mbr is overlain by the Lom Mbr. The boundary is defined by a decreasing Al/Si ratio and an increasing K/Al ratio (Fig. 2), i.e. sediment coarsening and an increased amount of mica. This change is followed by sediment fining and thin layers of Lom coal (several thin strata between the depths of 14.4 and 8.25 m in core HK521 and between 131.4 and 117.5 m in core OS16).
3.b. Repetitive changes in geochemistry in the Libkovice Mbr as expressed in core HK591
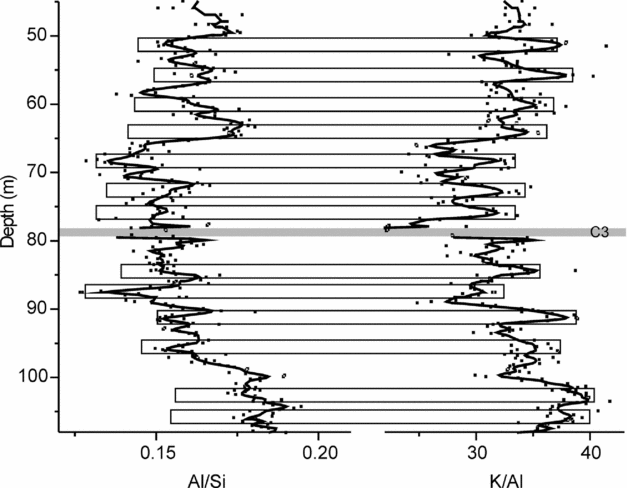
A detailed view of the K/Al and Al/Si logs in core HK591 for the depth interval 40–115 m, i.e. the upper half of the Libkovice mudstones, is shown in Figure 4. That interval was chosen because the element ratios there have very distinct cyclic variations. The figure clearly shows the different recording mechanisms behind the Al/Si and K/Al logs. The CBH-associated heterogeneities discussed in Section 3.a (highlighted in grey in Figs 2 and 4) were removed. Repetitive (apparently cyclic) variations in both element ratios with depth are clearly visible in both logs. This observation is consistent with previously identified statistically significant K/Al and Sr cycles in cores SP257, LB297 and HK521 (unpub. results). The K/Ti dataset from the interval 28–180 m (the Libkovice Mbr) was analysed for a potential signal using the MTM power spectral estimate associated with an independent test of statistical significance (Thomson, Reference Thomson1982).
Phase shift in K/Al and Al/Si logs (5 pt moving averages) showing lack of simple interrelation between these two parameters. Data points from C3-associated heterogeneity were removed.

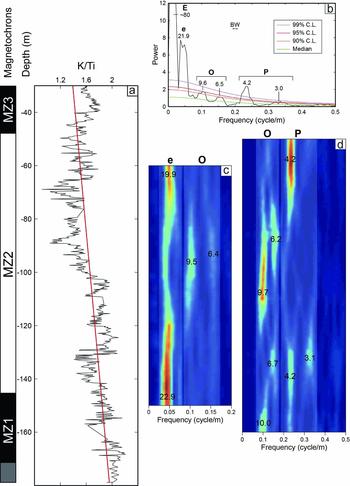
The 2π-MTM spectrum and weighted amplitude spectrograms of the K/Ti series indicate significant periods up to the 99% CL at ~80 m, 21.9 m and 4.2 m (Fig. 5). Owing to the spectral resolution, the ~80 m is rather given as a guide. Other cycles at 9.6 m and 6.5 m are up to the 95% CL (Fig. 5). On the amplitude spectrograms, the ~20 m band and the ~4 m band dominantly govern the K/Ti ratio in the depth intervals from 180 to 120 m and 80 to 30 m (Fig. 5c, d) while the 9 to 6 m band is mainly expressed in the depth interval from 120 to 80 m (Fig. 5d).
Spectral analyses of the K/Ti ratio. (a) K/Ti ratio (in black) and best-fit linear trend (in red). (b) 2π-MTM spectrum of the detrended K/Ti series. (c) 40 m amplitude spectrogram of the detrended K/Ti after removing the 405 ka eccentricity band by applying a Taner low-pass filter (frequency cut: 2.441 × 10⁻² cycle m−1). (d) 60 m amplitude spectrogram of the detrended K/Ti after removing the eccentricity band by applying a Taner low-pass filter (frequency cut: 7.324 × 10⁻² cycle m−1).

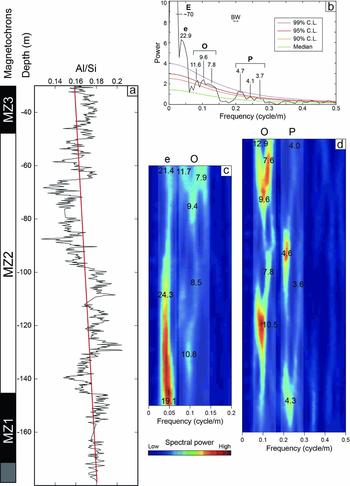
The 2π-MTM spectrum and weighted amplitude spectrograms of the Al/Si series indicate significant periods up to the 99% CL at ~70 m, 22.9 m and 4.3 m (Fig. 6). Significant periods up to the 95% CL range from 11.6 to 7.8 m and from 4.7 to 3.7 m. Amplitude spectrograms show a strong power of the ~20 m band throughout the series (Fig. 6c). The 11 to 7 m band has the strongest amplitudes at depths around 120 m and 60 m while the 4 to 3 m band has the strongest amplitudes around 150 m and 90 m (Fig. 6d).
Spectral analyses of the Al/Si ratio. (a) Al/Si ratio (in black) and best-fit linear trend (in red). (b) 2π-MTM spectrum of the detrended Al/Si series. (c) 40 m amplitude spectrogram of the detrended Al/Si after removing the 405 ka eccentricity band by applying a Taner low-pass filter (frequency cut: 3.052 × 10⁻² cycle m−1). (d) 60 m amplitude spectrogram of the detrended Al/Si after removing the eccentricity band by applying a Taner low-pass filter (frequency cut: 5.493 × 10⁻² cycle m−1).

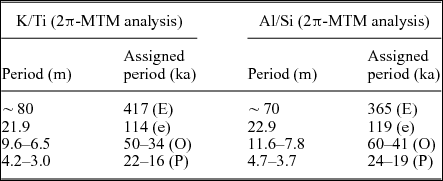
The significant frequencies (exceeding 95% F-test probability) were used in the ASM simulation. Subcritical significance of the null hypothesis of orbital forcing was obtained for a sedimentation rate of 19.2 cm/ka (Table 1). The 70 to 80 m cycles are thus related to the 405 ka eccentricity cycle, the ~20 m cycles are related to the 100 ka eccentricity, the 9 to 6 m cycles are related to obliquity, and the 4 to 3 m cycles are related to precession (Table 1).
List of periods used in the average spectral misfit simulations

Time-domain periods were calculated from a sedimentation rate of 19.2 cm/ka that passed the critical significance level in the ASM simulations. E – 405 ka eccentricity; e – 100 ka eccentricity; O – obliquity; P – precession.
3.c. Magnetic polarity analysis
The magnetomineralogy of the sediments was tested by IRM acquisition and S-ratio. The sediments from the lowermost interval (243.1–172.6 m) had a medium coercivity (S = 0.68±0.04) typical for mixtures of magnetite/maghaemite and haematite. The prevailing part of the core (145.5–20.35 m) has sediments with a very high coercivity (S = 0.92±0.02) typical for a prevailing contribution of magnetite/maghaemite. The interval 172.6–146.8 m had a coercivity varying between ~0.7 and 0.95 showing a variable proportion of magnetite/maghaemite to haematite.
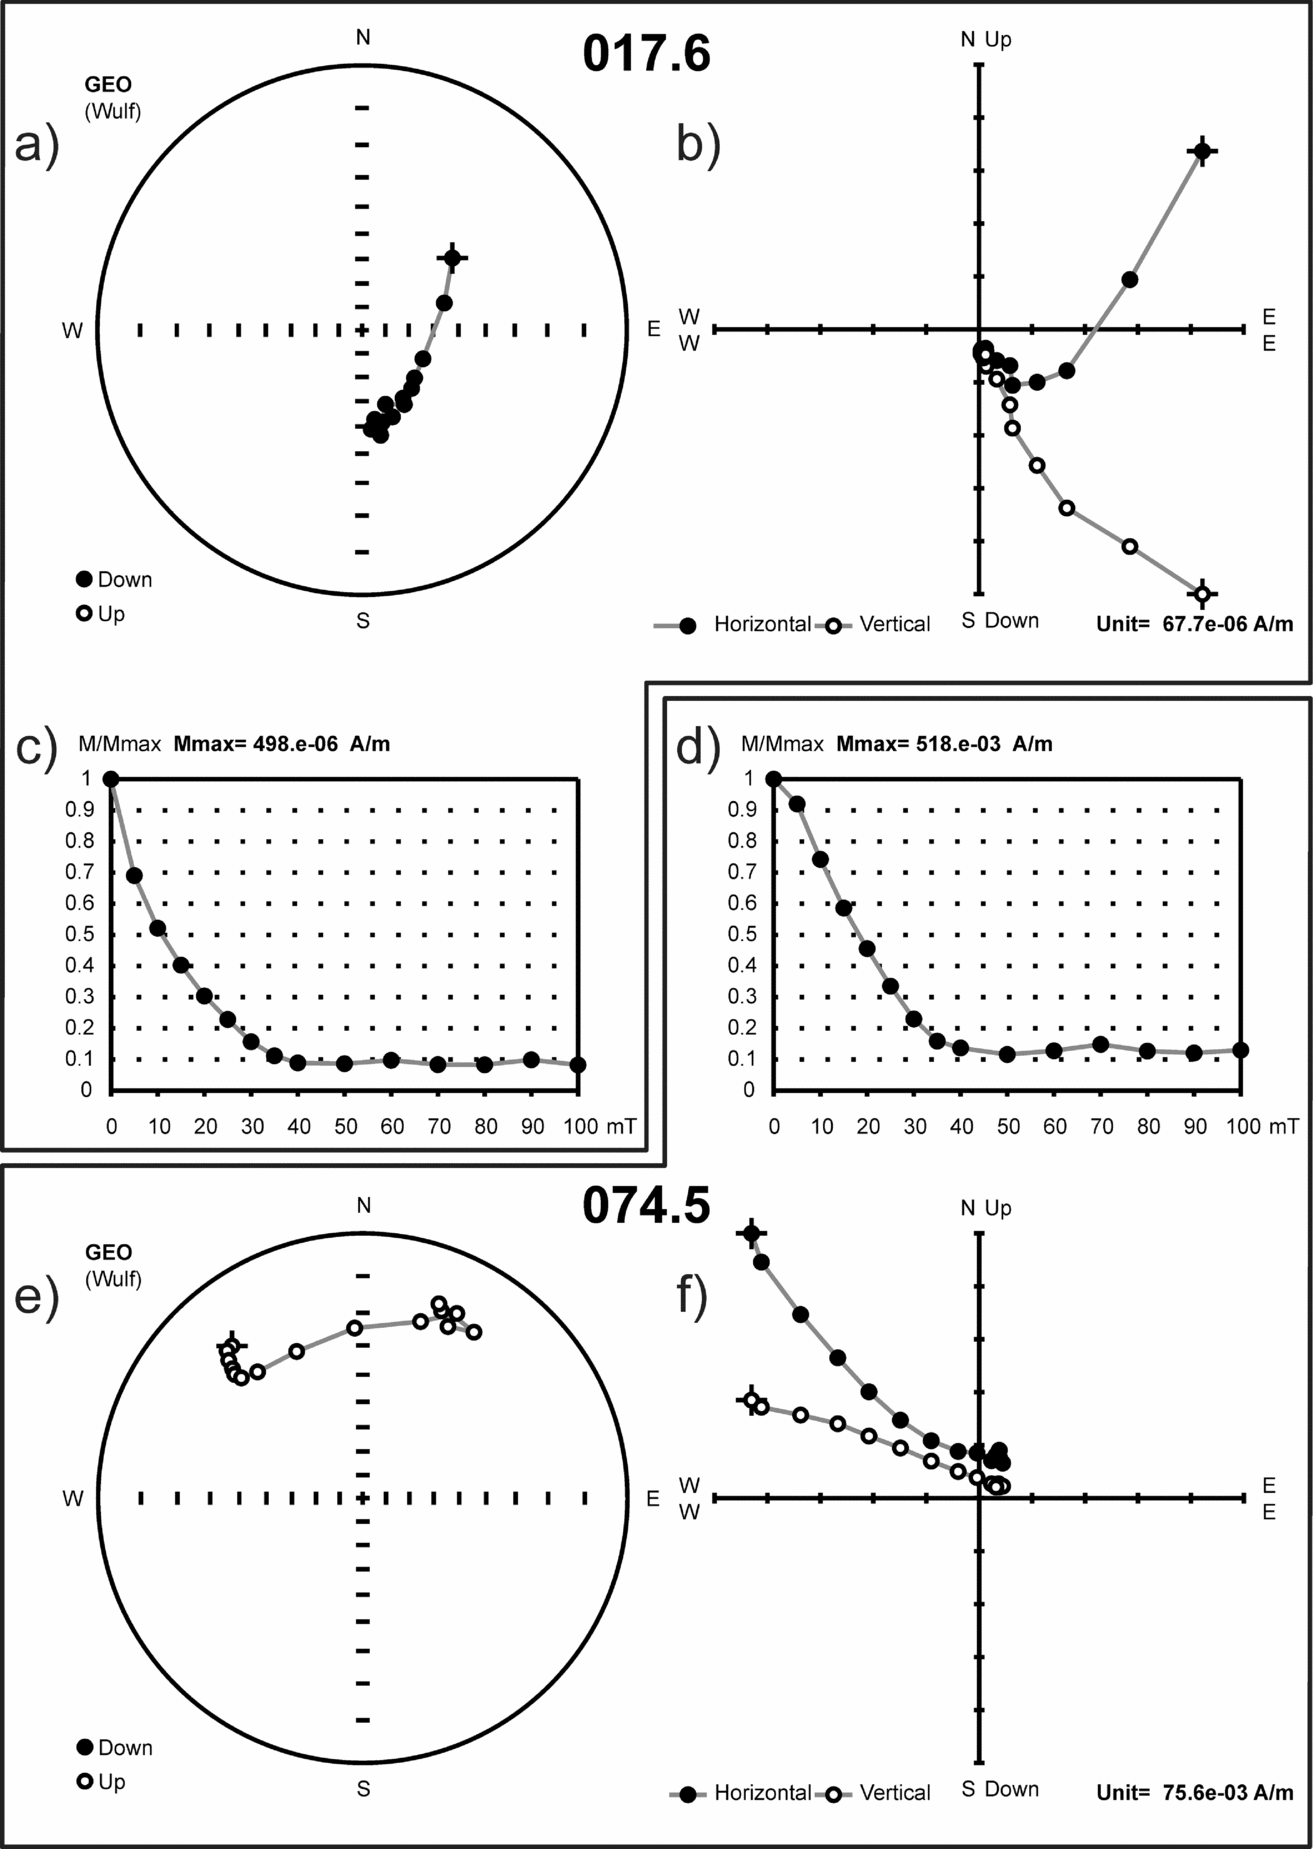
Representative AF demagnetization curves are shown in Figure 7 for one interpreted normal and one interpreted inverse polarities. The results of the magnetic polarity analysis of core HK591 are shown in Figure 3 with the orbitally tuned Geomagnetic Polarity Timescale ATNTS2012 (Gradstein et al. Reference Gradstein, Ogg, Schmitz and Ogg2012). The following data points were plotted in Figure 3 as empty grey symbols and omitted in the interpretation of magnetozones: (1) all points with absolute values of inclination less than 10° except for those at the boundary between magnetozones and (2) all individual points that had opposite signs of inclination from their two nearest and next-nearest neighbours. The polarities in core HK591 can then be unequivocally identified in nearly the entire Libkovice Mbr with the exception of the lowermost 10 m. A complete inverse zone, denoted MZ2 in Figure 3, was found in the depth interval from 146 to 48 m. Accordingly, three polarity zones were interpreted in the Libkovice Mbr and denoted MZ1 to MZ3.
Representative AF demagnetization curves of pilot samples with normal (a, b, c) and reverse (d, e, f) polarity, the samples are oriented along the z-axis. Graphs (a) and (e) represent stereographic projections; (b) and (f) are Zijderveld plots; (c) and (d) show normalized intensity of remanent magnetization.

In the Holešice Mbr, the recovered magnetic polarities are more scattered and could not be interpreted as magnetozones. As follows from the reconstruction of the Most Basin evolution (Rajchl et al. Reference Rajchl, Uličný, Grygar and Mach2009; Matys Grygar et al. Reference Matys Grygar and Mach2013), the sedimentation of the Holešice Mbr was spatially and temporally much more variable because the tectonic faults in that period were immature (short) and produced a mosaic of environments with limited lateral continuity. The stratigraphic continuity of the Holešice Mbr is thus uncertain. The magnetic polarity analysis allows for only a qualitative estimate that there is a substantially thinner (and most likely shorter) normal zone below MZ2 (MZ1, Fig. 3).
4. Discussion
4.a. Age model for the Libkovice Mbr
A complete sediment record and reliable age constraints are essential to evaluating realistic associations between sedimentary features and Milankovitch cycles (Tanner, Reference Tanner and Lucas2010). The Libkovice Mbr can be correlated in all of the cores depicted in Figure 1, including core HK591. The correlations for the cores in the Bílina area are shown in Figure 2. The correlation with other cores from the Most Basin was described by Matys Grygar & Mach (Reference Matys Grygar and Mach2013). The correlations make it reasonable to assume that there are no significant site-specific hiatuses in the analysed strata. There are no lithofacies changes in the Libkovice Mbr, and hence it can be assumed that there are no disruptions in the sedimentation. The correlation of more cores to exclude possible local hiatuses and the requirement of a stable sedimentary environment (constant sedimentary rates) are important prerequisites for the identification of orbital forcing in continental sediments (Paulissen & Luthi, Reference Paulissen and Luthi2011). The only possible heterogeneities are associated with the CBHs; they remain enigmatic, and it is unclear what their existence could imply for the continuity of sedimentation.
Sediment dating is now possible owing to the combination of magnetic polarity analysis and the sedimentation rate obtained by the frequency analysis in the Libkovice Mbr by ASM. The duration of the MZ2 (the thickness of MZ2 is 98 m) from the sedimentation rate from core HK591 (19.2 cm/ka) was 510 ka. This calculation is based on the assumption that there are no hiatuses in the sediment core; i.e. the resulting duration is the lowest estimate of the duration of the magnetozone. In the Geomagnetic Polarity Timescale for the Burdigalian period (Gradstein et al. Reference Gradstein, Ogg, Schmitz and Ogg2012), there are only two possible inverse chrons that fit MZ2: C5Cr (551 ka) and C5Dr (523 ka). The correlation to chron C5Dr is less likely for two reasons: (1) the short inverse zone C5Dr.1n was not detected in MZ2 and (2) MZ1 (the normal zone below MZ2) is rather short when compared with the normal chron C5En. Our record would theoretically reveal the short inverse zone C5Dr.1n within C5Dr: its duration was 23 ka (Gradstein et al. Reference Gradstein, Ogg, Schmitz and Ogg2012) and with respect to the sedimentation rate and sample density that would produce 4–5 neighbouring samples with normal polarity, which we have not observed. The assignment of MZ2 to C5Cr (between 17.235 and 16.721 Ma; Gradstein et al. Reference Gradstein, Ogg, Schmitz and Ogg2012) is thus the more probable option based on the results of the magnetic polarity and frequency analyses.
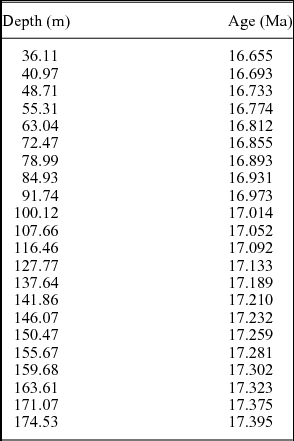
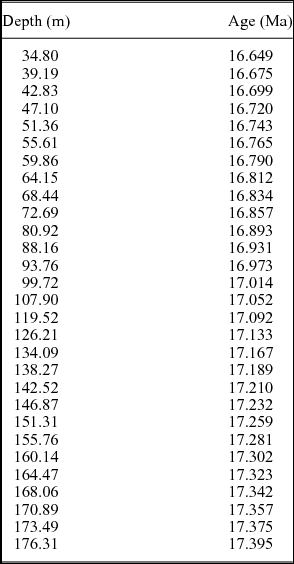
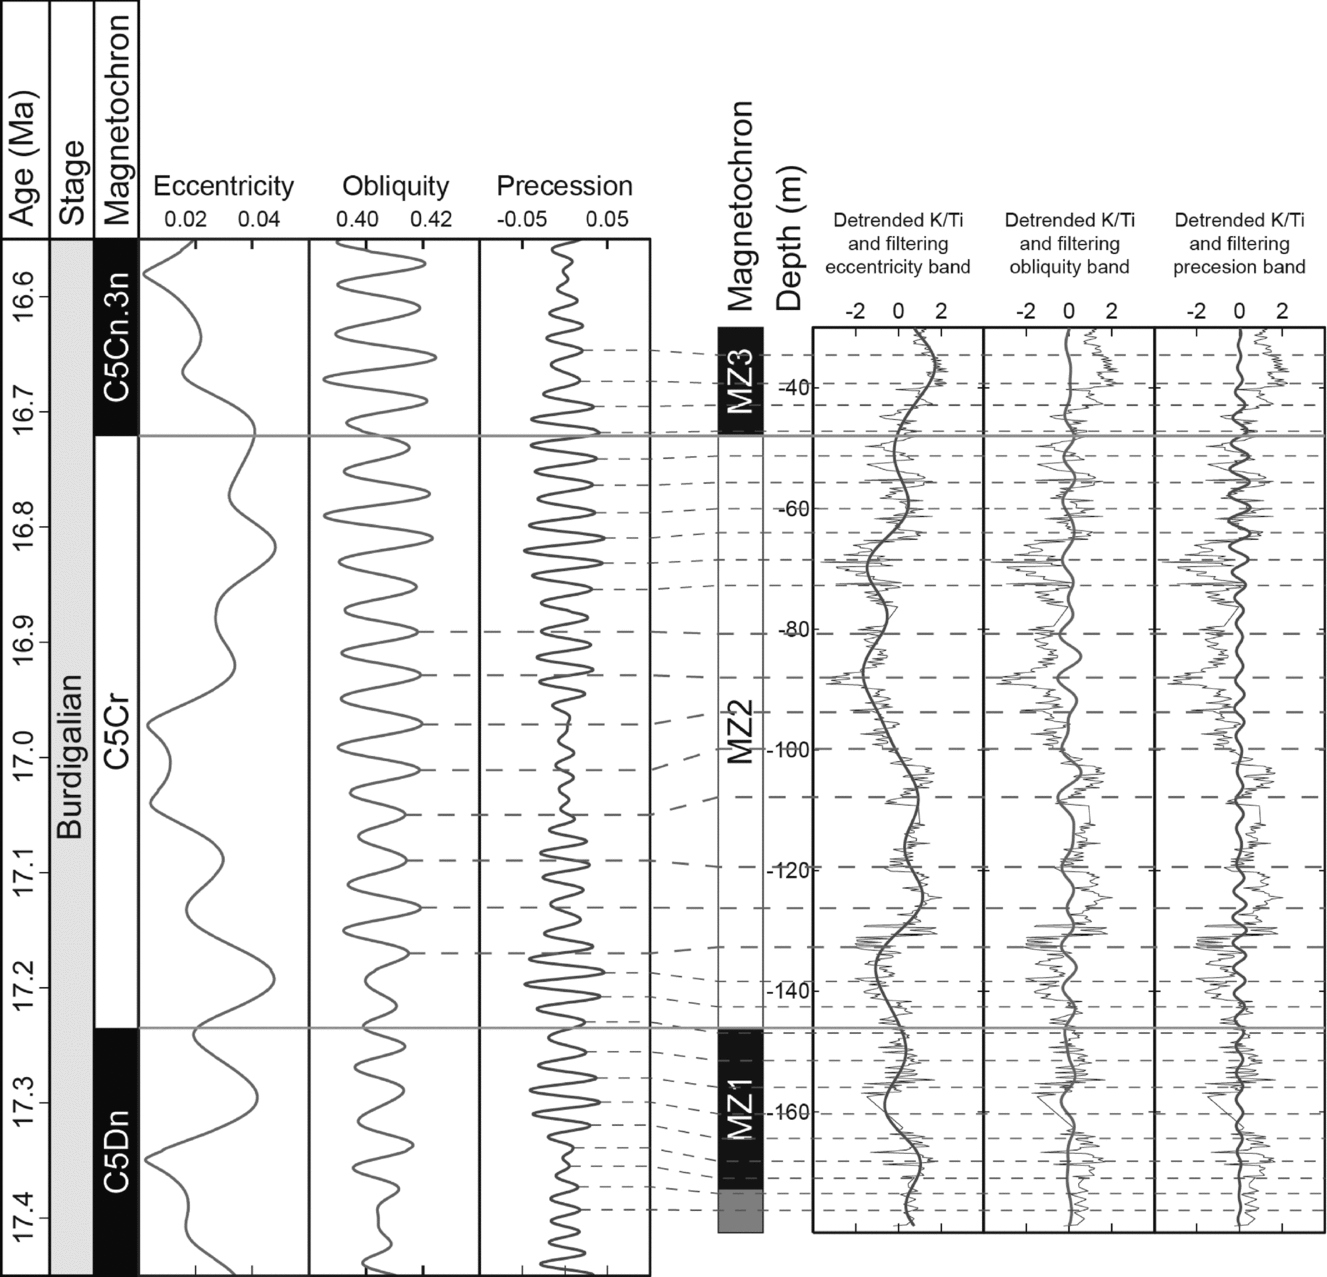
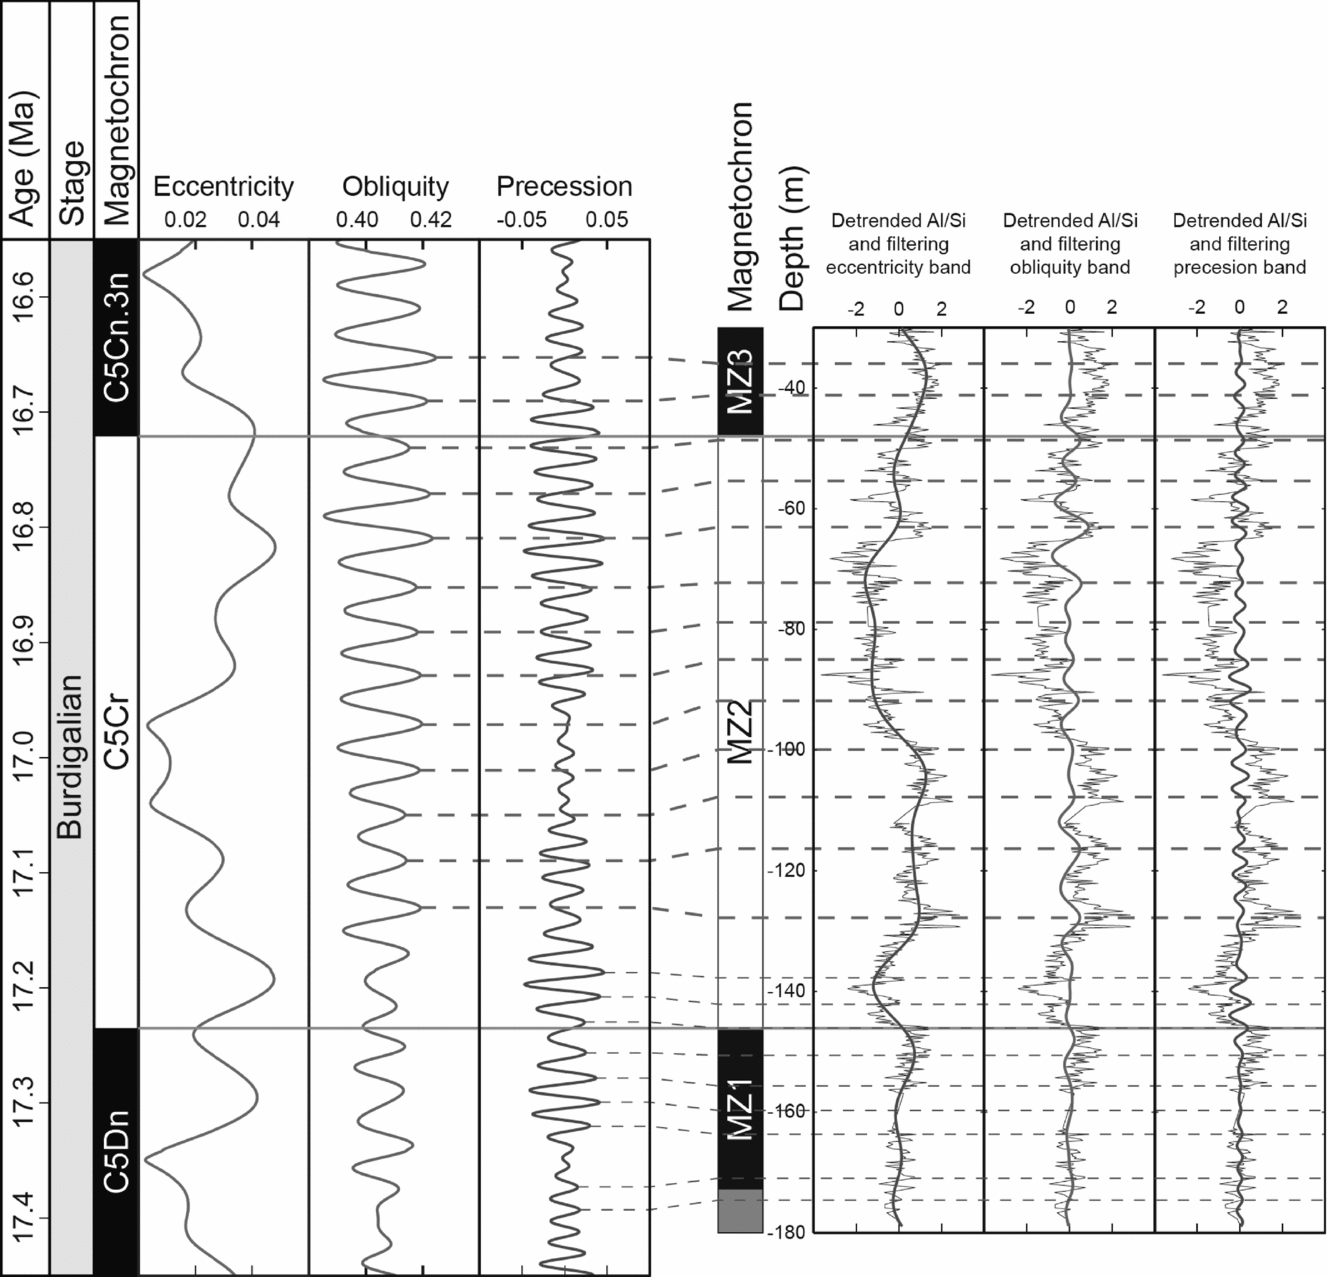
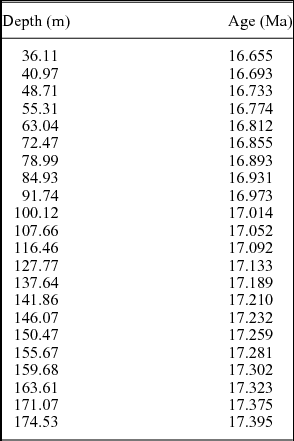
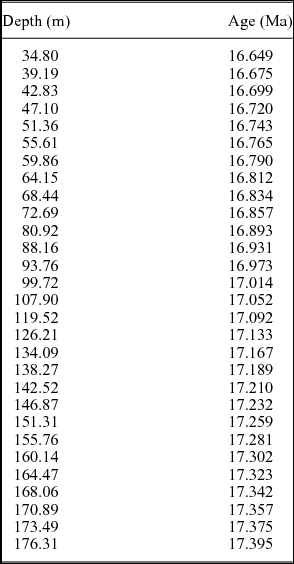
The results obtained are of sufficient quality and reliability to allow for orbital tuning. Two age models for the MZ2 chron are proposed for the K/Ti and Al/Si ratios (Figs 8, 9). The K/Ti and Al/Si series were anchored to the precession, obliquity and eccentricity solutions based on their prevalent expression in the different stratigraphic intervals (see Figs 8, 9). The K/Ti ratio is anchored to the precession cycle from 180 to 140 m and from 75 to 30 m, while the series is anchored to the obliquity cycle from 130 to 80 m, in which obliquity is the prominent cycle (Fig. 8). The Al/Si series is anchored to the precession cycle from 180 m to 140 m depth, the prominent cycle in this interval, and to the obliquity cycle for the rest of the series (Fig. 9). The anchoring points obtained by orbital tuning are listed in Tables 2 and 3.
Orbitally tuned age model for HK591 core based on Al/Si log
Orbitally tuned age model for HK591 core based on K/Ti log
Orbital tuning of the K/Ti series. Dashed lines are anchor points using either the precession or obliquity cycles obtained from the La2004 solution. Solid horizontal lines are the top and the base of the C5Cr magnetochron. The eccentricity band is obtained by applying a Taner low-pass filter (frequency cut: 7.324 × 10⁻² cycle m−1). The obliquity band is obtained by applying a Taner band-pass filter (frequency cuts: 7.324 × 10⁻² – 1.770 × 10⁻¹ cycle m−1). The precession band is obtained by applying a Taner band-pass filter (frequency cuts: 1.892 × 10⁻¹ – 2.686 × 10⁻¹ cycle m−1).

Orbital tuning of the Al/Si series. Dashed lines are anchor points using either the precession or obliquity cycles obtained from the La2004 solution. Solid horizontal lines are the top and the base of the C5Cr magnetochron. The eccentricity band is obtained by applying a Taner low-pass filter (frequency cut: 5.493 × 10⁻² cycle m−1). The obliquity band is obtained by applying a Taner band-pass filter (frequency cuts: 6.714 × 10⁻² – 1.770 × 10⁻¹ cycle m−1). The precession band is obtained by applying a Taner band-pass filter (frequency cuts: 1.831 × 10⁻¹ – 3.113 × 10⁻¹ cycle m−1).

After calibrating the series, new spectral analyses were performed and compared to the La2004 solution to test the quality of the tuning (Fig. 10). The calibrated spectra show stable periods in good agreement with orbital cycles with reduced noise levels, validating the quality of the age model. The age models lead to a duration assessment of the analysed part of the series (from 180 to 30 m depth) of 792 ka for the K/Ti model and of 812 ka for the Al/Si model. The duration of the magnetochron MZ2 is assessed as 504 ka in the two models while the duration of the C5Cr magnetochron is assessed as 514 ka in the Geologic Time Scale 2012 (Gradstein et al. Reference Gradstein, Ogg, Schmitz and Ogg2012). The precision of the age models can thus be estimated as ~10 ka at the boundaries of MZ2.
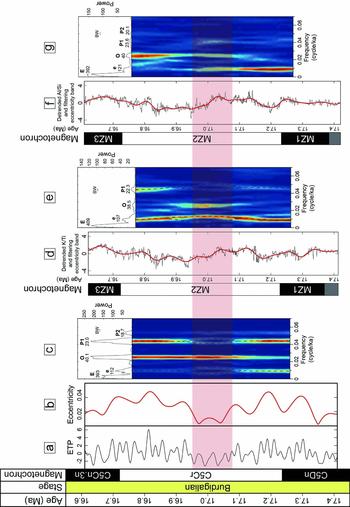
Spectral analyses of the ETP series (eccentricity, tilt, precession) obtained from the La2004 solution compared to spectral analyses of the K/Ti and Al/Si calibrated series. Abbreviations: BW – bandwidth; E – 405 ka eccentricity; e – 100 ka eccentricity; O – obliquity; P1 – precession 1; P2 – precession 2. All the amplitude spectrograms were performed using 300 ka width windows after removing the 405 ka eccentricity by applying a Taner low-pass filter (frequency cut: 4.883 × 10⁻³ cycle/ka). (a) ETP series. (b) Eccentricity series from the La2004 solution. (c) 2π-MTM and amplitude spectrogram analyses from the ETP series. Periods are labelled in ka. (d) Detrended K/Ti, in black, and Taner low-pass filter eccentricity band, in red (frequency cut: 1.720 × 10⁻² cycle/ka). (e) 2π-MTM and amplitude spectrogram analyses from the K/Ti calibrated series. Periods are labelled in ka and their orbital correspondence in bold. (f) Detrended Al/Si, in black, and Taner low-pass filter eccentricity band, in red (frequency cut: 1.901 × 10⁻² cycle/ka). (g) 2π-MTM and amplitude spectrogram analyses from the Al/Si calibrated series. Periods are labelled in ka and their orbital correspondence in bold.

The amplitude spectrogram of the K/Ti ratio shows bifurcation of the eccentricity and precession bands around 17.0 Ma (Fig. 10e). This bifurcation is also observed in the astronomical solution around 17.0 Ma (Fig. 10c). The amplitude of the 100 ka and 405 ka signals are modulated by the 2.4 Ma eccentricity cycle (Laskar et al. Reference Laskar, Robutel, Joutel, Gastineau, Correia and Levrard2004), which is marked on amplitude spectrograms by a series of bifurcations of the eccentricity cycle every 2.4 Ma, during minima of eccentricity amplitudes. Such an amplitude modulation is observed in the astronomical solution within the C5Cr magnetochron. This similarity between the astronomical solution and the K/Ti series supports the correctness of the C5Cr assignment to MZ2. Based on the similarity observed between the K/Ti series and the astronomical solution (Laskar et al. Reference Laskar, Robutel, Joutel, Gastineau, Correia and Levrard2004), we suggest using the age model proposed by the K/Ti log as a reference for the HK591 core.
4.b. Possible tectonic impacts in the Libkovice lake sediments
One of the most important factors which could disturb the record of orbital forcing in active basins under continental settings is tectonics, i.e. subsidence events. The absence of obvious impacts of tectonics is (besides formal statistical tests in frequency analysis) probably the most important prerequisite for safe application of cyclostratigraphy. Event-like subsidence during the termination of the Holešice coal formation in the Bílina area have recently been described by Mach et al. (Reference Mach, Sýkorová, Konzalová and Opluštil2013) as several-metre subsidence pulses. Similar pulses have been documented in coal-forming swamps across geological time around the world (Bailey, Reference Bailey2011 and references therein).
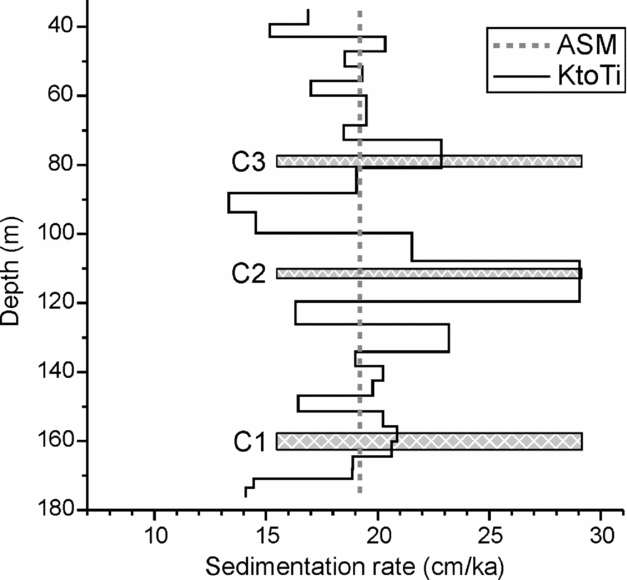
The enhanced subsidence of the basin floor must inevitably affect the transport paths of clastic sediments and hence control the sedimentation rates. The orbital tuning allowed the estimation of the variability of the sedimentation rate in the analysed section in the basin centre. In Figure 11, the mean sedimentation rate for the entire section (by ASM) and sedimentation rate between anchoring points of the tuned K/Ti log are shown. Obviously the orbital tuning revealed deviations from mean sedimentation rates, for which the most straightforward explanation can be tectonics. There were four periods of enhanced sedimentation rates in HK591 shown in Figure 11, and in three of them the CBHs occur. On the other hand, there was no such clear relationship between the positions of CBHs and extremes of orbital parameters (not shown here).
Mean sedimentation rate (from ASM) and interpolated sedimentation rates between anchoring points listed in Table 3 (from orbitally tuned K/Ti log) in lacustrine muds of core HK591. Position of heterogeneities related to crandallite-bearing horizons are indicated by cross-hatched grey rectangles and labels C1 to C3.

At the current level of knowledge it is impossible to definitively decide what forced the crandallite formation: geochemical change triggered by volcanic fallouts (Matys Grygar & Mach, Reference Matys Grygar and Mach2013), climatically or tectonically triggered hydrological extremes, or event-like sedimentation; however, the hydrological extremes or sedimentation events seem most probable. Crandallite is an autochthonous, chemogenic mineral formed whenever sufficient amounts of its constituent ions can interact in an acid environment (Dill, Reference Dill2001; Dill et al. Reference Dill, Dohrmann, Kaufhold and Weber2011). Generally, phosphates (the principal constituent of crandallite), as well as any other important biogenic elements, may be enhanced in the sediments (i.e. prevented from nutrient recyclation) by a biotic crisis or physically by fast burial owing to a dramatically enhanced (event-like) sediment influx. In any case, CBHs and their associated heterogeneities represent a disturbance of the orbital record in the studied sediments.
4.c. Orbital forcing in the Libkovice lake sediments
During the Miocene, and particularly during the Miocene Climatic Optimum, eccentricity (at both ≈ 100 and ≈ 400 ka cycles) controlled the global climate via control of the Antarctic ice sheet (Zachos et al. Reference Zachos, Pagani, Sloan, Thomas and Billups2001; Holbourn et al. Reference Holbourn, Kuhnt, Schulz, Flores and Andersen2007) and the global carbon cycle (Ma et al. Reference Ma, Tian, Li and Wang2011). The control of the lake levels by eccentricity was also found in the Miocene lacustrine basins in the circum-Mediterranean area by Jiménez-Moreno et al. (Reference Jiménez-Moreno, de Leeuw, Mandic, Harzhauser, Pavelić, Krijgsman and Vranjković2009), Abels et al. (Reference Abels, Abdul Aziz, Calvo and Tuenter2009) and Mandic et al. (Reference Mandic, de Leeuw, Vukovic, Krijgsman, Harzhauser and Kuiper2011) as upward-shallowing sedimentary cycles and by Abdul Aziz et al. (Reference Abdul Aziz, Hilgen, Krijgsman, Sanz and Calvo2000) and Van Vugt, Langereis & Hilgen (Reference Van Vugt, Langereis and Hilgen2001) as repetitive major lithofacies changes in basin fills. A precession signal was also found in these lakes and usually attributed to direct insolation-driven change of humidity transport (precipitation). Regarding total annual energy budget, direct (local) insolation changes in low and middle latitudes most clearly reflect precession and eccentricity, while obliquity is relevant for insolation in high latitudes (polar regions) and consequently also for the global planetary climate (Berger & Loutre, Reference Berger, Loutre, Duplessy and Spyridakis1994).
The orbital cycles also modulate the seasonal insolation contrast, which, in return, modulates the oceanic and atmospheric energy balance. In the Northern Hemisphere, the seasonal contrast is enhanced in the case of higher obliquity values or in the case of higher values of eccentricity together with lower precession index values (e.g. Abdul Aziz et al. Reference Abdul Aziz, van Dam, Hilgen and Krijgsman2004). Previous studies performed on Miocene series suggest that higher seasonal contrast favoured the transfer of moisture towards higher latitudes, higher atmospheric CO2 levels and higher temperatures (Holbourn et al. Reference Holbourn, Kuhnt, Schulz, Flores and Andersen2007; Ma et al. Reference Ma, Tian, Li and Wang2011).
The Al/Si ratio is interpreted as a proxy for the coarseness of the sediment (Section 2.d); the more clay minerals mixed with quartz, the higher the Al/Si ratio. The lithological variations in core HK591 revealed by the Al/Si ratio are, however, so mild that they are not perceived as a lithological change by visual examination. We still assume that the coarseness (Al/Si ratio) in the Libkovice Mbr was controlled by the hydrological conditions (hydraulics); variations in fluvial activity most likely controlled the sediment coarseness (Al/Si ratio) as the intensity of the currents transported the clastic sediments to the offshore region. In ephemeral or transient lakes (under a much drier climate), the same forcing would result in shallowing or desiccation of the lake, as in the examples documented by Abels et al. (Reference Abels, Abdul Aziz, Calvo and Tuenter2009) and Mandic et al. (Reference Mandic, de Leeuw, Vukovic, Krijgsman, Harzhauser and Kuiper2011).
There is no simple and universal geochemical interpretation of the changes in the K content that is analogous to the Al/Si ratio. Two possible explanations for how the K/Ti ratios could reflect climate changes in the Libkovice lake sediments are as follows: (1) the mixing of variable proportions of younger and older sediments, i.e. climate-driven changes of the ratio of deposition to erosion in the tributary river systems, and (2) changes in the intensity of chemical weathering (‘hydrolysis’ under which K is much more mobile than Ti). Both mechanisms would be more sensitive to changes in precipitation patterns than to temperature variations; however, these factors are interrelated. It is known from studies of the Miocene climate that the precipitation or seasonality of the rainfall was a major climatic factor that was responsible for the Miocene changes in flora and fauna (Utescher, Böhme & Mosbrugger, Reference Utescher, Böhme and Mosbrugger2011; Utescher et al. Reference Utescher, Ashraf, Dreist, Dybkjær, Mossbrugger, Pross and Wilde2012).
The explanation that the K/Ti ratio was driven by mixing sediment sources is supported by the fact that the earliest clastic sediments in the Holešice Mbr immediately above the coal seam in core LB297 have much lower K/Ti (or K/Al) ratios than most of the Libkovice Mbr (Fig. 2); i.e. K content grew immediately after the onset of the local lakes and later the emergence of the basin-wide lake. A similar but even more pronounced pattern of the K/Al ratio in the upper part of the Holešice Mbr was found in the clastic sediments that were imported to the basin by the Žatec River (cores DO546 and SP257 in the Chomutov area; Matys Grygar & Mach, Reference Matys Grygar and Mach2013). That change, which was apparently unidirectional over the long term, reflected a well-defined change in the watershed of the feeding river (or rivers) during the earliest phases of the lake transgression in what was formerly peatland. The K/Ti (K/Al) values at their minima in the CBHs in the Libkovice mudstones correspond roughly to the composition of these earliest lacustrine clastic sediments, which terminated the formation of the Holešice coal.
The interpretation of the K/Ti ratio as being driven by the intensity of the chemical weathering could allow the proposition of a theoretical mechanism for the orbital forcing in the Libkovice lake watershed based on the importance of seasonal contrasts driving transport of humidity. In the K/Ti series, the most appropriate age model suggests that the precession index maxima from the La2004 solution are correlated to the maxima of the filter of the precession band while the obliquity maxima from the La2004 solution are correlated to the minima of the filter of the obliquity band (Fig. 8). In addition, the eccentricity solution from La2004 appears to be inversely correlated to the filter of the eccentricity in the K/Ti series (Figs 8, 10). These observations are consistent with the K/Ti ratio being lower when the seasonal contrast was higher.
4.d. Climatic record in the Most Basin
An important output of our study is a credible age model for the Libkovice Mbr. The model allows for a comparison of the palaeontological information inferred from the Most Fm record with the record of global Miocene climate change.
In our age model, in which MZ2 is assigned to C5Cr, the top of the Holešice coal can be dated to approximately 17.8 Ma; in this estimate, the age of the lowermost clastic part of core HK591 was extrapolated from the sedimentation rate for the Libkovice Mbr and the beginning of C5Cr. This date coincides with the Ottnagian (approximately 18 Ma) cooling event in the Central Paratethys, which was inferred from a decrease in the diversity of the echinoderm fauna in the Paratethys by Kroh (Reference Kroh2007) and was also referred to by Holcová (Reference Holcová2008).
The basin-wide Libkovice lake formed at approximately 17.4 Ma. The lake thus nearly overlapped with the first part of the Miocene Climatic Optimum, which is generally placed between 17 and 15 Ma (Zachos et al. Reference Zachos, Pagani, Sloan, Thomas and Billups2001; Mosbrugger, Utescher & Dilcher, Reference Mosbrugger, Utescher and Dilcher2005; Wan et al. Reference Wan, Kürschner, Clift, Li and Li2009). Evidence for warming/drying between 17.5 and 16.5 Ma was found in marine to marginal-marine sediments in Denmark (Larsson et al. Reference Larsson, Dybkjær, Rasmussen, Piasecki, Utescher and Vajda2011). These changes impacted the volume of the southern icecaps and consequently the global climate (Zachos et al. Reference Zachos, Pagani, Sloan, Thomas and Billups2001); the East Antarctica ice sheet was at its Early Miocene minimum between 17 and 16 Ma (Pekar & DeConto, Reference Pekar and DeConto2006). On the other hand, the date of the Libkovice lake's transgression and basin-wide extent is incompatible with the dry pulses (those with mean annual precipitation < 500 mm) that were assumed for the period at approximately 17 Ma by Böhme, Winklhofer & Ilg (Reference Böhme, Winklhofer and Ilg2011) for Southwestern Europe as well as Central Europe or with considerable climate drying in that period. Stable lakes around 17 Ma existed also in the Dinaride Lake System (Crnika: Jiménez-Moreno et al. Reference Jiménez-Moreno, de Leeuw, Mandic, Harzhauser, Pavelić, Krijgsman and Vranjković2009; Lake Sinj: Jiménez-Moreno et al. Reference Jiménez-Moreno, Mandic, Harzhauser, Pavelić and Vranjković2008 and de Leeuw et al. Reference de Leeuw, Mandic, Vranjković, Pavelić, Harzhauser, Krijgsman and Kuiper2010).
The local impact of the Miocene Climatic Optimum on the European continental environment is still a matter of discussion (Utescher, Böhme & Mosbrugger, Reference Utescher, Böhme and Mosbrugger2011; Utescher et al. Reference Utescher, Ashraf, Dreist, Dybkjær, Mossbrugger, Pross and Wilde2012). The Miocene warm maximum, which included paratropical and tropical floral elements in Central Europe, such as mastixoid flora (Kovar-Eder, Kvaček & Meller, Reference Kovar-Eder, Kvaček and Meller2001), is generally placed in the Langhian period and is referred to as the Middle Miocene climatic optimum. The first part of the Miocene Climatic Optimum sensu Zachos et al. (Reference Zachos, Pagani, Sloan, Thomas and Billups2001) is, however, dated to the last million years of the Burdigalian (between 17 and 16 Ma). It coincided with the Karpatian climate recovery in the Central Paratethys (Kroh, Reference Kroh2007) and is most likely the same event as the warming that was referred to as the Early Miocene climatic optimum by Kvaček & Teodoridis (Reference Kvaček and Teodoridis2007). Palaeobotanists studying the Most Basin findings have assumed that the initial part of the Miocene warming was recorded between the uppermost part of the Holešice Mbr and the Lom Mbr (Teodoridis & Kvaček, Reference Teodoridis and Kvaček2006; Kvaček & Teodoridis, Reference Kvaček and Teodoridis2007; Teodoridis et al. Reference Teodoridis, Mazouch, Spicer and Uhl2011). The age model reported here for core HK591 confirms that timing. All of these findings show that the basin-wide Libkovice lake existed during the onset of the climate optimum.
The sediment coarsening at the boundary of the Libkovice and Lom Mbrs is now dated to approximately 16.6 Ma. The Lom Mbr deposits are interpreted to be a result of shallowing of the lake due to basin filling; however, there are no signs of lake desiccation in the sediment record. The scarcity or absence of the fossils in the Lom and Osek Mbrs is the most likely reason why palaeobotanists have not recognized the typical Miocene Climatic Optimum floral climax in the Most Basin (Kovar-Eder, Kvaček & Meller, Reference Kovar-Eder, Kvaček and Meller2001).
4.e. Outlines of future research: towards higher resolution European climate archives
Zachos et al. (Reference Zachos, Pagani, Sloan, Thomas and Billups2001) and other authors (Holbourn et al. Reference Holbourn, Kuhnt, Schulz, Flores and Andersen2007; Ma et al. Reference Ma, Tian, Li and Wang2011) showed that the global climate in the late Early and early Middle Miocene was controlled by the eccentricity and obliquity patterns, which are well expressed in marine sediments. Additionally, direct insolation changes in middle latitudes are mainly controlled by eccentricity and precession. These signals should be identified in any European continental archive of sufficient temporal resolution and sensitivity, such as in the Libkovice lake described in this report but also in other lacustrine archives (Abdul Aziz et al. Reference Abdul Aziz, Hilgen, Krijgsman, Sanz and Calvo2000; Van Vugt, Langereis & Hilgen Reference Van Vugt, Langereis and Hilgen2001; Abels et al. Reference Abels, Abdul Aziz, Calvo and Tuenter2009; Mandic et al. Reference Mandic, de Leeuw, Vukovic, Krijgsman, Harzhauser and Kuiper2011).
Apparently, the impact of the Miocene orbitally driven climate variability has not been adequately addressed in Miocene palaeoclimate reconstructions, except for pollen record analyses from lacustrine sediments (Jiménez-Moreno et al. Reference Jiménez-Moreno, Rodriguez-Tovar, Pardo-Iguzquiza, Fauquette, Suc and Muller2005, Reference Jiménez-Moreno, Mandic, Harzhauser, Pavelić and Vranjković2008, Reference Jiménez-Moreno, de Leeuw, Mandic, Harzhauser, Pavelić, Krijgsman and Vranjković2009). In a recent review of Miocene climate change in European continental settings by Utescher, Böhme & Mosbrugger (Reference Utescher, Böhme and Mosbrugger2011), orbital forcing was marginally mentioned. Alternatively, Utescher et al. (Reference Utescher, Ashraf, Dreist, Dybkjær, Mossbrugger, Pross and Wilde2012) assigned changes in palynomorphs to the eccentricity signal (400 ka) during the Middle Miocene climatic optimum and mentioned that an uneven sedimentation rate was a possible reason why shorter orbital cycles were not identified. Böhme, Winklhofer & Ilg (Reference Böhme, Winklhofer and Ilg2011) presented a climatic reconstruction for that period and region with a temporal resolution of less than 1 Ma that was based on terrestrial vertebrates. It showed dry pulses at a temporal scale of the eccentricity variations. Although the extremely low precipitation during these pulses has not been confirmed (Utescher et al. Reference Utescher, Ashraf, Dreist, Dybkjær, Mossbrugger, Pross and Wilde2012), the results of Böhme, Winklhofer & Ilg (Reference Böhme, Winklhofer and Ilg2011) may indicate the poorly reconstructed climate dynamics of the Miocene period. Long lacustrine sedimentary successions (or similar continental archives) with a robust age model can have outstanding temporal resolutions, but the data cannot be simply used to calculate conventional climate parameters such as temperature or precipitation, except for the abovementioned pollen analyses. On the other hand, they can reconstruct, show or reject prominent climate transitions and provide an age framework for their palaeontological localities. The drawbacks of the known European lacustrine archives of the Miocene period are their limited durations and that they cannot be merged into a continuous composite series because each lake existed under unique settings. However, progress in the identification of detailed Miocene climate dynamics around the Miocene Climatic Optimum could certainly be achieved using an integrated approach to climate reconstruction.
5. Conclusions
The lack of fossils or visual sedimentary features in lacustrine sequences does not necessarily preclude their use in palaeoclimatic interpretations. This study utilises the fact that the Libkovice lake had a stable sedimentary environment for approximately 0.8 Ma, which allowed for the deposition of 150 m of fine monotonous siliciclastic sediments. The analysis of these sediments has a millennial resolution, which was estimated from the sampling density and sedimentation rate. The frequency analysis of the geochemical characteristics of the sediments showed that the Al/Si (coarseness) and K/Ti (site-specific provenance markers and/or proxy of chemical weathering intensity) ratios were controlled by variations in precession, obliquity and eccentricity of the Earth's orbit. In the time intervals with low eccentricity, changes in obliquity are more pronounced in the geochemical records of the Libkovice Mbr than the changes in precession. In periods with high eccentricity this reverses. These results are principally consistent with previous studies on Miocene lacustrine basins in the circum-Mediterranean area. Our study shows that even lithologically uniform sediments are worth studying, especially because they are not affected by lake-level fluctuations and potentially discontinuous sedimentation.
Low-frequency sedimentary changes in the sedimentary record of the Libkovice Mbr were mainly forced by eccentricity. This is also found in various other Miocene lacustrine basins in southern Europe. It is frequently expressed as variations in base-level, partially because of preferential selection of sedimentary records with a varying lithology for spectral analysis.
Eccentricity-modulated precession and obliquity were the primary controls on the high-frequency variations of the K/Ti ratio. The actual mechanism recording the variations was most likely specific to the lake watershed. The K/Ti ratio was decreased during periods of assumed increased seasonal contrasts, which could be interpreted as a record of enhanced humidity import to the lake watershed and a more intensive chemical weathering. However, because the mechanism recording the variations was climatically controlled weathering in the lake watershed and/or transport of clastic sediments from the watershed to the lake bottom, orbital forcing should also be identified in other comparable lacustrine systems in which the watershed was not geochemically uniform and climate was variable. Geochemical studies of continuous, high-resolution archives that have been undervalued or overlooked could thus shed more light on past climate changes than most conventional palaeontological studies may achieve.
Acknowledgements
The main part of this research was financed by the Czech Science Foundation, project No. P210/11/1357. Sediment coring, lithological descriptions and sampling were kindly provided by the North Bohemian Mines, j.s.c. A huge volume of laboratory work was performed by P. Vorm, R. Barochová and Z. Hájková from the workplace of the corresponding author. Two referees considerably improved the first version of the manuscript.
Declaration of interests
There are no conflicts of interests. This study addresses the analysis of overburden, which has no relevance for the economy of coal mining or other interests of the North Bohemian Coal Mines.