Introduction
The purine adenosine, an endogenous nucleoside that plays an important role in the energy metabolism of all life (Lassila et al., Reference Lassila, Zalatan and Herschlag2011), also plays a variety of modulatory roles in the central nervous system (CNS) under normal and pathological conditions (Dunwiddie & Masino, Reference Dunwiddie and Masino2001; Ribeiro et al., Reference Ribeiro, Sebastiao and de Mendonca2003; Burnstock, Reference Burnstock2007; Sebastiao & Ribeiro, Reference Sebastiao and Ribeiro2009; Ribeiro & Sebastiao, Reference Ribeiro and Sebastiao2010; Zhong et al., Reference Zhong, Yang, Huang and Luo2013; Fredholm, Reference Fredholm2014). Adenosine is released by nearly all cells, both neurons and glia, of the CNS, including those of the retina (Braas et al., Reference Brass, Zarbin and Snyder1987; Burnstock, Reference Burnstock2007; Ribeiro & Sebastiao, Reference Ribeiro and Sebastiao2010). Adenosine is known as a neuromodulator in the CNS, which fine tunes the functions of the neurotransmitters in neural signaling, particularly in excitatory synapses (Blazynski et al., Reference Blazynski, Cohen, Fruh and Niemeyer1989; Quarta et al., Reference Quarta, Ferre, Solinas, You, Hockemeyer, Popoli and Goldberg2004; Ribeiro & Sebastiao, Reference Ribeiro and Sebastiao2010), and has neuroprotective effects in the retina and brain via modulation of glutamate synapses (Rudolphi et al., Reference Rudolphi, Schubert, Parkinson and Fredholm1992; Li & Roth, Reference Li and Roth1999; Roth, Reference Roth2004; Stone et al., Reference Stone, Ceruti and Abbracchio2009; Zhong et al., Reference Zhong, Yang, Huang and Luo2013). Adenosine receptors are divided into four subtypes, A1, A2A, A2B, and A3 receptors based on pharmacological profiles, and are all known to be coupled to G-proteins (Ralevic & Burnstock, Reference Ralevic and Burnstock1998; Olah & Stiles, Reference Olah and Stiles2000; Fredholm et al., Reference Fredholm, Izerman, Jacobson, Klotz and Linden2001; Burnstock, Reference Burnstock2007; Ciruela et al., Reference Ciruela, Albergaria, Soriano, Cuffí, Carbonell, Sánchez, Gandía and Fernández-Dueñas2010).
Adenosine receptors have been localized on the cell membranes of nearly all types of neurons of the retina (Braas et al., Reference Brass, Zarbin and Snyder1987; Blazynski, Reference Blazynski1989, Reference Blazynski1990; Blazynski & Perez, Reference Blazynski and Perez1991; McIntosh & Blazynski, Reference McIntosh and Blazynski1994; Studholme & Yazulla, Reference Studholme and Yazulla1997; Zhang et al., Reference Zhang, Budak, Lu, Khurana, Zhang, Laties and Mitchell2006; Galvao et al., Reference Galvao, Elvas, Martins, Cordeiro, Ambrósio and Santiago2015). Their location in the retina appear however not to be the same for all receptor subtypes (McIntosh & Blazynski, Reference McIntosh and Blazynski1994; Kvanta et al., Reference Kvanta, Seregard, Sejersen, Kull and Fredholm1997; Zhang, et al., Reference Zhang, Budak, Lu, Khurana, Zhang, Laties and Mitchell2006; Huang et al., Reference Huang, Hsiao, Kao, Chen, Chen, Chiang, Lee, Lu, Chern and Wang2014). Studies measuring mRNA have shown that the A1 adenosine receptor is mostly located in the inner retina, and primarily the ganglion cell layer, while the A2A receptor mRNA is located in the inner nuclear layer, ganglion layer and to a lesser extent the outer nuclear layer of the retina (Kvanta et al., Reference Kvanta, Seregard, Sejersen, Kull and Fredholm1997). The presence of A2A receptors on vertebrate photoreceptors has been demonstrated (Blazynski, Reference Blazynski1990; McIntosh & Blazynski, Reference McIntosh and Blazynski1994; Kvanta et al., Reference Kvanta, Seregard, Sejersen, Kull and Fredholm1997), and appear to modulate neurotransmitter release (Stella et al., 2002, 2003, 2009) and outer segment elongation (Rey & Burnside, Reference Rey and Burnside1999). In addition, A2A receptors have been localized on starburst amacrine cells and retinal ganglion cells of the rat retina (Wang et al., Reference Wang, Blankenship, Anishchenko, Elstrott, Fikhman, Nakanishi and Feller2007; Huang et al., Reference Huang, Hsiao, Kao, Chen, Chen, Chiang, Lee, Lu, Chern and Wang2014). The A3 adenosine receptor is known to be present in the ganglion layer and the inner plexiform layer of the retina (Zhang et al., Reference Zhang, Budak, Lu, Khurana, Zhang, Laties and Mitchell2006; Galvao et al., Reference Galvao, Elvas, Martins, Cordeiro, Ambrósio and Santiago2015), and functioning A3 receptors that can modulate the action of glutamate N-methyl-D-Aspartate (NMDA) receptors have been demonstrated on isolated rat retinal ganglion cells (Zhang et al., Reference Zhang, Budak, Lu, Khurana, Zhang, Laties and Mitchell2006; Zhang et al., Reference Zhang, Hu, Zhang, Lu, Lim, Eysteinsson, Jacobson, Laties and Mitchell2010). Whether adenosine receptors are present on retinal bipolar cells is still unclear, although a broad adenosine agonist has been found to inhibit NMDA evoked currents in isolated rat bipolar cells, identified morphologically (Costenla et al., Reference Costenla, De Mendonca, Sebastiao and Ribeiro1999).
What is known about the influence of adenosine receptors on the light evoked activity of the retina is still limited, and mainly restricted to photoreceptor and ganglion cell activity. Injecting adenosine intraarterially into cats increased the amplitude of the electroretinogram (ERG) b-wave (Blazynski et al., Reference Blazynski, Cohen, Fruh and Niemeyer1989; Macaluso et al., Reference Macaluso, Frishman, Frueh, Kaeling-Lang, Onoe and Niemeyer2003). The optic nerve response in cat, both spontaneous activity and light-evoked firing rate, is reduced by adenosine (Kaelin-Lang et al., Reference Kaelin-Lang, Jurklies and Niemeyer1999; Macaluso et al., Reference Macaluso, Frishman, Frueh, Kaeling-Lang, Onoe and Niemeyer2003). Adenosine modulates the light responses recorded from single retinal ganglion cells (Clark et al., Reference Clark, Kurth-Nelson and Newman2009; Sodhi & Hartwick, Reference Sodhi and Hartwick2014). Adenosine modulation of glutamate release from amphibian rods (Stella et al., Reference Stella, Hu, Vila and Brecha2007) and cones (Stella et al., Reference Stella, Hu and Brecha2009) via inhibition of calcium channels at their synaptic terminals has been demonstrated, while adenosine and adenosine receptor ligands have no effect on the photocurrent and light-evoked hyperpolarization of these photoreceptors (Stella et al., Reference Stella, Bryson, Cadetti and Thoreson2003). However, less is known of the role that the A2A and A3 adenosine receptors may play in modulating other aspects of retinal function, such as bipolar and amacrine cell light evoked activity.
The corneal ERG has been used extensively to examine retinal function and the combined response of the retina to light stimulation, both for clinical purposes, and to evaluate basic processes in the retina (e.g., Dong & Hare, Reference Dong and Hare2002; Möller & Eysteinsson, Reference Möller and Eysteinsson2003; Bui & Fortune, Reference Bui and Fortune2004; Mojumder et al., Reference Mojumder, Sherry and Frishman2008). The ERG, when recorded with standard procedures and stimuli, shows distinct components which are clearly discernible, with the a- and b-waves being the most prominent. Oscillatory potentials (OPs) are low-amplitude wavelets riding on the b-wave, but which have distinct cellular sources in the retina, separate from the a- and b-waves, and may originate from the activity of the amacrine cells (Wachtmeister, Reference Wachtmeister1998). Thus, the ERG can be used as an electrophysiological indicator of neural activity in the retina, when recorded in response to flashes of light under either light- or dark-adapted conditions, and hence to what extent a neuromodulator like adenosine may affect that activity. The purpose of this study was to examine what role adenosine, and two adenosine receptor subtypes known to have opposite effects on neurotransmission, and which have a different localization in the retina, may play in the generation or modulation of the rat ERG.
Materials and methods
Animals
A total of 37 adult female albino Sprague–Dawley rats, 12–30 weeks of age and weighing 229–435 g were used in this study. The rats were kept in a room with a 12 h day and night light/dark cycle. The rats had free access to water and food. Prior to each experiment a rat was selected at random and then given an intraperitoneal (IP) injection of S-ketamine (Pfizer, Ballerup, Denmark) (75 mg/kg) and xylazine (Chanelle Pharmaceuticals, Loughrea, Ireland) (6 mg/kg). The anesthesia was maintained by an hourly IP infusion of 25 mg/kg ketamine and 2 mg/kg xylazine. Pupils were dilated using cyclopentolate (Chauvin Pharmaceuticals Ltd., Kingston-Upon-Thames, UK) eye drops. Alcaine (Alcon Inc., Fort Worth, TX) drops were applied as a local anesthetic on the cornea. The whiskers were cut away. Drops of saline solution were periodically applied to the eye to prevent dehydration of the cornea and to maintain sufficient electrical conductance from it to the corneal electrode. A short piece of string was threaded behind the animal’s upper front teeth and the head placed in a straight line with the body, to keep the airway of the animal securely open. The animal lay on one side on a heating pad to maintain the body temperature of it at 37°C. Body temperature was monitored with a rectal thermosensor placed in the animal, and connected to a thermal regulator, which turned the heating pad on and off as needed. Experimental procedures and handling of the experimental animals were in accordance with the principles regarding the care and use of animals adapted by the American Physiological Society and the Society for Neuroscience, and EU Directive 2010/63/EU for animal experiments.
Electroretinography
For ERG recordings, a stainless steel wire loop (3 mm in diameter) was used as a corneal electrode (Goto, Reference Goto1996). A platinum subdermal needle placed on the lower eyelid was used as a reference electrode. The reference electrode was bent and its tip was cut off to minimize the risk of puncturing the skin when hooked on the lower eyelid. Another platinum subdermal needle was used as a ground electrode, placed in the outer ear. Before the start of each recording the corneal electrode was dipped in 1% methylcellulose before being placed on the eye. This was done to prevent dryness of the cornea and reduce the likelihood of cataract formation, as well as to improve electrical contact (Ridder et al., Reference Ridder, Nusinowitz and Heckenlively2002; Serrato et al., Reference Serrato, Tzekov and Marmor2003). Cataract formations had been observed in some animals where the cornea electrode had been kept on the eye continuously from the start of the experiment to the end. Therefore the corneal electrode was removed during dark adaptation, and then placed again on the cornea under dim red light before recording. The output from the electrodes was led into a Digitimer Neurolog (Digitimer Ltd., Welwyn Garden City, Hertfordshire, England) amplifier suite, which consists of a NL 103 A.C. pre-amplifier, NL 105 A.C. amplifier and NL 115 filters. The signal was amplified 1000 times. The recordings were fed through a 50 Hz notch filter to remove mains interference. Analog filters were set at a bandwidth of 1–1000 Hz. After passing the filters, the recording was fed into a computer through a PowerLab analog/digital converter (ADInstruments Ltd., Castle Hill, New South Wales, Australia). Data acquisition and analysis was performed with the LabChart 7 Pro software package (ADInstruments Ltd., Castle Hill, New South Wales, Australia). In the LabChart software a 50–500 Hz digital filter was set to further isolate the OPs in a separate recording channel. The sampling rate of the recordings was set at 20 kHz. For the first 2/3 of the experiments the setup described above was used. For the last third of the experiments, the Neurolog amplifier suite was replaced with a MacLab BioAmp, model ML131 amplifier (ADInstruments Ltd., Castle Hill, New South Wales, Australia) with identical filter settings. White light stimuli with a duration of 10 µs to evoke the ERG were generated with a Grass PS-33 photostimulator (Astro-Med/Grass Inc., West Warwick, RI). The stimuli used were of four different luminances: 0.67, 1.27, 1.57, and 1.87 log cd s/m2. The interstimulus interval was kept at 1 min. The stimulator stroboscope light source with a diffuser was located 20 cm from the cornea. Data acquisition, triggered with an electrical pulse synchronized with the light stimulus from the photostimulator, began 50 ms before the trigger pulse was initiated and lasted for 2000 ms after the pulse.
Drugs
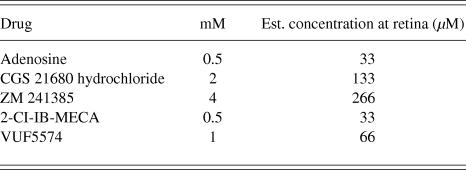
Four different ligands for specific adenosine receptors, in addition to adenosine and saline solution were tested in this study. Adenosine, 2-Cl-IB-MECA (1-[2-chloro-6-[[(3-iodophenyl)methyl]amino]-9H-purin-9-yl]-1-deoxy-N-methyl-b-D-ribofuranuronamide), CGS21680 (3-[4-[2-[[6-amino-9-[(2R,3R,4S,5S)-5-(ethylcarbamoyl)-3,4-dihydroxy-oxolan-2-yl]purin-2-yl]amino]ethyl]phenyl]propanoic acid), VUF5574 (N-(2-methoxyphenyl)-N′-[2-(3-pyridinyl)-4-quinazolinyl]-urea), and ZM241385 (4-(2-{[5-amino-2-(furan-2-yl)-[1,2,4]triazolo[1,5-a][1,3,5]triazin-7-yl]amino}ethyl)phenol) were all purchased from Tocris Bioscience (Bristol, UK). All stock solutions were diluted with 0.9% saline solution. The drugs are listed in Table 1 along with their molarity. The concentration of each ligand injected into the vitreous is based on the estimated concentration at the retina in µM (Möller & Eysteinsson, Reference Möller and Eysteinsson2003), as shown in Table 1. For each ligand only one concentration was tested on six or more eyes, and chosen based on known affinity of the drugs for their respective receptors, preliminary single experiments with two or more concentrations higher or lower, and previously published findings in the literature (e.g., Stella et al., Reference Stella, Bryson and Thoreson2002; Sun et al., Reference Sun, Barnes and Baldridge2002).
Concentrations of the adenosine ligands tested.

The four adenosine receptor ligands tested along with exogenous adenosine and their concentrations dissolved in 0.9% NaCl. Molar concentration (mmol/l) and estimated molarity at retina given equal distribution of ligand in the vitreous (µmol/l). The equation used to calculate the distribution of the ligand in the vitreous is (X × 0.005)/0.15, where X is the molar concentration, 0.005 is the amount of ligand injected into the vitreous in ml and 0.15 is the estimated volume of the vitreous of the rat in ml (Möller & Eysteinsson, Reference Möller and Eysteinsson2003).
Intravitreal injections
A forceps was used to gently lift the eye tested so that the sclera was visible. The drugs/saline solution of 5 µl was injected into the vitreous with a NanoFil IOKit system (World Precision Instruments, Sarasota, FL), which consists of a 34 G platinum needle and tubing connected to a Hamilton syringe. The needle was inserted into the eye through the pars plana and into the vitreous chamber behind the lens; the tip of the needle was visible via the dilated pupil. Recordings from light adapted eyes were obtained 5, 65, 130, and 195 min after injection of the ligand. It was found that the drugs tested tended to start having an effect on the photopic ERG after about 65 min. Dark adapted recordings were obtained at 45, 110, 175, and 240 min after injection. It was determined that the drugs tended to start having an effect on the scotopic ERG after approximately 45 min. The results were only analyzed statistically for those two time points (45 and 65 min) after drug injection. In all of the experiments, only one drug/saline was tested on each eye and each drug was tested on 6 eyes. In addition, 5 µl of saline solution was tested on 7 eyes to control for any effects of the injection procedure on the ERG. At the completion of each experiment, which usually lasted about 7 h, the rats were sacrificed by cervical dislocation, bleeding by sectioning of the femoral artery and decapitation.
Experimental procedure
An anesthetized rat was prepared as described above. After having prepared the rat, light stimuli at three increasing luminances, 1.27, 1.57, and 1.87 log cd s/m2, were used to obtain ERG recordings from a light adapted retina. Flicker ERG responses were recorded in response to light stimuli of 1.57 log cd s/m2 in mean luminance at a 15 Hz flicker rate. The room lights were then turned off and the animal dark adapted for 40 min. At the end of dark adaptation another four ERG recordings elicited by light stimuli with a luminance of 0.67, 1.27, 1.57, or 1.87 log cd s/m2 were obtained, to record the scotopic ERG a-wave, b-wave, and OPs. Once these recordings were completed the animal was light adapted with a 1.7 log cd/m2 background light for 15 min. This entire procedure was performed twice, and after that the ligand to be tested, or saline was injected into the eye. After each injection, the procedure described above was repeated 4 more times, for a total of 6 repetitions for each experiment. This procedure was carried out in each experiment, with ERG recordings obtained after each of a total series of 8–10 light and dark adaptations in every experiment. At each stimulus luminance, recordings were obtained for both the 1–1000 and 50–500 Hz bandwidths simultaneously, and stored in separate voltage recording channels in the software, but on the same time scale.
Data analysis
The amplitudes of the a-wave, the b-wave, and OPs were measured before and after drug injection. The amplitudes of the OPs were measured as the difference between the top and bottom of three peaks. The amplitude of the a-wave was measured from the baseline to the lowest trough of the a-wave. The b-wave amplitude was measured from the lowest trough of the a-wave to the highest peak in the response within 200 ms after the stimulus onset. The amplitudes of the flicker responses were measured as the difference between the top and bottom of four peaks starting after 0.5 s from the beginning of flicker stimulation. The implicit time of the a-wave of the scotopic ERG was measured as the time between the start of the stimulus to the lowest trough of the leading edge of the a-wave. The duration or full width of the a-wave was measured as the time between the half maximum amplitude of the a-wave, and the b-wave across at the same horizontal level. The implicit time of the scotopic and photopic b-waves was measured from the stimulus to the peak of the b-wave. The data were submitted to statistical analysis using the IBM SPSS 22 software package (IBM SPSS, Armonk, NY). A paired t-test was used to compare the means before and after drug/saline injection. The alpha level of significance was set at α = 0.05. All values of the parameters measured, before and after drug injection, of the a-wave, b-wave, the combined average of the OPs (the oscillatory index), combined average of the flicker responses and implicit times are given as means ± Standard Error of the Mean (S.E.M.).
Results
A total of 49 successful experiments were performed in this study, in addition to preliminary experiments to test the preparation and different concentrations of the adenosine ligands. Injection of a physiological NaCl solution was used as a control to test whether the procedure itself caused an effect on the response. NaCl had no statistically significant effect on the amplitude of the a-wave (P = 0.632) or the b-wave (P = 0.217) of the ERG. However, the OPs showed a statistically significant transient decrease in amplitude, from a mean of 108 ± 34 µV in control to 72 ± 42 µV shortly after injection (P = 0.005), but returned to 90 ± 26 µV after 2 h following the injection. The NaCl solution was tested on a total of 7 eyes in seven rats.
The effects of exogenous adenosine on the rat ERG
Previous studies have indicated that in at least some species adenosine itself may cause changes in the flash evoked ERG (e.g., Blazynski et al., Reference Blazynski, Cohen, Fruh and Niemeyer1989; Macaluso et al., Reference Macaluso, Frishman, Frueh, Kaeling-Lang, Onoe and Niemeyer2003). Exogenous adenosine was therefore tested on 6 rat eyes at a concentration of 0.5 mM. Preliminary experiments on single eyes with 1 and 0.4 mM adenosine showed essentially the same results. Fig. 1A shows examples of scotopic ERG recordings from one eye, elicited with the maximum stimulus luminance used (1.87 log cd s/m2), before and after adenosine injection into the vitreous chamber. The a-wave recorded from dark adapted retinas showed a significant increase in amplitude after injection of adenosine in response to all stimuli tested, as illustrated by Fig. 1B. The a-wave evoked with stimuli of the maximum luminance increased significantly from a mean of 68 ± 8 µV before drug injection to 97 ± 14 µV after injection (P = 0.042). Adenosine did not have any significant effect on the implicit time of the scotopic a-waves (P = 0.241) or b-waves (P = 0.06). When looking at the superimposed a-waves shown in Fig. 1A there appears to be a prolongation of the a-wave duration after adenosine injection. To test for this we measured the full width at half maximum of the a-wave. We found that the mean change in the full width of the a-wave before injection (13.4 ± 1.0 ms) and after adenosine injection (14.0 ± 1.4 ms) was nonsignificant (P = 0.247). The b-wave recorded from dark adapted retinae showed an increase in amplitude in response to adenosine, as shown in Fig. 1A. Fig. 1C presents the mean amplitudes of the scotopic b-waves at all four stimuli intensities used. The figure indicates that the adenosine-induced increase in the b-wave occurred in responses to all stimulus intensities tested. The amplitude of the b-wave in response to stimuli of the brightest luminance (1.87 log cd s/m2) changed from a mean of 236 ± 38 µV before injection to a mean of 305 ± 42 µV after injection, a statistically significant increase (P = 0.035). The amplitude of the OPs did not change significantly with adenosine (P = 0.912). The amplitude of the photopic ERG did not change significantly after intravitreal injection of adenosine, neither the b-wave in response to single flashes (P = 0.541) nor 15 Hz flicker (P = 0.781, data not shown). The implicit time of the photopic b-wave was not significantly affected by adenosine (P = 0.49).
The effect of 0.5 mM adenosine on the ERG of the dark adapted rat retina. (A) Representative ERG recordings in response to stimuli of 1.87 log cd s/m2 in luminance before (black trace) and after (red trace) injection of adenosine into the vitreous. (B) The relationship between the mean amplitude of the ERG a-wave and stimulus luminance, before (open symbols) and after (closed symbols) intravitreal injection of adenosine. Asterisk (*) above symbols indicates a statistically significant increase in amplitude. (C) The mean amplitude of the ERG b-wave as a function of stimulus luminance, before (open symbols) and after (closed symbols) intravitreal injection of adenosine. Note asterisk (*) above the symbols indicating a significant increase in the b-wave amplitude (n = 6).

The effects of A2A receptor ligands on the rat ERG
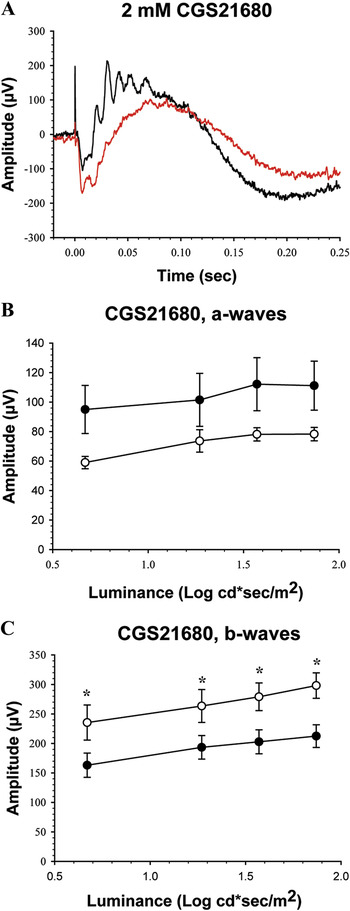
To assess the putative role of A2A receptors in modulating the rat ERG, the A2A agonist CGS21680 was tested on 6 rat eyes at a concentration of 2 mM. Fig. 2A shows examples of scotopic ERG recordings from one eye, evoked with stimuli of maximum luminance, before and after 2 mM CGS21680 injection into the vitreous humor. Fig. 2B depicts mean amplitudes of scotopic ERG a-waves in response to four stimulus intensities. The a-wave of the ERG recorded from dark adapted retinas did not significantly change in amplitude after injection of CGS21680, in response to any stimuli. The mean full width of the a-wave at half-maximum amplitude, evoked by the brightest stimuli, increased significantly (P = 0.034) from 13 ± 1 ms in control to 17 ± 4 ms after CGS21680 injection. The b-wave recorded from dark adapted retinas significantly decreased in amplitude at all luminances tested, as shown in Fig. 2C. In response to stimuli of the highest luminance (1.87 log cd s/m2), the amplitude changed from a mean of 298 ± 21 µV before injection to 212 ± 19 µV after injection, a significant reduction (P = 0.005). CGS21680 had nonsignificant effects on the implicit times of the scotopic a-waves (P = 0.176) and b-waves (P = 0.10).
The effect of 2 mM CGS21680 on the ERG a- and b-waves of the dark adapted rat retina. (A) Representative ERG recordings in response to stimuli of 1.87 log cd s/m2 in luminance before (black trace) and after (red trace) injection of CGS21680 into the vitreous. (B) The relationship between the mean amplitude of the ERG a-wave and stimulus luminance, before (open symbol) and after (closed symbol) intravitreal injection of CGS21680. Note that the increase in amplitude did not reach statistical significance. (C) The mean amplitude of the ERG b-wave as a function of stimulus luminance, before (open symbol) and after (closed symbol) injection of CGS21680. Asterisk (*) above symbols indicates a statistically significant reduction in amplitude (n = 6).

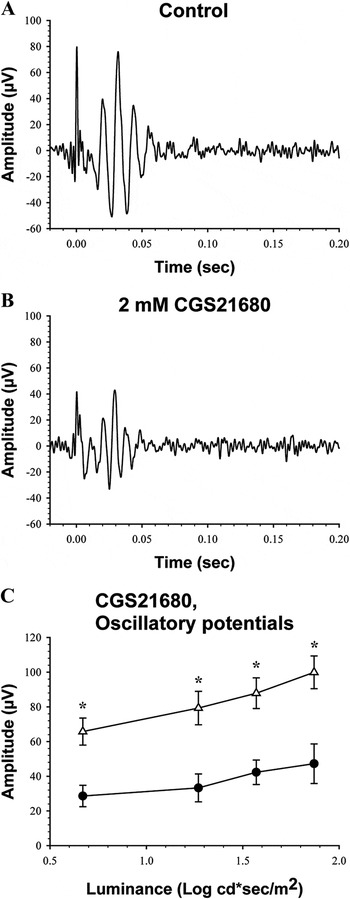
The OPs also decreased in amplitude with CGS21680, as shown in Fig. 3. Examples of OPs recorded before CGS21680 injection are shown in Fig. 3A, and after injection in Fig. 3B, both in response to stimuli of 1.87 log cd s/m2 in luminance. The mean amplitude of OPs evoked by the brightest stimuli decreased from 100 ± 9 µV before injection to 47 ± 11 µV after, which was significant reduction (P = 0.023). Fig. 3C shows that the amplitude of the OPs was significantly reduced at all levels of stimulus luminance after injection of CGS21680 into the vitreous.
The effect of 2 mM CGS21680 on the ERG OPs of the dark adapted rat retina. (A) Representative OPs recorded before application of CGS21680 in response to a stimulus of 1.87 log cd s/m2 in luminance. (B) OPs recorded 1 h after injection of CGS21680 into the vitreous, in response to the same stimulus as in A. (C) The relationship between the amplitude of the ERG OPs and stimulus luminance, before (open symbols) and after (closed symbols) intravitreal injection of CGS21680. Asterisk (*) above symbols indicates a statistically significant reduction in amplitude (n = 6).

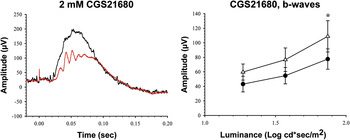
The b-wave of the ERG recorded from light adapted retinas decreased in amplitude after vitreal injection of CGS21680. The left panel of Fig. 4 shows photopic ERG responses recorded before and after injection of 2 mM CGS21680 into the vitreous, which decreases the amplitude of the response. As shown in the right panel in Fig. 4, there was only a significant statistical difference between the amplitude of the control ERG b-wave and the b-wave in response to the brightest stimuli after injections of CGS21680 (P = 0.045), with a decrease from a mean of 124 ± 18 µV before injection, to 88 ± 11 µV after injection. The implicit time of the photopic b-wave was not significantly affected by CGS21680 (P = 0.256). The mean amplitude of the photopic OPs evoked by the brightest stimulus was significantly increased by CGS21680, from 12 ± 1 µV before injection to 21 ± 4 µV after injection (P = 0.041). The mean ERG response to 15 Hz flicker was not significantly changed by CGS21680 (P = 0.110; recordings not shown).
The effect of 2 mM CGS21680 on the ERG b-wave of the light adapted rat retina. The left panel shows representative ERG recordings in response to stimuli of 1.87 log cd s/m2 in luminance before (black trace) and after (red trace) injection of CGS21680 into the vitreous, recorded in the presence of a steady 1.7 log cd/m2 light adapting background. The right panel shows the relationship between the amplitude of the ERG b-wave and stimulus luminance, before (open symbols) and after (closed symbols) intravitreal injection of CGS21680. Asterisk (*) above symbols indicates a statistically significant reduction in amplitude, in this case only at the highest luminance (n = 6).

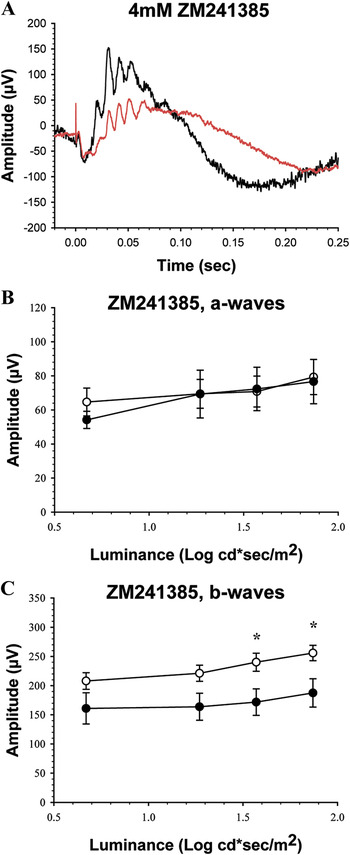
We then tested the A2A receptor antagonist ZM241385 at a concentration of 4 mM on 6 eyes. Fig. 5A illustrates examples of scotopic ERG responses recorded in response to the brightest stimulus before and after injection of 4 mM ZM241385. Application of ZM241385 had no effect on the mean amplitude of the a-wave recorded from dark adapted retinas (79 ± 10 µV before injection to 77 ± 13 µV after injection at 1.87 log cd s/m2, P = 0.876, Fig. 5B). Fig. 5B shows that the amplitude of the a-wave did not change significantly regardless of the stimulus luminance used. The mean amplitudes of the scotopic ERG b-wave in response to all stimulus luminances tested before and after injection of ZM241385 into the vitreous are shown in Fig. 5C. Application of ZM241385 significantly reduced the mean amplitude of the scotopic b-wave (256 ± 13 µV before injection to 187 ± 24 µV after injection at 1.87 log cd s/m2, P = 0.046, Fig. 5C). As shown in Fig. 5C, in this series of experiments with 6 eyes, ZM241385 had a significant effect on the b-wave at two of the highest stimulus luminances tested. Application of ZM241385 had no effect in this series of experiments on the scotopic OPs at any stimulus levels tested (74 ± 6 µV before injection to 46 ± 8 µV after injection, at 1.87 log cd s/m2, P = 0.067).
The effect of 4 mM ZM241385 on the ERG a- and b-waves of the dark adapted rat retina. (A) Representative ERG recordings obtained in response to stimuli of 1.87 log cd s/m2 in luminance before (black trace) and after (red trace) injection of ZM241385 into the vitreous. (B) The relationship between the amplitude of the ERG a-wave and stimulus luminance, before (open symbols) and after (closed symbols) intravitreal injection of ZM241385. (C) The mean amplitude of the ERG b-wave as a function of stimulus luminance, before (open symbols) and after (closed symbols) intravitreal injection of ZM241385. Asterix (*) indicates a statistically significant decrease in amplitude (n = 6).

Injection of ZM241385 had no effect on the photopic b-wave amplitude at any level of stimulus luminance (mean amplitude 136 ± 23 µV before injection to 103 ± 14 µV after injection, at 1.87 log cd s/m2, P = 0.219). The mean amplitude of the photopic OPs in the response to the brightest stimulus remained identical before and after injection of ZM241385, at 15 µV (P = 0.892). Application of ZM241385 had no effect on the mean amplitude of the photopic ERG flicker response (69 ± 9 µV before injection to 48 ± 7 µV after, P = 0.097; recordings not shown).
The effects of A3 receptor ligands on the rat ERG
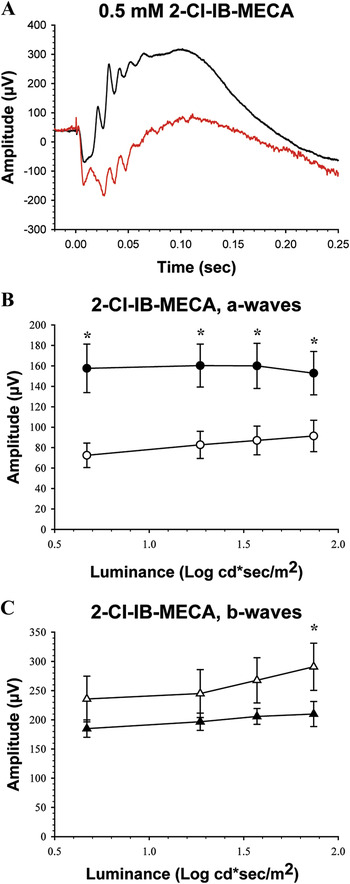
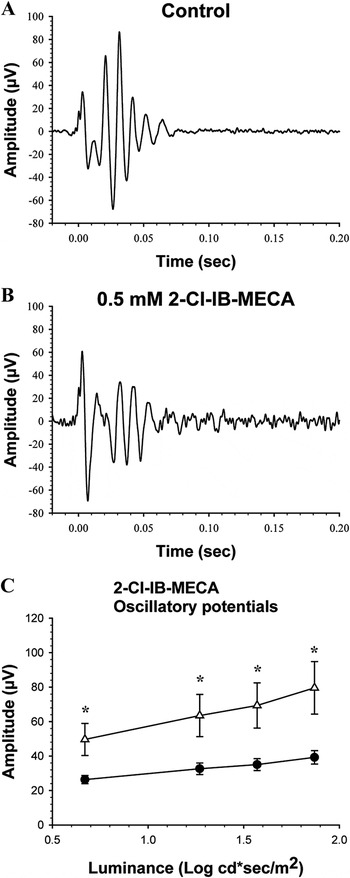
To address the putative role of A3 adenosine receptors 2-Cl-IB-MECA, which is a selective agonist for A3 receptors, was tested on 6 eyes at a concentration of 0.5 mM. Fig. 6A shows an example of recordings from one eye, in response to stimuli at a luminance of 1.87 log cd s/m2, before and after 2-Cl-IB-MECA injection into the vitreous humor. The recordings indicate that there is a reduction in the amplitude of the scotopic b-wave and the OPs, while the a-wave is increased in amplitude by the drug. The amplitude of the a-wave of the ERG recorded from dark adapted retinas showed an increase which was significantly different statistically from control (P = 0.006). When evoked with stimuli of the brightest luminance (1.87 log cd s/m2) the mean amplitude of the scotopic a-wave increased from 91 ± 15 µV before injection to 153 ± 21 µV after injection (Fig. 6B). The mean implicit time of the scotopic a-wave was significantly shortened by 2-Cl-IB-MECA, from 9.4 ± 1.4 to 8.5 ± 1.1 ms (P = 0.027). The b-wave of the ERG recorded from dark adapted retinas decreased in amplitude after intravitreal injection of 2-Cl-IB-MECA. In response to the brightest stimuli, the mean amplitude of the scotopic ERG b-wave was 291 ± 40 µV before injection, but was reduced to a mean of 210 ± 21 µV after drug injection (P = 0.022), without any significant effect on the implicit time of the b-wave (P = 0.46). A statistically significant difference between the scotopic b-waves before and after injection of 2-Cl-IB-MECA was only found in ERG responses evoked by the brightest stimuli (Fig. 6C). The A3 receptor agonist 2-Cl-IB-MECA also reduced the amplitude of the OPs, measured separately from these ERG responses with the bandwidth set at 50–500 Hz. Fig. 7A shows an example of OPs evoked with stimuli of the brightest luminance (1.87 log cd s/m2) before intravitreal injection of 0.5 mM 2-Cl-IB-MECA, and Fig. 7B after injection from the same eye. The mean amplitude of the OPs in response to the highest stimulus luminance was 79.6 ± 15.2 µV before injection, and decreased to 39 ± 4 µV after injection, a significant change (P = 0.038). As indicated by Fig. 7C there was a significant decrease in the amplitude of OPs (the oscillatory index) evoked by any of the stimuli after injection of 2-Cl-IB-MECA into the vitreous.
The effect of 0.5 mM 2-Cl-IB-MECA on the ERG a- and b-waves of the dark adapted rat retina. (A) Representative ERG recordings obtained in response to stimuli of 1.87 log cd s/m2 in luminance before (black trace) and after (red trace) injection of 2-Cl-IB-MECA into the vitreous. (B) The relationship between the amplitude of the ERG a-wave and stimulus luminance, before (open symbols) and after (closed symbols) intravitreal injection of 2-Cl-IB-MECA. Asterisk (*) above symbols indicates a statistically significant increase in amplitude, in this case to all stimuli (n = 6). (C) The mean amplitude of the ERG b-wave as a function of stimulus luminance, before (open symbols) and after (closed symbols) intravitreal injection of 2-Cl-IB-MECA. Note the significant decrease in amplitude is indicated by an asterisk (*) above symbols, but only at the highest luminance (n = 6).

The effect of 0.5 mM 2-Cl-IB-MECA on the ERG OPs of the dark adapted rat retina. (A) Representative OPs recorded before application of 2-Cl-IB-MECA in response to a stimulus of 1.87 log cd s/m2 in luminance. (B) OPs obtained 1 h after injection of 2-Cl-IB-MECA into the vitreous, in response to the same stimulus as in A. (C) The mean amplitude of the scotopic ERG OPs as a function of stimulus luminance, before (open symbols) and after (closed symbols) intravitreal injection of 2-Cl-IB-MECA. Asterisk (*) above symbols indicates a statistically significant reduction in amplitude of the OPs (n = 6).

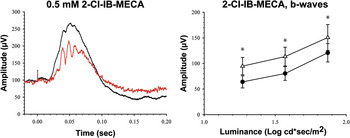
The left panel of Fig. 8 depicts samples of photopic ERG b-waves before and after intravitreal injection of 2-Cl-IB-MECA, where the drug induced a reduction in the b-wave amplitude. The mean amplitudes of the b-waves of the photopic ERG in response to all three stimulus luminances are depicted in the right panel of Fig. 8. The mean amplitude of the ERG b-wave recorded from light adapted retinas in response to stimuli of 1.87 log cd s/m2 in luminance was 170 ± 19 µV before injection and 136 ± 11 µV after injection of 2-Cl-IB-MECA, a statistically significant decrease (P = 0.037). The mean implicit time of the photopic b-wave before injection of 2-Cl-IB-MECA was 55 ± 8 ms, and increased to 63 ± 12 ms after injection, a significant increase (P = 0.035). The right panel of Fig. 8 shows that injection of 2-Cl-IB-MECA into the vitreous caused a statistically significant reduction in the photopic b-wave of the ERG responses evoked by all stimulus luminances tested (P < 0.05). The mean amplitude of the photopic OPs in response to stimuli of 1.87 log cd s/m2 in luminance changed from 15 ± 2 to 26 ± 4 µV after 2-Cl-IB-MECA injection, a significant increase (P = 0.03). The mean amplitude of the ERG 15 Hz flicker responses to stimuli of 1.57 log cd s/m2 in mean luminance did not change significantly after injection of 2-Cl-IB-MECA (P = 0.368; recordings not shown).
The effect of 0.5 mM 2-Cl-IB-MECA on the ERG b-wave of the light adapted rat retina. The left panel shows representative ERG recordings in response to stimuli of 1.87 log cd s/m2 in luminance before (black trace) and after (red trace) injection of 2-Cl-IB-MECA into the vitreous, in the presence of a continuous 1.7 log cd/m2 light adapting background. The right panel shows the relationship between the mean amplitude of the photopic ERG b-wave and stimulus luminance, before (open symbols) and after (closed symbols) intravitreal injection of 2-Cl-IB-MECA. Asterisk (*) above symbols indicates a statistically significant reduction in b-wave amplitude (n = 6).

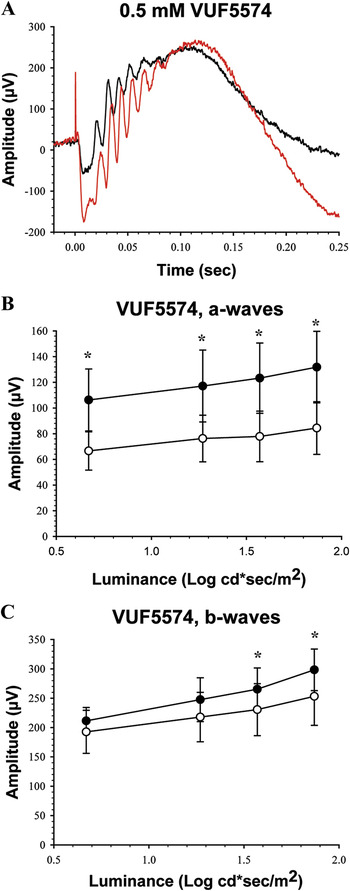
The A3 adenosine receptor antagonist VUF5574 was then tested on 6 eyes at a concentration of 1 mM. Fig. 9A shows examples of recordings from one eye, in response to the brightest stimulus before and after VUF5574 injection into the vitreous humor, illustrating that the drug induced an increase in the amplitude of the ERG. The a-wave of the ERG recorded from dark adapted retinas increased in amplitude after injection of VUF5574 (Fig. 9A). Fig. 9B shows that this increase was observed in response to all stimulus luminances tested. The mean amplitude of the scotopic ERG a-wave evoked with stimuli of the brightest luminance (1.87 log cd s/m2) increased from 66 ± 8 µV before injection to 140 ± 29 µV after injection, a statistically significant increase (P = 0.046). The b-wave recorded from dark adapted retinas increased in amplitude after VUF5574 (Fig. 9C). The mean amplitude of the b-wave evoked by 1.87 log cd s/m2 stimuli increased from 224 ± 20 µV before injection to 312µV ± 39 µV after injection. The increase in the amplitude of the b-wave by VUF5574 was significant statistically (P = 0.037). The implicit times of the a-wave (P = 0.256) and b-wave (P = 0.089) did not change significantly after VUF5574. Injection of VUF5574 had no effect on the OPs (mean amplitude from 84 ± 16 µV before injection to 98 ± 19 µV after injection at 1.87 log cd s/m2, P = 0.315; recordings not shown).
The effect of 0.5 mM VUF5574 on the ERG of the dark adapted rat retina. (A) Representative ERG recordings in response to stimuli of 1.87 log cd s/m2 in luminance before (black trace) and after (red trace) injection of VUF5574 into the vitreous. (B) The relationship between the mean amplitude of the ERG a-waves and stimulus luminance, before (open symbols) and after (closed symbols) intravitreal injection of VUF5574. Asterisk (*) above the symbols indicates a significant increase in amplitude, in this case at all stimuli. (C) The mean amplitude of the ERG b-wave as a function of stimulus luminance, before (open symbols) and after (closed symbols) intravitreal injection of VUF5574. Note significant increase in amplitude indicated by asterisk (*) above symbols (n = 6).

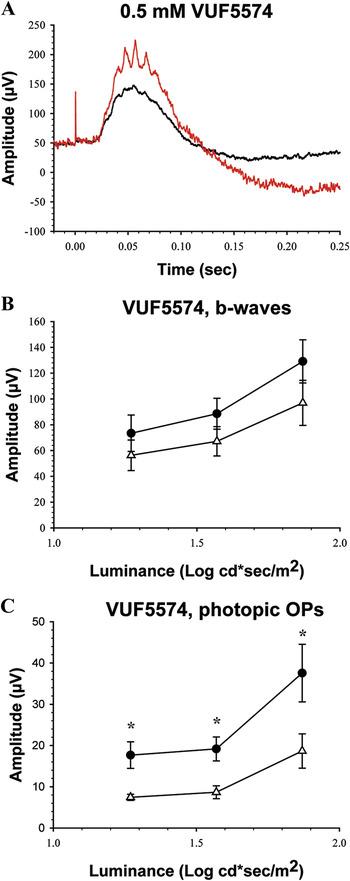
Examples of the ERG recorded from a light adapted retina, evoked with stimuli of 1.87 log cd s/m2 in luminance before and after intravitreal injection of VUF5574 are shown in Fig. 10A. The application of VUF5574 had no effect on the mean photopic ERG b-wave amplitude (122 ± 19 µV before injection to 156 ± 10 µV after injection at 1.87 log cd s/m2, P = 0.098). Fig. 10B shows the mean photopic b-wave amplitude in response to all stimulus luminances tested after intravitreal injection of VUF5574, and as Fig. 10B indicates the change was in no case statistically significant. The implicit time of the photopic b-wave did not change significantly after intravitreal injection of VUF5574 (P = 0.43). The mean amplitude of the photopic OPs evoked with 1.87 log cd s/m2 stimuli increased significantly from 18 ± 4 µV before injection to 37 ± 7 µV after injection (P = 0.045), and in fact with all stimulus luminance levels tested, as indicated in Fig. 10C. The mean amplitude of the photopic ERG 15 Hz flicker responses to stimuli of 1.57 log cd s/m2 in mean luminance did not change significantly with injection of VUF5574 (P = 0.48; recordings not shown).
The effect of 0.5 mM VUF5574 on the ERG of the light adapted rat retina. (A) Representative photopic ERG recordings in response to stimuli of 1.87 log cd s/m2 in luminance before (black trace) and after (red trace) injection of VUF5574 into the vitreous. (B) The relationship between the mean amplitude of the photopic ERG b-wave and stimulus luminance, before (open symbols) and after (closed symbols) intravitreal injection of VUF5574. (C) The mean amplitude of the photopic ERG OPs as a function of stimulus luminance, before (open symbols) and after (closed symbols) intravitreal injection of VUF5574. Asterisk (*) above symbols indicates a statistically significant reduction in amplitude of the OPs (n = 6).

Discussion
Exogenous adenosine increases the amplitude of the rat ERG
Endogenous adenosine has been found to be present in the photoreceptors of various species (Blazynski, Reference Blazynski1990; Paes de Carvalho et al., Reference Paes de Carvalho, Braas, Snyder and Adler1990; Rey & Burnside, Reference Rey and Burnside1999; Stella et al., Reference Stella, Bryson and Thoreson2002, Reference Stella, Hu, Vila and Brecha2007), and inner retinal neurons including horizontal cells, amacrine cells, and ganglion cells (Braas et al., Reference Brass, Zarbin and Snyder1987; McIntosh & Blazynski, Reference McIntosh and Blazynski1994; Studholme & Yazulla, Reference Studholme and Yazulla1997; Zhang et al., Reference Zhang, Budak, Lu, Khurana, Zhang, Laties and Mitchell2006). There is a tonic release of adenosine from the retina, which is dependent on light and dark adaptation, with higher release in the dark (Paes de Carvalho et al., Reference Paes de Carvalho, Braas, Snyder and Adler1990; Blazynski & Perez, Reference Blazynski and Perez1991; Ribelayga & Mangel, Reference Ribelayga and Mangel2005). In the amphibian retina adenosine modulates the opening of L-type Ca2+ channels on rod (Stella et al., Reference Stella, Bryson and Thoreson2002) and cone terminals (Stella et al., Reference Stella, Hu, Vila and Brecha2007), and the exocytosis of glutamate from cone terminals (Stella et al., Reference Stella, Hu and Brecha2009). As found in cat retinae (Blazynski et al., Reference Blazynski, Cohen, Fruh and Niemeyer1989; Macaluso et al., Reference Macaluso, Frishman, Frueh, Kaeling-Lang, Onoe and Niemeyer2003), we find that applying adenosine to the rat retina increases the amplitude of the scotopic b-wave of the ERG. In addition, a marked increase in the amplitude of the a-wave of the rat ERG was found. The increase in the amplitude of the a-wave may be caused by the effects of adenosine on receptors on second order retinal neurons, or on photoreceptors (Stella et al., Reference Stella, Bryson, Cadetti and Thoreson2003, Reference Stella, Hu, Vila and Brecha2007). Still, adenosine or ligands on adenosine receptors do not appear to have any effect on the light-evoked change in the photocurrent of photoreceptors (Stella et al., Reference Stella, Bryson, Cadetti and Thoreson2003), which are presumably the source of the leading edge of the a-wave (Robson & Frishman, Reference Robson and Frishman1998). But the mammalian ERG a-wave is not merely a reflection of photoreceptor activity (Bush & Sieving, Reference Bush and Sieving1994; Dang et al., Reference Dang, Tsai, Vingrys and Bui2011), as there are contributions from the inner retina to its generation (Robson & Frishman, Reference Robson and Frishman1998; Robson et al., Reference Robson, Saszik, Ahmed and Frishman2003; Dang et al., Reference Dang, Tsai, Vingrys and Bui2011). Another process that may be involved is the decrease in the release of l-glutamate from photoreceptors induced by adenosine (Stella et al., Reference Stella, Bryson and Thoreson2002, Reference Stella, Bryson, Cadetti and Thoreson2003), and the changes that then occur in the dark membrane potential and light-evoked activity of secondary retinal neurons perhaps accounts for its effects on the a- and b-waves. The problem is that it is not known what direct effects adenosine has on the light evoked activity of secondary neurons, while there is evidence that the b-wave is modulated by both ON-bipolar cells and amacrine cells (Stockton & Slaughter, Reference Stockton and Slaughter1989; Awatramani et al., Reference Awatramani, Wang and Slaughter2001; Möller & Eysteinsson, Reference Möller and Eysteinsson2003; Bui & Fortune, Reference Bui and Fortune2004), so it is difficult to determine at this point which of these processes are likely to mediate the increase induced by adenosine.
While it is well established that adenosine affects the light responses of retinal ganglion cells (Kaelin-Lang et al., Reference Kaelin-Lang, Jurklies and Niemeyer1999; Sun et al., Reference Sun, Barnes and Baldridge2002; Macaluso et al., Reference Macaluso, Frishman, Frueh, Kaeling-Lang, Onoe and Niemeyer2003; Hartwick et al., Reference Hartwick, Lalonde, Barnes and Baldridge2004; Clark et al., Reference Clark, Kurth-Nelson and Newman2009; Sodhi & Hartwick, Reference Sodhi and Hartwick2014; Zhang et al., Reference Zhang, Budak, Lu, Khurana, Zhang, Laties and Mitchell2006, Reference Zhang, Hu, Zhang, Lu, Lim, Eysteinsson, Jacobson, Laties and Mitchell2010), its effects on retinal amacrine cell function is virtually unknown. The ERG OPs are believed to reflect primarily light-evoked amacrine cell activity (Wachtmeister, Reference Wachtmeister1998), and we found that exogenously applied adenosine has no significant effect on these wavelets recorded from the rat retina. However, more specific ligands with affinities for subpopulations of adenosine receptors had significant effects on the OPs. In the dark adapted retina, the extracellular level of endogenous adenosine is high (Ribelayga & Mangel, Reference Ribelayga and Mangel2005), so it is possible that the exogenous dose was not sufficient to alter the activity of the inner retinal neurons generating the OPs.
The role of A2A receptors in modulating retinal light responses
The localization of the A2A receptor in the retina has been examined in several vertebrate species, including rat (Blazynski & Perez, Reference Blazynski and Perez1991; Huang et al., Reference Huang, Hsiao, Kao, Chen, Chen, Chiang, Lee, Lu, Chern and Wang2014). A2A receptors are localized on photoreceptors and in the inner retina, including starburst amacrine cells and retinal ganglion cells of the rat retina (Blazynski, Reference Blazynski1990; Stella et al., Reference Stella, Bryson and Thoreson2002; Wang et al., Reference Wang, Blankenship, Anishchenko, Elstrott, Fikhman, Nakanishi and Feller2007; Huang et al., Reference Huang, Hsiao, Kao, Chen, Chen, Chiang, Lee, Lu, Chern and Wang2014). In tiger salamander retinal slices, the A2A agonist CGS21680 reduces the light-evoked currents of secondary retinal neurons (horizontal and bipolar cells), while the A2A antagonist ZM21438 increases the amplitude of the light-evoked currents (Stella et al., Reference Stella, Bryson, Cadetti and Thoreson2003). But these effects of the A2A receptor ligands are considered secondary to their effects on photoreceptor transmitter release, rather than due to any direct effects on A2A adenosine receptors on secondary neurons (Stella et al., Reference Stella, Bryson, Cadetti and Thoreson2003). One issue of concern is species differences in the selectivity of these ligands, and thus whether the dose of CGS21680 applied in the present experiments may have activated both the A2A and A3 receptors. In that case A3 receptor activation may completely or in part account for some of the results found. It is known that CGS21680 can distinguish between the A2A and A2B receptors selectively (Jacobson & Gao, Reference Jacobson and Gao2006; Muller & Jacobson, Reference Muller and Jacobson2011). However, its selectivity as an agonist on A2A receptors as compared to A3 receptors varies between mammalian species, from a low selectivity on human A2A and A3 receptors (K i values 27 and 67 nM, respectively; Jacobson & Gao, Reference Jacobson and Gao2006; Muller & Jacobson, Reference Muller and Jacobson2011), to a much higher on rat A2A and A3 receptors (K i values 15 and 584 nM, respectively; Gao et al., Reference Gao, Blaustein, Gross, Melman and Jacobson2003). Thus it is likely that most if not all the effects of CGS21680 found were mediated by activation of A2A receptors. We found that the A2A agonist CGS21680 affects both the scotopic and photopic b-waves of the rat ERG, while leaving the amplitude of the scotopic a-wave unaffected. It is still unclear whether there are A2A receptors, or indeed any adenosine receptors, on rat bipolar cells, although a broad adenosine agonist inhibits NMDA mediated currents into isolated rat bipolar cells, but the receptors involved are unknown (Costenla et al., Reference Costenla, De Mendonca, Sebastiao and Ribeiro1999). Since both scotopic and photopic b-waves are affected by CGS21680, it is likely that A2A receptors are present in both the rod and cone pathways in the retina. In the light adapted retinas, only the brightest light stimuli elicited a statistically significant change in the b-wave after injection of CGS21680. It seems that the effects A2A receptors have on the synapses in the cone pathway are restricted. It has been suggested that retinal ganglion cell activity is a major source of the photopic b-wave, since both optic nerve transection, and even more so application of tetrodotoxin (TTX), to block retinal action potentials, cause a substantial reduction of the rat photopic b-wave, which is also dependent on stimulus intensity (Bui & Fortune, Reference Bui and Fortune2004), although the effect of TTX on the b-wave may in part be due to blockage of voltage-gated sodium channels on cone bipolar cells (Mojumder et al., Reference Mojumder, Sherry and Frishman2008; Smith et al., Reference Smith, Tremblay and Cote2013). The changes in the amplitude of scotopic and photopic OP’s after single injection of CGS21680 further supports the suggestion that the A2A receptor is located in the inner retina, since both amacrine and bipolar cells have been associated with the generation of the OP’s (Wachtmeister, Reference Wachtmeister1998). The A2A receptor has been localized on starburst amacrine cells in developing rat retina (Huang et al., Reference Huang, Hsiao, Kao, Chen, Chen, Chiang, Lee, Lu, Chern and Wang2014) but its putative localization on other subtypes of adult rat retinal amacrine cells is yet unknown. It is however likely, based on the reduction of the OPs by CGS21680 found here, that either starburst amacrine cells contribute to the generation of scotopic OPs, or that there are other subtypes of amacrine cells containing A2A receptors in the rat retina that are involved in the generation of OPs. Whether A2A receptors are localized on other subtypes of amacrine cells is still unknown, but we consider it likely on the basis of the present findings.
The A2A antagonist ZM241385 had a significant effect on the scotopic b-wave and oscillatory potentials of the ERG, causing a reduction in these components, but not the photopic ERG components. ZM241385 is held to be quite selective for the A2A receptor in most tissue (Poucher et al., Reference Poucher, Keddie, Singh, Stoggall, Caulkett, Jones and Coll1995; Ralevic & Burnstock, Reference Ralevic and Burnstock1998). These results are however surprising, given findings from tiger salamander retinal slices, where it was found that ZM214385 enhanced the light evoked currents from secondary neurons, including the light evoked currents recorded from amphibian ON bipolar cells, while having no effects on the light responses of rods (Stella et al., Reference Stella, Bryson, Cadetti and Thoreson2003). There is evidence suggesting that ON bipolar cells contribute substantially to the generation of the b-wave (Stockton & Slaughter, Reference Stockton and Slaughter1989; Möller & Eysteinsson, Reference Möller and Eysteinsson2003; Bui & Fortune, Reference Bui and Fortune2004; Popova & Kupenova, Reference Popova and Kupenova2009). On that basis, we hypothesized that ZM241385 would have a marked effect on the scotopic b-wave, but in an opposite direction to the A2A receptor agonist. The findings that both the A2A receptor agonist and antagonist tested have similar effects on the scotopic b-wave and oscillatory potentials are therefore puzzling. It has been suggested that ZM241385 may not be acting as a pure A2A receptor antagonist in the rat retina (Wang et al., Reference Wang, Blankenship, Anishchenko, Elstrott, Fikhman, Nakanishi and Feller2007; Huang et al., Reference Huang, Hsiao, Kao, Chen, Chen, Chiang, Lee, Lu, Chern and Wang2014), but this issue needs further examination.
The role of A3 receptors in modulating retinal light responses
The A3 receptor has so far only been localized on ganglion cells in the rat retina (Zhang et al., Reference Zhang, Budak, Lu, Khurana, Zhang, Laties and Mitchell2006; Zhang et al., Reference Zhang, Hu, Zhang, Lu, Lim, Eysteinsson, Jacobson, Laties and Mitchell2010). We found that the A3 receptor agonist 2-Cl-IB-MECA decreased the amplitude of both the scotopic b-waves and OP’s. These results further support the suggestion that A3 receptors are located in the inner retina, but also raises the possibility that they may be localized on neurons there other than exclusively ganglion cells. The scotopic b-wave only decreased in amplitude in response to the brightest light stimuli after 2-Cl-IB-MECA injection, while the photopic b-wave decreased in amplitude at all stimulus light intensities. When the ERG response is evoked with the brightest stimuli from dark adapted eyes both rod and cone driven pathways in the retina are being activated, in the mesopic range, and thus activation of A3 receptors only seems to modulate ERG b-waves with significant cone contributions. The a-wave increased in amplitude with injection of 2-Cl-IB-MECA. This along with the fact that both the scotopic b-wave and OP’s decreased in amplitude, would suggest that the a-wave is being influenced by A3 receptors in the inner retina. It has been shown in mammals that the a-wave is influenced by post photoreceptor contributions (Robson & Frishman, Reference Robson and Frishman1998; Robson & Frishman, Reference Robson and Frishman2014), and these may mediate the effect of the A3 receptor agonist on the a-wave. We found that the photopic b-wave is significantly reduced by 2-Cl-IB-MECA, while the photopic OPs are increased. Retinal ganglion cells, and to some extent amacrine and interplexiform cells, contribute to the rat photopic b-wave and OPs, while the ganglion cells have almost no influence on scotopic ERG components even when evoked by bright flashes (Bui & Fortune, Reference Bui and Fortune2004; Mojumder et al., Reference Mojumder, Sherry and Frishman2008). Thus it is possible that the changes in the photopic ERG induced by the A3 receptor agonist were in part due to activation of these receptors on retinal ganglion cells, where they are known to modulate Ca2+ influx via NMDA receptors (Zhang et al., Reference Zhang, Hu, Zhang, Lu, Lim, Eysteinsson, Jacobson, Laties and Mitchell2010).
The A3 receptor antagonist VUF5574 increased the amplitude of the scotopic a- and b-waves, contrary to the effects of the A3 receptor agonist. There is evidence indicating that amacrine cells have a modulatory influence on the scotopic b-wave, reducing its amplitude (Awatramani et al., Reference Awatramani, Wang and Slaughter2001; Dong & Hare, Reference Dong and Hare2002; Möller & Eysteinsson, Reference Möller and Eysteinsson2003). Amacrine cells primarily release inhibitory neurotransmitters (Zhang & McCall, Reference Zhang and McCall2012), so perhaps the A3 receptor is somehow modulating that inhibition. VUF5574 also induced changes in the amplitude of the photopic b-wave and OPs, and ERG flicker responses, although only the increase in the photopic OPs reached statistical significance. A possible explanation for the increase is that under light adapted conditions, the extracellular level of adenosine is much reduced as compared to that in the dark (Ribelayga & Mangel, Reference Ribelayga and Mangel2005), and thus activation of A3 receptors on ganglion cells is lower under photopic conditions. Blocking the A3 receptors with an antagonist like VUF5574 would then have a proportionately lesser effect on the activity of neurons with these receptors under photopic than scotopic conditions, and thus the photopic ERG response. The A3 agonist 2-Cl-IB-MECA has a 2500- and 1400-fold selectivity for rat A3 in comparison to the A1 and A2A adenosine receptors (Jacobson, Reference Jacobson1998; Muller & Jacobson, Reference Muller and Jacobson2011). The A3 antagonist VUF5574 has been found to be highly selective for that receptor subtype, and with a low affinity for adenosine A1 and A2A receptors (van Muijlwijk-Koezen et al., Reference van Muijlwijk-Koezen, Timmerman, van der Goot, Menge, Kunzel, de Groote and Ijzerman2000; Muller & Jacobson, Reference Muller and Jacobson2011). It is thus likely that the effects of the A3 receptor agonist and antagonist tested on the rat ERG were mediated exclusively by the A3 receptor, and then most probably on neurons in the inner retina, which is supported by the significant increase found in the photopic OPs induced by VUF5574.
Acknowledgments
This work was supported by grants from the University of Iceland Research Fund, and the Helga Jónsdóttir and Sigurliði Kristjánsson Memorial Fund.