1 Introduction
The acceleration of ageing in the coming years and the permanence of this phenomenon over the long term will exert pressure on all pension schemes. While the fact of population ageing is common to all developed countries, extent and timing differ substantially. When considering Europe specifically, the relative drop in the working age population related to the number of pensioners will probably translate into a decrease in the return of pension schemes, be they funded or the pay-as-you-go type (PAYG). Against this background, all EU countries have adopted more or less ambitious reforms of their pension systems. Moreover, demographic changes, along with changes in the labor market and pension reforms, will deeply affect saving behaviors and intra-European capital flows.
In a world of closed economies, differential ageing would generate additional international differences in saving rates, investment, and rates of return. These differences are likely to be accentuated when some countries implement pension reforms, such as more pre-funding schemes. In reality, we do not have closed economies, but a global capital market. To the extent that capital is internationally mobile, population ageing will therefore induce capital flows between countries, and these capital flows would modify the impact of ageing. More specifically, differences in time profiles of demographic change suggest that capital flows could improve the economic consequences of ageing compared to a situation of economic and financial autarky. The main strength of the paper is to show the importance of international financial integration, contrasting the impact of pension systems on interest rates in financially closed and open economies.
In recent years, various quantitative tools have been developed in order to study the economic consequences of population ageing and pension reforms. Partial equilibrium models rely on mechanical projections of demographics and macroeconomic environment (activity, unemployment, productivity, and factor returns). Among these models, some have a purely accounting vocation such as the model of Bac et al. (Reference Bac, Bonnet, Bontout and Cornilleau2003) or more generally the numerous generational accounting studies (see Auerbach et al., Reference Auerbach, Kotlikoff and Leibfritz1999, for example). These studies implicitly assume a representative agent and a constant efficient labor to capital ratio, so as to analyze the impact of parametric reforms of pension systems on public budget sustainability. Micro-simulation models, such as Destinie (1999), analyze all individual paths of a population of agents in relation to changes in contributions and pension benefits. Unlike other methods, micro-simulation techniques provide a simultaneous description of intergenerational and intragenerational transfers.
The second class of model is constituted of general equilibrium models. Most of them have rigorous microeconomic foundations and follow the pioneering work of Auerbach and Kotlikoff (Reference Auerbach and Kotlikoff1987). Assuming exogenous population projections, the economic dynamic is entirely explained by the rational choices of optimizing agents and particularly by their life-cycle saving patterns. The main shortcoming of these models consists in their extreme complexity, which limits the possibility of introducing individual heterogeneity in a cohort as in micro-simulation models. As a consequence, in most general equilibrium models, pension systems cannot be modeled in a very accurate way and the links between institutional changes, labor markets, career profiles, and unemployment rate are not taken into account.
Another failure of most general equilibrium models is that the European dimension is not studied. For instance, during the demographic transition, the mix between PAYG and fully funded pensions schemes within European countries will induce different saving behaviors in the different countries. This will imply large capital flows between countries in order to equalize the interest rate in the single capital market. Most analyses of pension reforms, whether they use the general equilibrium model or not, have been conducted with closed economy models under the assumption of economic and financial autarky. Here, we present a quantitative analysis of the impact of differential ageing and pension reforms across European countries on capital and labor market and, in particular, on intra-European capital flows. This rich modeling framework allows us to stress the ‘triangular’ relationship between population ageing, pension reforms, and international capital markets, which receive increasing attention in the academic literature, see Kenc and Sayan (Reference Kenc and Sayan2001), Brooks (Reference Brooks2003), Börsch-Supan et al. (Reference Börsch-Supan, Ludwig and Winter2006), Aglietta et al. (Reference Aglietta, Chateau, Fayolle, Juillard, Le Cacheux, Le Garrec and Touzé2007), and Krueger and Ludwig (Reference Krueger and Ludwig2007).
Contrary to these models, we develop the institutional structure of pension systems in detail, like most purely accounting studies. To this end, we develop a stylized general equilibrium model with overlapping generations of heterogeneous agents for the three largest European countries: France, Germany, and the United Kingdom (UK). The model presents a structure halfway between, on the one hand, pure general equilibrium models with rigorous microeconomic foundations, and, on the other hand, accounting models where the macroeconomic environment remains exogenous, as in Blanchet (Reference Blanchet1992). In addition to their age, consumers are characterized by their gender and their professional status (executive, non-executive, or civil servant), in order to replicate the various existing pension schemes in each country. Three polar assumptions about economic openness are successively handled. In the first case, the economies are closed and the rate of return to capital adjusts in order to clear the domestic capital market. In the second case, the economies are fully open and the rate of return to capital is taken as a given. In the third case, the economies are integrated in a financial area with perfect capital mobility within the area but no capital mobility toward the rest of the world.
The aim of this paper is to show that the dynamics of capital accumulation and pension system sustainability are totally different depending on the assumption concerning economic openness. In a world of closed economies, differential ageing generates differences in rates of return that are likely to be accentuated by implemented reforms. Indeed, by raising the interest rate, increasing financing needs of pension systems have a negative impact on capital accumulation, hence on growth. In contrast, the small open economy environment is close to the accounting approach adopted in most public reports since debt accumulation does not influence the interest rate. The deficits of pension systems then translate into large capital inflows since it is assumed that each economy always finds financial resources at a fixed interest rate. Capital flows are significantly smaller in the intermediate case where capital is perfectly mobile between the three European countries but immobile from the countries to the rest of the world. Indeed, the three countries cannot simultaneously benefit from positive capital inflows, as in the small open economy case, so as to finance their public debt. The consequences of ageing are then shared between the three countries through a common interest rate. In order to underline possible uses of the model, we will also present various kinds of variants.
The remainder of this study is structured as follows. Section 2 presents the demographic bloc of the model as well as the assumptions made on activity rates. Section 3 introduces the macroeconomic model and the calculation of individual income. Section 4 describes the pension schemes of the three countries. Section 5 discusses the equilibrium conditions of the model and a number of aspects of the calibration process. Section 6 comments on our results for several pension policies and capital mobility scenarios. In the appendix, we test the sensibility of our results to different assumptions on labor market participation and labor productivity.
2 The demographic blocFootnote 1
For each period of time, different generations g coexist and are at different stages of their life cycle. Individuals are also characterized by their gender, s, and their professional status, c. At each date, we consider individuals aged 0–105 and the generations concerned by the model are all those born between 1894 and 2049. The age of each individual is simply defined at date t by: a(t, g)=t−g.
Total population evolution
The size of the population of type (g, s) at time t before 2000 is based on historical official statistics. For future decades, the model uses the demographic projections until 2050 of INSEE (Robert-Bobée, Reference Robert-Bobée2006) for France and projections of Eurostat for the two other countries.
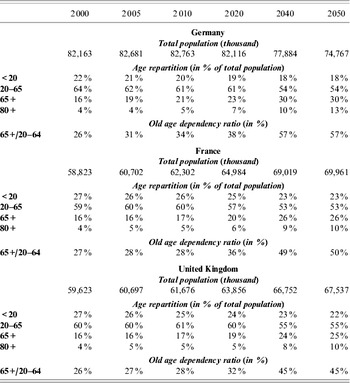
Demographic projections are shown in Table 1. In common with most OECD countries, our three countries have an ageing population. Germany is clearly more affected by ageing than the two other countries. For example, its population quickly decreases and will be reduced by almost 10% over the next 50 years. The reduction in the working age population begins around 2005 in Germany; 2010 in France and the UK. Ageing is less marked in the UK: the old age dependency ratio (i.e. the ratio of people aged more than 65 to people aged 20–64) is currently 26% in the UK and is expected to be 32% in 2020 and 45% in 2050. Nevertheless, it should be noted that France and Germany are more severely affected by ageing. Indeed, the old age dependency ratio is expected to be almost 50% in 2050 in France and 57% in Germany. The resulting demographic ageing raises several issues for pension schemes, since the burden of the retirees will grow spectacularly as the baby-boom generations retire during the next years of the century.
Population projection for the period 2000–2005

Source: Eurostat, Insee.
Working age population
In order to replicate the existing pension schemes in each country, the workers are characterized by their professional status (c): executives (‘ca’), non-executives (‘nc’), and civil servants (‘f’). Actually, individuals of class (g, s, c) are represented at each period of time by a representative individual. This representative agent is thus simultaneously employed–unemployed and inactive. The size of the population of type (g, s, c) at period t is denoted by N(t, g, s, c).
Distribution by professional status
By fixing the shares of population and activity rates by professional status, we try to reproduce the main features of the past and current population of our three countries. For France, our model reproduces a share of executives in the total number of private employment rising from 12.1% in 1971 to 21% in 2000Footnote 2 and reaching 24% in 2040;Footnote 3 a rising share in the proportion of women in the executive population reaching 30% in 2001 (Agirc and Ircantec figures); an important recruitment of civil servants between 1975 and 1985 and then a stabilization and even a slight decline (Marchand et al., Reference Marchand, Massal and Raynaud2002). In 2000, incumbent civil servants represented 15.6% of total employment, 56.2% of them being women (report of the Ministère de la Fonction Publique, 2002).
For the UK (respectively Germany), our model reproduces a share of executives in the total number of private employment rising from 23% (resp. 14.4% for Germany) in 1970 to 33.8% (resp. 20.4%) in 2000, a rising share in the proportion of women in the executive population reaching 39.3% (resp. 25.5%) in 2000 (Eurostat). The share of the public sector in public employment is fixed at 21.6% in 1985 and then decreases reaching 12.6% following the statistics of OECD public management service. Note that for the UK, we consider as state employees all those working in the public sector and not only civil servants since all state employees are out of the SERPS (State Earnings Related Pension Scheme) coverage. For Germany, this share is fixed at 7% of total employment at each period (Börsch-Supan and Wilke, Reference Börsch-Supan and Wilke2003). At each time, we assume that half of public sector employees are women for Germany and for the UK.
All these facts are reproduced by calibrating the share of executive and public employment by generation and not directly on the total population. The model then reasonably forecasts the future evolution of executive and public employment given the current observed situation for our three countries.
Activity of the working age population
For Germany and the UK, estimations of the average length of education of the population of type (g, s, c), D 2(g, s, c), are based on OECD data for agents working in the private sector (OECD, 2004a) and on the Public Sector Pay and Employment database of the OECD for the age of entry in the public sector. For France, we use the data of the Destinie model (1999), while the distribution by professional status comes from Assous et al. (Reference Assous, Bonnet and Colin2001). For each generation, the average length of working life, D(g, s, c), is calculated using the historical effective average retirement age given in Coeffic (Reference Coeffic2003) for France and in Blondal and Scarpetta (1999) for Germany and the UK.
Concerning the age when agents enter or leave the working life, we make some more assumptions. (i) Nobody works before 16 or after 75. (ii) Agents in the public sector cannot work before the average length of studies and after the average effective retirement age (D 2(g, s, c)+D(g, s, c)), except in the UK.Footnote 4 Note that this average effective retirement age could be different from the legal retirement age. (iii) Between D 2(g, s, c) and D 2(g, s, c)+D(g, s, c), state employees activity rate is fixed to 1 in the three countries. (iv) Before the average length of studies calculated on all individuals, only non-executive workers participate in the labor market.
Individual participation in the labor market is not endogenously determined in the model. We prefer to resort to independent scenarios concerning the activity rate θact(t, g, s, c) of the population of type (g, s, c) based on official statistics for each country considered. The size of the population of type (g, s, c) in age of working at the date t is then simply given by: N act(t, g, s, c)=N(t, g, s, c) · θact(t, g, s, c). At each time, activity rates of private sector employees are adjusted so as to catch the historical average activity rate (INSEE for France and Labour Force Statistics, OECD for Germany and the UK) and given that public activity rates are fixed to 1 in France and Germany. We assume a rise in participation rates of elder workers. In concrete terms, activity rates of those aged between 45 and 65 are progressively shift by three years between 2000 and 2040 for France and the UK and five years for Germany.Footnote 5 Activity rates of other cohorts remain the same as those observed in 1999.
Retirees and pre-retirees
Our model considers as pensioners all those receiving pension benefits, i.e. people aged over 75 and all those inactive after the average effective retirement age. However, many pension benefits as well as other benefits helping to finance anticipated suspension of activity are existing. We thus have assumed that before the effective retirement age,Footnote 6 any lowering in activity rates of a cohort between two periods corresponds to early retirement. By assuming differential in mortality between the different professional categories (and calibrating this parameter), we could reproduce the current distribution of pensioners. We then fix this differential in mortality for future decades. The results concerning the number of retirees are the following:
• 10.9 million pensioners in France, 16.9 million for Germany, and 10.4 million for the UK in 2000, which is close to the official data (Mesnard, Reference Mesnard2001, for France; Börsch-Supan and Wilke, Reference Börsch-Supan and Wilke2003, for Germany; Department for Work and Pensions, 2003, for the UK).
• 526,000 individuals in early retirement for France (Fournier and Givord, Reference Fournier and Givord2001), 850,000 for Germany (Börsch-Supan and Wilke, Reference Börsch-Supan and Wilke2003) and 1.5 million for the UK, corresponding to those entitled to receive incapacity benefits (Department for Work and Pensions, 2003).
• 15% of French pensioners in 2000 worked in the public sector (8% for Germany and 25% for the UK), which roughly corresponds to the share of public sector employment in the 1960s and 1970s.
• 10.1% of French pensioners in 2000 are former executives (14.3% for Germany and 21% for the UK), 20% of which are women (20% for Germany and 32% for the UK).
3 The macroeconomic bloc
The production sector
The production sector is composed of one representative firm. This firm produces a single composite good that may be used for consumption as well as for capital accumulation. The production Y(t) of period t comes from the combination of the stock of physical capital K(t−1) installed at date t and the labor supply N(t). We assume a standard Cobb–Douglas production function with constant returns to scale

where α is the share of capital. The level of knowledge in the economy, Γ(t), is assumed to grow at the exogenous rate γΓ(t). This parameter is fixed at 1.8% for the three countries, which is close to the long-run values suggested by OECD.
Profit maximization requires the equality of the marginal productivity of each factor to its rate of return
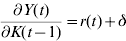

where δ is the depreciation rate of physical capital, r(t) the real interest rate, and w(t) the real wage rate.
We have to underline here that social contributions paid by employers are not specified: we thus assume that all social contributions are paid by employees and that other types of benefits are not introduced. The capital share parameter, α, is set to 38%. The annual depreciation rate, δ, is assumed to be 5.5% per year. These two parameters are fixed so as to accurately reproduce the share of investment in GDP in 2000 as well as a net interest rate around 3.5% for each country.
Wage and unemployment equilibrium
As in d'Autume and Quinet (Reference d'Autume and Quinet2001), we follow a WS–PS (wage setting/price setting) approach for the determination of real wage and unemployment level. We simply assume that wage claims consist in applying a mark-up on the reservation wage. The latter increases at the same pace as the total factor productivity so as to ensure the existence of a structural unemployment rate in the long run. We also assume a decreasing relationship between this mark-up and average unemployment rate that transcribes into an erosion of the negotiation power of the trade union in the case of labor shortage. So real wages are determined in the following way

where  is the average unemployment rate of the economy. Λt is an adjustment variable calibrated so as to catch the historical unemployment rate of the 2000–2004 period. Then, it is calibrated in such a way that ensures a convergence of the effective unemployment rate to the equilibrium long-term unemployment rate in 2015. The values retained in the long run are 6% in France (slightly less optimistic than the 4.5% retained in the COR report, 2006), 5.6% in Germany (see CES-IFO pension model), and 4% for the UK (see OECD, 2004b). a u is the long-term elasticity of the real gross wage to the unemployment rate and is fixed to −1 (that is slightly lower in absolute terms than the value of −1.2 retained by d'Autume and Quinet, Reference d'Autume and Quinet2001). Finally, the past and present average unemployment rates reproduced by the model are those coming from OECD data.
Individual behaviors
Unemployment profiles, wage profiles and individual income
At each date, the representative individual of class (g, s, c) receives an average wage w rep(t, g, s, c)=w(t, g, s, c)(1−θcho(t, g, s, c))θact(t, g, s, c) where θcho(t, g, s, c) is the unemployment rate of this type of individual and w(t, g, s, c) is the gross wage rate. The unemployment rate depends on the age, the sex, and the professional status of the individual considered. The wage profiles are simply given by the product of an experience premium by age and a skill premium by sex. The experience premium and the skill premium are built on INSEE statistics for France and on the Eurostat database for Germany and the UK.
At each period of time, individual income is composed of financial income, labor income (w rep(t, g, s, c)), and pension benefits received. Financial income depends on the financial wealth A(t−1, g, s, c) accumulated by this individual until the previous period and the rate of return (r t) on these assets. Due to the great diversity of pension schemes, the determination of the net income is specific to each country.
Consumption and saving behavior
We assume that current consumption, c(t, g, s, c), depends on the current available income, Inc (t, g, s, c), and, as in d'Autume and Quinet (Reference d'Autume and Quinet2001), on wealth, A(t−1, g, s, c), accumulated at the beginning of the period

where s rate is the exogenous propensity to save. c A is the exogenous propensity to consume the aggregate wealth.  is a uniform proportional tax rate on income. Saving and consumption behaviors are thus different according to the life cycle stage. s rate and c A are fixed during the calibration step so as to reproduce a correct wealth accumulation profile. By contrast, in OLG models, consumption is determined as a result of an intertemporal maximization program. Here, given the size of our model, this formulation is not possible for technical reasons. However, this formulation of the consumption function allows us to reproduce a decreasing wealth profile at a given age without assuming negative saving rates for old age people.
The household snapshot budgetary constraint is the following (with A(t−1, g, s, c)=0 for a(t, c)⩽16)

with h(t, g, s, c) received inheritance. The variable cout(t, g, s, c) is the equivalent, in terms of adult consumption, of the consumption of children (in charge). The calculation of this relative cost is based on the values taken from Hourriez and Olier (Reference Hourriez and Olier1997).
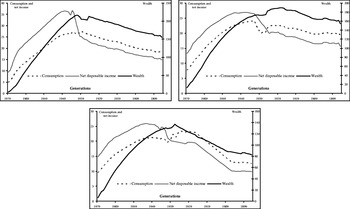
Given the uncertainty about the time of death, individuals die with a positive wealth, even if they die at 105 years old. We adopt the idea, as in Imrohoroglu (Reference Imrohoroglu1998), that bequests are taxed at a 100% rate by the government and redistributed as a lump-sum uniform amount to all surviving adults. We choose to fix the parameters s rate and c A: (i) so as to reproduce the initial capital stock in 2000 and (ii) so that the average consumption level of retirees to the one of workers is equal to 110% in France, 95% in Germany, and 80% in the UK (according to COR, 2004). Given this calibration, Figure 1 presents the age profiles of consumption, net disposable income, and wealth for all generations alive in 2000.
Consumption, wealth and average net disposable income by generations in 2001 (in thousands euros from 2000)

4 The pension systems
The French pension system
Our model focuses on those pension schemes that concern the bulk of the population. For 70% of the population (i.e. wage earners of the private sector), pensions consist in the combination of a basic general regime (‘rb’) and of mandatory complementary pension schemes (‘rc’) organized on a professional basis. The latter consists in a large number of specific schemes, which are merged in two main institutions: AGIRC for executives (‘ca’) and ARRCO for non-executives (‘nc’). All these schemes (‘rb’ and ‘rc’) run on a pay-as-you-go basis. Beside this two-pillar structure, civil servants (15.6% of total employment) have a single pension scheme (‘rf’), directly paid from the government budget. Our model also includes pre-retirement benefits that are assumed to be financed through the public superannuation fund (‘rf’).
The French civil servants pension scheme (‘rf’)
The pension paid to a new civil servant retiree (at age D 2(g, s, ‘f’)+D(g, s, ‘f’)) is proportional to his last wage. The key variable establishing the pension value is the number of working years. Each year entitles him/her to a 2% annuity, the sum being truncated to 75%. A penalty, specific to each generation, is applied for early suspension of activity. It consists in reducing the pension for each quarter missing for attaining either the minimum number of contributions or the pension age limit. Note that the latter will progressively increase from 61 in 2006 to 65 in 2020.
Beyond the average effective retirement age, pensions are indexed on the basis of the growth rate of civil servant wage before the 2003 reform and on the inflation index afterwards.Footnote 7
The general regime (‘rb’)
We assume that all those who are not civil servants are affiliated to the general regime, which works as a defined-benefit annuity regime. The basic general scheme offers contributory benefits corresponding to the share of wages below the social security ceiling. The pension is proportional to the number of quarters of contribution and to a reference wage. The reference wage is an average of wages perceived during the An(g) last years of the pensioners' careerFootnote 8 truncated by the social security ceiling. In accordance with the current law, this ceiling is proportional to the average earning income of the private sector.
The maximum replacement rate is equal to 50% of the reference earning but a penalty, depending on the generation concerned, is applied in case of early suspension of activity. The contribution time necessary to obtain a full pension progressively increases from 37.5 years to 41 years when the effects of the 1993 and 2003 reforms are fully felt. After the effective retirement age, pensions of the general scheme are indexed in line with prices.
Complementary schemes (‘rc’)
Complementary schemes are calculated according to a notional account. For executives, contributions are collected by ARRCO for the part of the wage below the social security ceiling and by AGIRC for the segment of the wage, which is between one and four times the ceiling. Non-executives only contribute to ARRCO, but the wage is truncated to three times ceiling, and different rules apply below and above the ceiling. Workers buy each year a number of points (depending on their wage and status) to the fund they are affiliated to.
The number of points accumulated since the beginning of the working life then determines the value of the complementary pension. The point value of each complementary fund is calculated on historical data until 2003 and then indexed on the general price index as in Bardaji et al. (Reference Bardaji, Sedillot and Walraet2003).
The German pension system
The German pension system is a pay-as-you-go defined-benefit system. Approximately 90% of the German population is covered by the ‘public retirement insurance’ (Gesetzliche Rentenversicherung, ‘grv’). This scheme offers generous replacement rates (around 70% of average earnings for a complete career). Civil servants (7% of the total population) are covered by a special scheme (‘rf’), which is even more generous than GRV. In addition to benefits through the public pension system, transfer payments (mainly unemployment compensation) enable what is referred to as ‘pre-retirement’. As in the French case, pre-retirement benefits are assumed to be financed through the public superannuation fund (‘rf’).
The private sector pensions (‘grv’)
The GRV pension scheme offers benefits that are proportional to lifetime contributions. Contributions, in turn, are proportional to earnings capped at about twice the average earnings. Pension benefits are computed by multiplying the number of ‘earning points’, the pension value, and an adjustment factor for an incomplete career. The points accrued by an individual depend upon the contribution assessment basis in each year of working life and on the average contribution assessment basis of the population. For each year of service, a worker receives an earning point that reflects his relative income position for that year. If he receives more (or less) than the average wage, he receives points on a pro-rata basis, capped by the social security ceiling.
The pension value is specified to ensure that an individual with 45 earning points will obtain a pension with a 70% replacement rate of average earnings when retiring. The Riester reform of 2001 will gradually (after 2010) reduce the replacement rate of 70% of average net earnings to around 67% in 2030. The Riester reform also changes the computational procedure for reference earnings, now subtracting a fictitious tax rate of gross earning to be invested in a new funded supplementary private pension system.Footnote 9 This fictitious contribution to the new private pension account will gradually increase from 1% in 2003 to 4% in 2008.
The German pension system appears to be one of the most generous in the world. Indeed, the high initial level of public pension was exacerbated by indexation of pension benefits to changes in net income.
Civil service pension (‘rf’)
Civil servants are exempt from the GRV public pension system. They do not pay explicit contributions for their pensions as the other employees in the public and private sectors. The standard pension benefit for civil servants at age of liquidation is simply the product of the last gross wage, the replacement rate, and the length of service. There are three crucial differences between civil service and private sector benefits. First, the benefit base is gross income rather than net income. Second, there is no ceiling, which implies a maximum pension higher than the private sector one. Third, the benefit base is the last wage rather than the life-time average. As for GRV pensions, benefits are then updated annually on changes in net income.
The British pension system
The British pension system is three-tiered. The first tier consists of the basic state pension (BSP) and a significant level of means-tested benefits. The second tier is compulsory for all employees with earnings above a certain floor and is made up of the State Earnings-Related Pension Scheme (SERPS) and a large and continually growing level of private provision. Finally, the third tier consists of additional voluntary contributions and other private insurance.
The basic state pension (‘bsp’)
The BSP is a flat-rate contributory benefit payable to people aged over the state pension age. The state pension age is 65 for men and 60 for women. A recent reform raises this age for women by six months a year from 2010 to 2020. To get a full rate of benefit, contributions must have been paid or credited for 90% of working life. This presently requires 44 years of contribution for men and 39 years for women (rising to 44 when retirement ages are equalized at 65 in 2020). Note that all public sector personals also receive this pension in addition to their occupational pension.
Beyond the state pension age, state pensions are upgraded on inflation. Note, however, that the BSP was upgraded by 7.4% and 4.1% in 2001 and 2002, respectively.
The State Earnings-Related Pension Scheme (‘serps’)
Membership to the second tier state pension is compulsory unless the employee has contracted-out into a private pension scheme. Introduced in 1978, it was originally designed to provide a pension equal to one quarter of earnings during the best 20 years of earnings. Subsequent reductions in the generosity of SERPS in the mid-1980s move to a benefit formula producing a pension producing 20% of lifetime average earnings.
The earnings on which the pension is calculated are bounded by the lower earnings limit (around 18% of average earnings in 2000) and the upper earnings limit (around 120% of average earnings in 2000). These thresholds move up each year in line with prices. The amount of first SERPS pension received by a pensioner is based on total earnings on which contributions were paid from 1978 to the year before the state pension age.
Any employee can choose to contract out of SERPS into a secondary private pension. Evaluation of the share of those who contracted into SERPS by professional status and sex are based on the Lifetime Labour Market Database. As for the BPS pension, the SERPS pension is up-rated each year after retirement in line with prices.
From 2002, SERPS has been reformed to provide a more generous additional state pension for low and moderate earners. The reformed additional state pension is known as the State Second Pension (S2P). For those earning more than the average income, S2P is equal to SERPS. For those earning above the low earning earnings level, LEL, but below the new low earnings threshold, LET (around 45% of the annual average income), the accrual rate will be twice the SERPS one. Moreover, the S2P is calculated on the basis of LET. Between the two thresholds, the accrual rate is half of the relevant SERPS rate.
Incapacity benefit and minimum income guarantee
The BSP remains by far the most important element in social security spending on the elderly. Nevertheless, BSP individual average amounts represent only around 15% of average earnings at present. In addition to the BSP and SERPS, there are two other state benefits that are taken up widely by elderly people: income support and incapacity benefit. There appears to be widespread use of invalidity and sickness benefits as a route into early retirement. Early retirement typically occurs from age 57 and we assume that the benefits for not working during this period (from 57 to legal state pension age) come from the incapacity benefits. Note that incapacity benefits are here modeled as lump-sum benefits.
There are also important income-related benefits. Currently, 40% of pensioners receive some form of income-related benefit (Department of Social Security, 2000). Income support is a flat rate, non-contributory, means-tested benefit. It is payable to those aged 60 or over who are on low incomes. In April 1999, income support was renamed minimum income guarantee (MIG) and made more generous with an increase in the level, and a commitment to up-rate in line with earnings. For the sake of simplicity, we assume that only non-executives (and 74% of those employed in the public sector, corresponding to the share of non-executives in the public sector) receive this type of lump-sum benefits (MIG). As they are non-contributive, we assume they are financed thought a proportional flat-rate income tax, .
Private pension
Compared to France and Germany, the UK has a high level of coverage of private pensions. A key element of the social security regulations that has underpinned the growth of occupational pension schemes is the ability of employees to opt out of SERPS. Here, we only consider a defined-benefit rule, since 90% of occupational pension schemes were in such a scheme in 2000. Occupational pension funds must be funded to cover obligations and not run on a pay-as-you-go basis.
The key distinction that we make is between individuals who work in the public sector and in the private sector. We assume an accrual rate of 1/60th for the private sector and of 1/80th for the public. Pensions are calculated on the average earnings: (i) in the last ten years before retirement in the private sector and (ii) in the last year in the public sector. Since they are not covered by SERPS pensions, coverage by a pension fund is compulsory for employees of the public sector.
As reported by Government Actuary, in 2000 there were 10.1 million employees in occupational pension schemes, of whom 5.7 million were in the private sector and 4.5 million in the public sector. These figures are assumed to change for future years, with the demography and the share of those in an occupational scheme.
5 Equilibrium conditions
Superannuation funds
The French pension system described in our model is composed of three superannuation funds: the general regime (‘rb’), the complementary scheme (‘rc’) and the civil servants scheme (‘rf’). The German system is composed of two schemes: the private sector scheme (‘grv’) and the civil servants scheme (‘rf’). Finally, the British pension is based on two types of superannuation funds: the public superannuation fund, which constitutes the main benefits paid by the National Insurance Fund (‘nif’),Footnote 10 and the private superannuation funds (‘prv’), which gather all occupational pension schemes (public and private).
At each date t, superannuation funds expenditures are simply given by the sum of each type of pension paid to retirees. The primary deficit of the public superannuation funds (Def(t, fund)) is thus defined by the difference between public superannuation fund receipts and expenditures.
The British occupational pension fund equilibrium
British occupational pension scheme must be funded at each date to cover obligations. Calculation of appropriate funding levels requires a number of actuarial assumptions, in particular the assumed return on assets (based on the current interest rate), projected future real wage growth (since occupational pensions depends on final salaries), as well as estimates of annuity factor and the expected evolution of the relative number of contributors and beneficiaries over time. The value of accrued pension rights is calculated using the ‘projected unit method’, which is used by about 75% of UK pension schemes to value their liabilities (for more details, see for example Blake, Reference Blake2003). The pension scheme is fully funded when the current value of the financial assets in the pension fund is equal to the present value of the pension liabilities aggregated across all scheme members. The contribution rate to the private scheme is equal to 14% in 2000 (Government Actuary's Department, 2003) and afterwards is endogenously calculated to insure the sustainability of the pension fund at each date.
Calibration of the pension funds receipts and expenditures
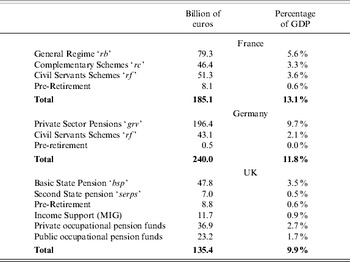
Here, the objective of the calibration is to reproduce the historical level of expenditures of each superannuation fund considered (Table 2). To do so, we have to adjust and calibrate some variables. The pension benefits received in 2000 by age, sex, and professional status are adjusted in order to reproduce for each fund the data of EIR (Echantillon Inter-regimes de Retraiteś, 2001) for France, Börsch-Supan and Wilke (Reference Börsch-Supan and Wilke2003) for Germany, and the Pensioners' Incomes Series (National Statistics, 2004) for the UK. At the same date, the average amount of pension benefits paid by each fund and the replacement rate at age of retirement for the different type of agents (as well as the points value) are adjusted so as to reproduce the aggregate spending of each fund.
Social security payments in 2000

Sources: Mesnard (Reference Mesnard2001b), OECD (2001), Department for Work and Pension (2003), Government Actuary's Department (2003).
We assume that in 2000 each fund is balanced and that the funds have no debt, whatever the country.Footnote 11 In order to obtain these results for the initial year, we adjust the contribution rates related to the different schemes receipts. For the following years, we could consider different types of adjustments so as to ensure (or not) the primary equilibrium of each fund. If the fund is unbalanced, the excess receipts (resp. expenditures) have to be financed (resp. capitalized) through debt. The total debt of the pension system, Debt pen(t), then evolves in the following way

with  .
The financial market equilibrium
The macroeconomic equilibrium of the model depends on the capital market functioning. In this study, we consider three different financial environments. The first one is based on the closed economy assumption. Ex ante, the net capital supply of national residents, i.e. the household aggregated wealth of the period t, determines the capital stock of the country at the next period. The equilibrium condition on the capital market is the following

where A(t)=∑g,s,cN(t, g, s, c)A(t, g, s, c), assets(t) represents the value of the financial asset in pension funds.Footnote 12 The net return of capital, r(t), is determined in order to equilibrate supply and demand for capital within the considered country.
The second environment is based on the small open economy assumption. The resident accumulation of assets and the resident demand for capital are assumed to be insignificant at the world level so that they do not have any influence on the world interest rate r*(t). The real interest rate is thus fixed on the world financial market. Consequently, the capital demand emanating from firms (Equation (2a)) adjusts to these external conditions. The financial market equilibrium is obtained by the amount B*(t) of debt incurred by residents to foreign agents

The factor prices are then fixed by external conditions, so that, according to Leontieff's theorem, the productive decisions are independent of households behavior.
The third environment assumes that our three countries belong to a financial union, which is closed relative to the rest of the world. Market clearing on the international capital market and the assumption of perfect capital mobility across our three countries (z=‘fr’, ‘all’, ‘uk’) requires that the interest rate net of income taxes is equalized across all countries and that the aggregated demand of capital is equal to the aggregated supply of capital


Macroeconomic results
Our benchmark scenario accounts for recent pension reforms carried out in the three countries as well as for anticipated increasing activity rates discussed in section Sactivity. However, no further reform is undertaken in this first scenario. Hence, pension schemes may be in deficit. The deficit is financed through government bond issuing, whereas any surplus leads to reserve accumulation. Obviously, this benchmark scenario of deficit financing of pension schemes does not correspond to the line adopted by the different governments. It must be seen as a ‘business-as-usual’ case necessary to illustrate the financial tensions emanating from the ageing process. The two next scenarios explore two alternative balancing rules for superannuation pension funds. In the second scenario, financial equilibrium of pension schemes is achieved through the adjustment of replacement rates, whereas, in the third one, it is obtained through the adjustment of social security contribution rates. For each scenario, three assumptions are considered concerning the capital market: small open economy, closed economy, and financial union.
Benchmark scenario
Small open economy
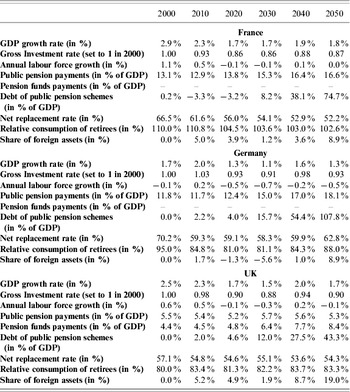
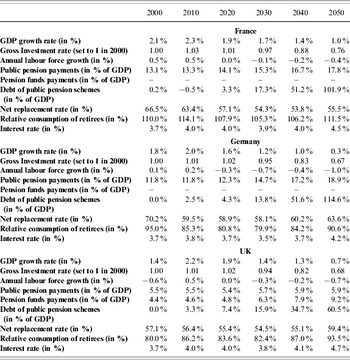
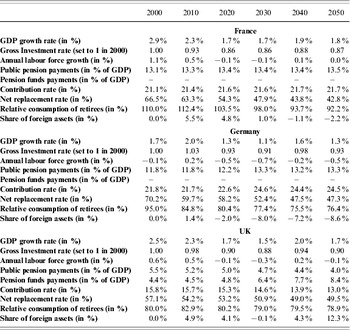
In this first case, the interest rate for the three countries is fixed at its initial level (around 3.7%). Any deficit in national saving is automatically financed through capital inflows (Equation (8)). The main results for macroeconomic and pension schemes variables are provided in Table 3. We provide an indicator of capital inflows or outflows related to demographic changes: the share of foreign assets corresponds to the ratio of the wealth held by foreign assets to the sum of productive capital and national debt. Two standard-of-living indicators are also reported. The first one is the net replacement rate defined as the ratio of average net pension, composed of the different pension schemes, to the average net income of workers. Note that it is not a replacement ratio calculated on a standard case and on a complete career but rather an indicator of the average level of pensions compared to earnings. The second standard-of-living indicator is the ratio of retirees to workers average consumption.
Benchmark scenario: small open economy

Source: Author calculations.
Recent pension reforms, combined with the assumed rise in activity rates of elder workers, ensure the solvability of pension regimes in France until 2025, contrasting with Germany, which immediately has to face up with debt. After 2025, the accumulation of negative financial balances leads to a rise in pension schemes' indebtedness, which appears to be particularly critical in the long run for France and Germany. For example, public schemes debt reaches 75% of GDP around 2050 in France and 108% in Germany, whereas this value is only around 43% in the UK. The low generosity of the UK public scheme, combined with a less marked ageing process, explain this result. Although the share of public pension in GDP slightly decreases over the period in the UK, private pension payments made by pension funds clearly increase, reaching 8.4% of GDP in 2050.
These results in terms of pension system evolution are highly compatible with purely accounting approaches run by national institutions. For example, we find public pension spending around 16.6% of GDP for 2050 in France, which is close to the DREES figure (16% of GDP) of Brun-Schammé and Rapoport (Reference Brun-Schammé and Rapoport2005). For Germany and the UK, pension spending evolution is highly compatible with the recent report of the Social Protection Committee (2006).
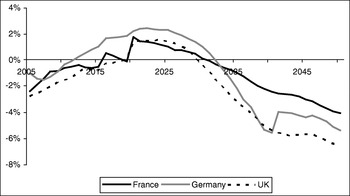
The ageing process translates into large capital inflows, from 2035 onwards in the three countries (Figure 2).Footnote 13 Capital flows are the result of two possibly competing effects. The first one is linked to the average saving rate of households and the second one comes from the financial needs of pension systems. Between 2005 and 2025, public pension systems generate small public deficits that are partially counterbalanced by the high saving rates. After 2025, the impact of ageing becomes more pronounced and transcribes into an explosion of the public debt, as well as a reduction in average saving rates. As shown by the foreign assets indicator, France and Germany are especially affected in the long run due to the strong ageing process and generous pension scheme. Due to the relatively weak debt of the public pension scheme, the UK situation is clearly linked to the ageing process, i.e. the fact that the baby boom generation quickly decumulates assets, a pattern that is accentuated by the importance of private pension funds.
Benchmark scenario – small open economy: capital flows (in percent of national GDP)

Until 2020, capital accumulation remains sustained in the three countries, but Germany suffers from lower GDP growth (1.8% on average over 2000–2020 compared to 2.4% and 2.3% respectively for France and the UK). After 2020, average GDP growth rates are lower in the three countries (1.8% in France, 1.3% in Germany, and 1.7% in the UK) due to further deceleration of the labor force. Since the interest rate and the wage per unit of effective labor must remain constant over time, capital per unit of effective labor is also constant. So the capital growth rate, and the GDP growth rate, are given by (exogenous) productivity growth plus the labor force growth rate. Thus, in this scenario, economic growth is widely determined by the evolution of demographics, participation rates, and unemployment rates.
This first scenario can be considered as an optimistic one given the assumptions of upward activity rates for elder workers (based on the official national projections). In spite of this, the relative situation of retirees, measured by the net replacement rate (defined as the ratio of average net pension, composed of the different pension schemes, to the average net income of workers), deteriorates in France and in the UK given the indexation of pension benefits to prices. In Germany, there is no continuous deterioration: the net replacement rate first decreases due to the Riester reform that makes retirees participate to the increase in contribution rates until 2030 (and also because of the decrease in the actual replacement rate); after 2030, the contribution rate is fixed at 22% (and the actual replacement rate at 67%) and the relative situation of retirees improves due to favorable indexation of pensions (on net wages).
We have to remember here that saving behaviors are assumed to be exogenous in this model. Consequently, some of recent implemented reforms implicitly assume a change in individual saving behaviour, which is not taken into account in our simulations.
Closed economy
In the small open economy assumption, each economy is assumed to be perfectly integrated in the world capital market, so that it always finds financial resources at a fixed interest rate. The second environment considered (closed economy) takes the opposite view of no international capital flow. Of course, this assumption is highly unrealistic for our three countries. However, by comparing this environment to the small open economy case, it will be possible to understand the specific role of capital mobility when measuring the macroeconomic consequences of ageing and pension reforms.
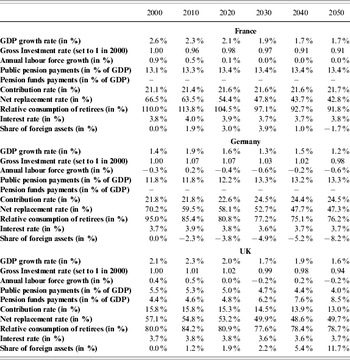
Here, debt financing of public pension schemes and of productive capital accumulation only comes from national savings (Equation (7)). By raising the domestic interest rate, increasing financing needs of pension systems now have a negative impact on capital accumulation, hence on growth. Indeed, the interest rate jumps due to the growing shortage of household net saving (levied by financial needs of pension systems): the gap between depressed economic growth and higher interest rates induces a negative cumulative spiral.
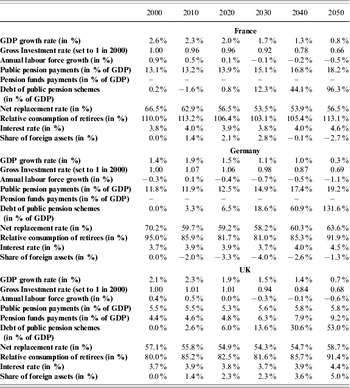
The consequences for pension schemes are largely accentuated compared to previous the openness environment (Table 4) and to official projections. Indeed, the share of pension payments to GDP rises compared to the small open economy case, not because of a higher purchasing power of pensions, but due to lower GDP. The increase in the relative cost of productive capital involves a lower ratio of capital stock to efficiency unit of labor. Since the labor supply is fixed, employment is reduced as the gap between real earnings supplied by firms (that decrease) and earnings desired by workers (that temporarily remain at a high level) transcribes into unemployment.
Benchmark scenario: closed economy

Source: Author calculations.
Financial union
Here we assume the EU capital marketFootnote 14 to be perfectly integrated but isolated from the world market. Again, this is not a realistic assumption since in reality there is perfect capital mobility between this zone and the rest of the world. This environment aims at accounting for the fact that our group of three countries constitutes a large economy that may impact on the world interest rate, which is not the case in the small economy assumption. Hence, for each country the interest rate is neither exogenously given, nor determined by the domestic savings–investment imbalance.
Here, the real interest rate is assumed to be the same for the three countries. It is determined on a single European capital market by equating EU3 capital demand – i.e. the sum of regional gross investment flows – and the EU3 capital supply – i.e. the sum of country savings – or equivalently by equalizing the total capital determined by the firm and the government and the total capital supplied by households, foreign investors, and pension funds (Equation (9a)).This allows us to examine the impact of differences in demographic perspectives and of extremely diverse types of pension schemes in European countries on capital flows within the zone.
As shown in Table 5, the results under the EU financial market assumption are close to the closed-economy case. However, now the consequences of ageing are shared between the three countries through the common interest rate. This allows the UK (the country with the higher interest rate in the closed economy case) to attract capital flows and to enjoy a lower interest rate (4.4% in 2050, compared to 4.7% in the closed economy case), whereas other countries (France and Germany) suffer from higher interest rates compared to the closed economy case (4.6% compared to 4.5% for France and 4.5% compared to 4.2% for Germany). Consequently, the debt weight is reduced in the UK (53% of GDP in 2050, compared to 60.5% in the closed economy case) and the opposite occurs in the other two countries. France suffers from a lower growth path than in the closed economy case. Indeed, capital accumulation in this country is now limited by capital outflows to Germany and the UK.
Benchmark scenario: financial area

Source: Author calculations.
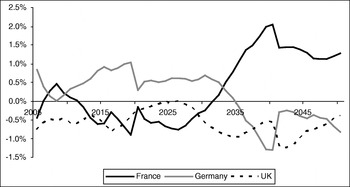
Capital flows are clearly different than in the small open economy case (Figures 2 and 3): since the European union is a closed zone, the three countries cannot simultaneously benefit from positive capital inflows, as in the small open economy case, to finance their public debt. In the long run, the UK benefits from capital inflows from France and Germany to finance its pension system deficit.
Benchmark scenario – financial area: capital flows (in percent of national GDP)

Scenario 2: Adjustment of replacement rates
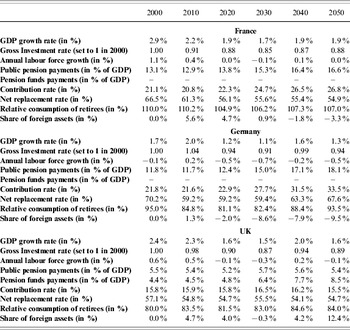
As shown in Table 3, the combination of expected higher activity rates and of pension reforms does not ensure the pension systems sustainability. Hence, further reforms will have to be implemented. Here we explore an adjustment of replacement rates to ensure that the different superannuation funds are balanced at each date. For this purpose, we adjust the generosity of pension benefits received by retirees for each superannuation fund (fund=‘rb’, ‘rc’, ‘rf’, ‘grv’, ‘bsp’, ‘serps’). We also assume that the minimum income guarantee (MIG) receipts are adjusted in the same way.
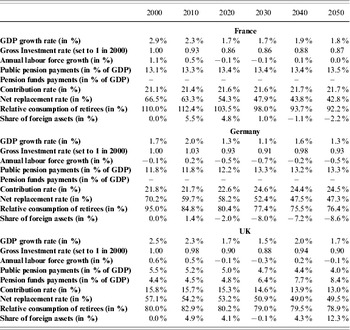
The main assessment following this type of pension reform is a higher growth rate compared to the case of debt financing retained in the benchmark scenario. This is especially true in the case of the financial unionFootnote 15 (see Tables 5 and 7). When comparing the effects of pension adjustment between the two capital mobility assumptions (Tables 6 and 7), it appears that economic growth is relatively similar for the two openness environment after 2030 whatever the country considered.
Adjustment of replacement rates scenario: small open economy
Source: Author calculations.
Adjustment of replacement rates scenario: financial area

Source: Author calculations.
Indeed, in the financial union case, the increase of global income at the macroeconomic level temporarily allows for more robust capital accumulation. This additional capital compared to the small open economy case then sustains a slightly higher economic growth. In the case of the small open economy, the economic growth rate is not affected by the reformFootnote 16 since the growth rate only changes with total factor productivity growth (γΓ(t)) and employment growth (capital intensity is exogenously established by the world rate of return).
The counterpart of these good macroeconomic performances, resulting from adjusting replacement rates, is the important deterioration in the relative standard-of-living of retirees compared to workers. Obviously, the ultimate objective of such a reform is to make retirees support most of the financial consequences of ageing. For example, it implies a reduction of the net replacement rate of 9.3 percentage points in 2050 for French retirees, 15.5 points for German retirees, and only five points for the British retirees. The share of public pension payments in GDP is then very stable over the period for our three countries.
Note that the increase of the labor income on the life cycle nevertheless allows agents to accumulate higher wealth during their activity period, which raises the financial income of retirees. This explains why the relative standard-of-living of retirees is less affected when considering the relative consumption of retirees indicator. However, we have to keep in mind that household saving behaviors are exogenous in this model. If households were to increase their private saving so as to compensate for the reduction in the pension level, then wealth accumulation would be even larger.
Scenario 3: Adjustment of contribution rates
This last scenario assumes that the contribution rates adjust at each date to avoid any financial needs of the different superannuation funds. As in the previous scenario, it is based on the assumption of a zero deficit of public pension scheme. More precisely, we assume an endogenous adjustment of the contribution rate to the general regime and the surcharge coefficient to the complementary schemes for France, the contribution rate to the private sector pension for Germany, the contribution rate to the National Assurance Fund for the UK,Footnote 17 and the tax rate on all income for the three countries.
In this model, only pension contributions are taken into account when moving from gross earnings to net earnings. This scenario implies that the contribution rates are adjusted at each date to balance the different pension schemes. We implicitly assume that the increase in the average social security contribution has no impact on average earning determination. In other words, we do not model the impact of the tax wedge on gross wages, hence on gross earnings and unemployment.
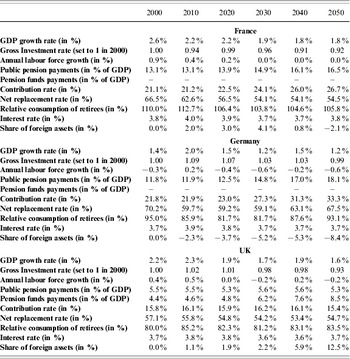
Tables 8 and 9 present our results. Once again, GDP growth is not affected by the equilibrium conditions of the pension systems in the small open economy case (except in France). By contrast, in the case of the financial union, GDP growth rates are clearly higher than those observed in the benchmark scenario (see Tables 5 and 9). The main effect of this type of pension reform consists in reducing the financing capacity of workers. Indeed, a higher part of their gross income is now deducted for pension systems.
Adjustment of contribution rates scenario: small open economy

Source: Author calculations.
Adjustment of contribution rates scenario: financial area

Source: Author calculations.
On the other hand, this type of adjustment allows limiting the inequality between earnings and pension benefits that is observed in the replacement rate scenario. In the French and German cases, the net replacement rate is even higher than in the benchmark scenario as a result of higher contribution rates paid by workers. In the UK, the net replacement rate (as well as the relative consumption of retirees) is comparable with those of the benchmark scenario because contribution rates need not change too much.
Conclusion
This study presents a quantitative analysis of the impact of population ageing and pension reforms in the three largest European countries: France, Germany, and the UK. We give particular attention to capital flows induced by differential ageing across countries and by pension reforms. This study demonstrates that the macroeconomic equilibrium of the model highly depends on the extent of capital mobility. In a world of closed economies, differential ageing generates differences in rates of return. In reality, we do not have closed economies but a global capital market. Population ageing and pension reforms therefore induce large capital flows between countries when it is assumed that each economy always finds financial resources at a fixed interest rate (small open economy). Capital flows are significantly smaller in the intermediate case where capital is perfectly mobile between the three European countries but immobile from the countries to the rest of the world.
This environment shows how the increasing openness of European Union to outside financial markets allows to alleviate the financial burden of public pension schemes. As a result, this generalized but asynchronous ageing process between the different world regions may give rise to opportunities that would be mutually advantageous compared to a situation of economic and financial autarky. Consequently, it might be useful to consider Europe as a financial union large enough to influence the saving–investment balance in the world economy (see Aglietta et al., Reference Aglietta, Chateau, Fayolle, Juillard, Le Cacheux, Le Garrec and Touzé2007).
Whatever the openness level, this study insists on the financial unsustainability of large pay-as-you-go pension schemes in France and Germany. This result is usually unclear in pure accounting approaches, since debt accumulation has no macroeconomic consequences in such models. Two main conclusions may be drawn from the examination of the various prospective scenarios. First of all, the critical assumptions for PAYG systems are the future trend of the global factor productivity and the behavior of agents concerning activity and labor market participation. Secondly, in the long run, resorting to debt financing seems to be a dead end to finance retirement systems. Indeed, public pension systems are unsustainable and generate important public debt, which strongly weights on economic growth. A planned fall in the replacement rates presents some virtues with respect to growth, but implies a large disequilibrium in the standard of living of retirees compared to active people.
We acknowledge financial support from the Observatoire de l'Epargne Européenne (OEE). We thank two anonymous referees and A. Benassy-Quéré for helpful remarks. This paper reflects the opinion of the authors and do not necessarily express the views of the institutions they belong to.
Appendix: Sensibility analysis
Constant activity rates
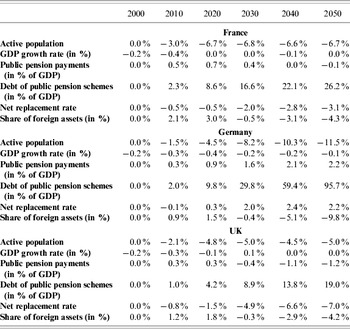
In this section, the specific role of activity rates for the elderly is assessed. More specifically, we assume that, in spite of the current reforms of the pension systems, activity rates stay unchanged at their 1999 level. Compared to the benchmark scenario of rising activity rates, the working age population is respectively 6.7%, 11.5%, and 5% lower in 2050 for France, Germany, and the UK. As shown by Table 10, activity rates appear to be one of the key parameters of pension system sustainability, particularly in countries endowed with Bismarckian pension schemes, such as France and Germany. For instance, the pension burden is more than two points higher in the German case compared to the benchmark scenario. Then, the public debt is markedly higher in Germany in 2050 because of lower receipts to the pension systems as well as lower economic growth.
Constant activity rates

Source: Author calculations.
The especially marked situation of the German economy in this scenario of constant activity rates can easily be explained by two reasons. First, the benchmark scenario considers an optimistic assumption concerning the activity behavior of elder workers in the German case. Indeed, based on official projections, we assume a progressive shift of five years of activity rates for those aged 45 to 65 in Germany, to be compared with a three year shift in the French and UK cases. Moreover, a large part of ageing costs are financed through an increase in contribution rates: the Riester reform progressively increases the contribution rates to 22% by 2030. By reducing the number of people in the work force, the scenario without activity rate also severely reduces the future receipts of the superannuation funds.
Lower labor productivity growth rate
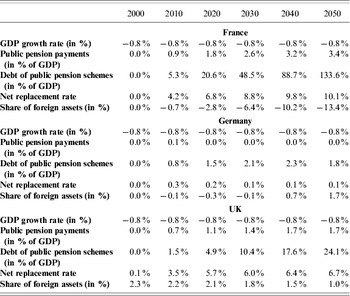
Here, we assess the consequences of a lower value of the labor productivity growth rate. As in COR (2006), we assume a pessimistic scenario concerning labor productivity. For that purpose, we fix γΓ(t) at 1% for the entire period rather than 1.8% considered as the benchmark. The results of this scenario for the three countries are given in Table 11. Mechanically, the GDP growth rate is reduced by 0.8 percentage point.
Sensibility to labour productivity: small open economy (difference from benchmark)

Source: Author calculations.
The consequences are clearly different for the three countries, coming from the differences in pension schemes functioning. Indeed, the German pension system is barely affected, given that pensions are indexed on net wages. Consequently, any change in labor productivity translates into pension evolution. In contrast, France and the UK are clearly affected by the lower labor productivity given the indexation of pension receipts on prices.