


Introduction
Recently, a number of observational studies have reported pronounced warming on the Antarctic Peninsula (e.g. Tuner et al. Reference Turner, Colwell, Marshall, Lachlan-Cope, Carleton, Jones, Lagun, Reid and Iagovkinaf2005). The possible causes for the warming are attributed to the change in synoptic circulation, the fluctuations of sea ice extent or global warming (Vaughan et al. Reference Vaughan, Marshall, Connolley, King and Mulvaney2001). However, the reported warming shows significant temporal and spatial variability such as a slow increase rate of air temperature in summer or the smallest warming trend at the South Shetland Islands near the Antarctic Peninsula. The variability of the warming may also be attributed to the differences in the feedback by the local climate to the large-scale processes. The region consists of various types of land surfaces such as ice caps, ice sheets, glaciers and non-glaciated coastal area. Since surface processes over the land surfaces may differ, it is a prerequisite to understand each surface process and to evaluate its influence on the local climate before we understand the warming. One of the main concerns regarding the warming on the Antarctic Peninsula is the melting of ice sheet and glaciers, resulting in a rise in the global sea level or effecting the oceanic circulation through an influx of fresh water into the sea (Thomas et al. Reference Thomas, Rignot, Casassa, Kanagaratnam, Acuña, Akins, Brecher, Frederick, Gogineni, Krabill, Manizade, Ramamoorthy, Rivera, Russell, Sonntag, Swift, Yungel and Zwally2004). This implies that, despite a slower rate of increase, the temperature increase in summer may be more important in that season than in other seasons.
Some coastal areas of the Peninsula and the neighbouring islands, otherwise covered with snow/ice, are exposed to the atmosphere during summer. The fraction of the non-glaciated area is estimated c. 35% of the total area of the Antarctic Peninsula (2% of the Antarctic continent). This change from surfaces covered with snow/ice to surfaces exposed (i.e. snow/ice free) can influence the surface radiation budget directly through a change in the albedo (i.e. the ratio of upward shortwave radiation to downward shortwave radiation). The exposed surface can gain much more energy from downward shortwave radiation compared to that gained by snow/ice-covered surfaces can. Accordingly, the magnitude and mechanism of the turbulent energy exchanges between the exposed areas and the atmosphere can be expected to differ significantly from those over areas covered by ice or snow. The exposed area forms strips along the coast area, forming a condition that would play an important role in the local climate system through a strong updraft in contrast with a weak updraft or downdraft from other areas or the sea. In addition, the non-glaciated area is expected to enlarge if the warming continues (e.g. Fox & Copper Reference Fox and Cooper1998). There have been many studies that have focused on the surface energy exchanges over glaciers and snow- or ice-covered areas on the Antarctic Peninsula, on the Antarctic Plateau, continental Antarctica, and in coastal areas in East Antarctica (e.g. Bintanja Reference Bintanja1995, Reference Bintanja2000, Braun et al. Reference Braun, Saurer, Vogt, Simões and Goßmann2001, Reijmer & Oerlemans Reference Reeijmer and Oerlemans2002, Van den Broeke et al. Reference Van den Broeke, Van As, Reijmer and Van de Wal2005, Van As et al. Reference Van As, Van den Broeke, Reijmer and Van de Wal2005a, Reference Van As, Van den Broeke and Van de Wal2005b). General characteristics of the surface energy exchange at such glaciated surfaces are a small net radiation and energy transfer from the atmosphere to the surface by sensible heat flux. In contrast, few studies have been carried out regarding land surfaces with significant seasonal change, even though a significant energy exchange may occur in such regions due to large net radiation (e.g. Choi et al. Reference Choi, Lee, Lee and Shim2004). In this paper, net radiation and turbulent energy exchanges over a non-glaciated coastal area exposed in summer are reported.
Materials and methods
Theoretical background
Surface energy budget: The surface energy budget at the study site can be described as:

where Rn is the net radiation, H the sensible heat flux, λE the latent heat flux, G the ground heat flux, including the melting of snow/ice on the surface, and Q the sum of all additional energy sources and sinks such as precipitation or the energy used for photosynthesis. Typically, Q is neglected as a small term. Rn is determined by the sum of four radiative components (i.e. downward shortwave radiation (RSDN), downward longwave radiation RLDN, upward shortwave radiation RSUP, and upward longwave radiation (RLUP)). A sign convention is used such that radiative fluxes directed toward the surface are positive while H, λE, and G directed away from the surface are positive.
Eddy covariance method: The turbulent fluxes of sensible heat and latent heat are calculated using (e.g. Swinbank Reference Swinbank1951):


where C p is the specific heat of dry air at constant pressure, ρ the air density, w the vertical wind speed, T air temperature, λ the latent heat of vaporization, q the specific humidity, and the overbar and primes denote time averaging and fluctuations from the mean, respectively.
Conductance: Evapotranspiration from a vegetated surface is governed by the radiative energy supply, atmospheric vapour pressure deficit, atmospheric turbulence and stomata control of the ability of the surface to transmit water to the atmosphere, which are parameterized in land surface models in terms of the conductance. How evapotranspiration is controlled by atmospheric and biological factors can be diagnosed through the comparison of the magnitude of the conductance.
Conductance is a reciprocal of resistance, which is similar to that in Ohm's law. The aerodynamic conductance (g a) is deduced as

where U is the mean horizontal wind speed and u* is the friction velocity. The first term represents the aerodynamic resistance and the second term the additional boundary layer resistance that takes the difference between the transport processes of momentum and water vapour into account (Monteith & Unsworth Reference Monteith and Unsworth1990). The surface conductance g c is derived from the measurements by using an inverted Penman–Monteith relationship (Monteith & Unsworth Reference Monteith and Unsworth1990)
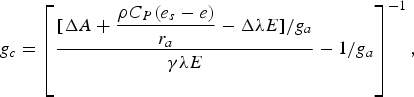
where Δ is the slope of the saturation vapour pressure curve at air temperature T (in Pa K-1), A is the available energy (in Wm-2), e s is the saturation vapour pressure (in Pa) at the reference level where T is measured, e is the actual vapour pressure (in Pa), and γ the psychrometer constant (Pa K-1). Here, the sum of H and λE was assumed as A as G was not measured. The climatological conductance (g i) is defined as follows.

where D (= e s−e) is the vapour pressure deficit (in Pa).
The study site
The study site was located on a coastal area near the King Sejong Station (62°13′S, 58°47′W) on the north-west edge of the Barton Peninsula of King George Island, South Shetland Islands near the Antarctic Peninsula. This area is surrounded by Maxwell Bay and Marian Cove (Fig. 1). The Antarctic Peninsula crosses the circumpolar westerly which encircles the Antarctic continent, causing the climate around the Antarctic Peninsula to differ greatly from the main Antarctic continent with its relatively high temperatures and precipitation of rain in summer. Due to its geographic location, depressions on synoptic- or meso-scale move eastward with frequent succession. This phenomenon brings about frequent precipitation or cloudy days. Additionally the wind largely depends on the synoptic-scale circulation except for some areas that are influenced by orography (e.g. katabatic wind).
The topographic map around the study site near the King Sejong Station. The shore line is taken for 0 m base.

From 1988–2004, the annual mean air temperature, wind speed, and precipitation at the study site were -1.6°C, 8.0 ms-1, and 484 mm, respectively. In summer seasons from 2003–2006, snow events were > 60% of the total precipitation in December and < 40% in February. In January this ranged from 15–80%. During the analysis period (summers seasons (January, February and December) 2003–2006 except for December 2006), the ratio of the daily averaged downward shortwave radiation measured at the surface to that at the top of the atmosphere was less than 0.72, which was greater than 0.6 for only 31 days, indicating that cloudy days were dominant over the study site.
A flux tower (as mainly used for this study) was located approximately 300 m inland. Hills of <~90 m in height were stretched north-east to south-east of the site. While the fetch was relatively flat toward the east, it fell gently toward the coast of Maxwell Bay and Marine Cove. The surface consisted of various sizes of rocks and gravels (< 1 m in width). Most of them were dark grey to greenish basalt and andesite. Shallow soil occupied < 10% of the flux footprint area (i.e. the source area for fluxes measured by an eddy covariance system). The soil type was mainly silt clay. Within 70–80 m upwind south-east to south-west, lichen was dominant with a leaf area index of 0.7–1. Beyond this, there was no vegetation except in the south where lichen grew over a distance of > 200 m. Moss grew sparsely among the lichen and was dominant on the rear side of the flux tower. However moss-dominant areas were limited. The roughness length was 0.005 m.
Measurements and data processing
An eddy covariance system consisting of a three-dimensional sonic anemometer (CSAT3, Campbell Scientific Inc) and an open-path CO2/H2O gas analyser (LI-7500, LI-COR) was installed on a 2.5 m tower at the study site in December 2002. The sampling rate was 20 Hz, and the data were stored in a data-logger (CR5000, Campbell Scientific Inc) with real-time processing every 30 min. A net radiometer (CNR-1, Kipp & Zonen), capable of measuring the aforementioned four radiative components was installed 1.6 m above the ground on the flux tower in December 2005. The radiation was sampled every 20 seconds and half-hourly averaged data were stored in the same data logger.
Two automatic weather stations (AWS) were located over bare soil near the shore c. 200 m north-west of the flux tower. Wind speed and direction (W102 Skyvane, Qualimetrics), downward shortwave radiation (Precision Spectral Pyranometer, Eppley), downward longwave radiation (Precision Infrared Radiometer, Eppley), net radiation (NR-Lite, Kipp & Zonen), air temperature and humidity (HMP35C, Vaisala), and precipitation (Tipping Bucket, Qualimetrics) were measured and also used in this analysis. Data were sampled at every ten seconds and ten-minute averaged data were stored in two data loggers (CR1000 & CR23X, Campbell Scientific Inc). Later, the data were averaged over 30 minutes for the analysis. Sensor specifications are summarized in Table I.
Sensor specifications. u is the longitudinal wind component, v the lateral wind component, U the mean horizontal wind speed and Ts the sonic temperature.

Data quality and error estimate
Turbulent fluxes
For tilt correction of the sonic anemometer due to the slope of the surface, a double rotation was applied such that the half-hourly mean w was equal to 0, which led to nearly 3 and 4% increases in the sensible heat and latent heat fluxes, respectively. As water vapour density was measured for the latent heat flux by the CO2/H2O gas analyser, a density variation correction was made to the coordinate rotated water vapour flux. (Webb et al. Reference Webb, Perman and Leuning1980), resulting in an increase of 8% on average. To evaluate the effect of different coordinate rotations on the fluxes, double rotated fluxes were compared with planar-fit rotated fluxes (Wilczak et al. Reference Wilczak, Oncley and Sage2001). Planar fit rotation was applied to each 45 degree sector of wind direction. To estimate appropriate regression planes to the observed wind velocities and wind direction, bad data were removed from the regression through quality control. The difference between double-rotated and planar-fit rotated fluxes was negligible (< 1%). Typically, turbulent fluxes are calculated on a half-hourly basis, a time scale that includes most low-frequency eddies that significantly contribute to the vertical transport. Occasionally, low-frequency eddies with a time scale of one or two hours can contribute to vertical transport (e.g. Finnigan et al. Reference Finnigan, Clement, Malhi, Leuning and Cleugh2003). To evaluate the effect of different time-averaging on the fluxes, fluxes averaged over one or two hours were compared to arithmetically averaged fluxes using two or four half-hourly fluxes. The differences were negligible. In this study, sensible heat flux by using the sonic temperature was used as it approximates the surface heat flux (Paw et al. Reference Paw, Baldocchi, Meyers and Wilson2000). Therefore, for further analysis double rotated half-hourly averages of the sensible heat and latent heat fluxes were used with < 10% error overall, a rate that is considered acceptable in surface layer flux measurements.
Radiation
Prior to the analysis, radiation data were compared. Half-hourly averages of downward shortwave radiation (RSDN) from the CNR-1 radiometer were c. 5% greater (with RMSE = 20 Wm-2) than those from the Eppley pyranometer. However, RSDN is known to be susceptible to errors at high latitude such as those of Antarctica, resulting from a poor cosine response at zenith angles > 80°. During the summer season, the sunrise time shifted from ~02h00 (early December) to 05h00 (late February). At the same time, the sunset shifted from 19h13 to 21h50. During the daytime, the RSDN measured at a zenith angle of > 80° was 23% of the total data at daytime. Van den Broeke (Reference Van den Broeke, Reijmer and Van de Wal2004) suggested a remedy for this, as follows:

where αac = −(∑24hRSUP/∑24hRSUP). Data of the 12 h preceding and subsequent time of measurement were used. Since Eq. (6) should be applied to the RSDN from the Eppley as well as that from the CNR-1, it was assumed that the RSUP from the CNR-1 could be used for the correction of the RSDN from the Eppley. With the correction, the difference was < 5% with a reduced RSMSE of 13 Wm-2. For daily totals the RMSD was nearly 6%, which is less than the factory specifications in Table I. As the RSDN from the Eppley is more reliable, the CNR-1 may overestimate net shortwave radiation by c. 5%. Moreover, the downward longwave radiation (RLDN) by the CNR-1 agreed with the RLDN by the Eppley infrared radiometer within 2% (RMSE = 12 Wm-2 and ~3% for the daily totals). Measurement has been taken of the net radiation using the NR-Lite over bare soil 200 m north of the flux tower starting in December 2002, while the Rn was likewise measured by the CNR-1 staring in December 2005. The monthly averaged Rn from the CNR-1 in January and February 2006 was an average of 38% greater than the Rn from the NR-Lite. This was mainly attributed to the performance of the two sensors based on a comparison experiment in 2007. In this study the Rn from the NR-Lite was used to determine whether the surface was exposed.
Gap-filling of turbulent data
While the data from the AWSs were obtained continuously except for the replacement of instruments, the rates of missed or rejected data for H and λE ranged from 21–55% and 34–70% on a monthly basis, mainly due to rain and snow but also the calibration of the open-path CO2/H2O gas analyser. The missing or rejected data were substituted with data obtained using a look up table method (e.g. Falge et al. Reference Falge, Baldocchi, Olson, Anthoni, Aubinet, Bernhofer, Burba, Ceulemans, Clement, Dolman, Granier, Gross, Grünwald, Hollinger, Jensen, Katulm, Keronen, Kowalski, Lai, Law, Meyers, Moncrieff, Moors, Munger, Pilegaard, Rannik, Rebmann, Suyker, Tenhunen, Tu, Verma, Vesala, Wilson and Wofsy2001) and a multiple imputation (Shafer Reference Schafer1999) to evaluate mean turbulent energy exchange during the summer seasons and to compare the results against those obtained at other sites. The gap-filling methods are described in brief here.
Using the lookup table method, H or λE could be determined based on the environmental conditions associated with the missing or rejected data. Based on the correlation matrix among variables from the Norm software (version 2) explained below, H and λE have a relatively high correlation with RSDN or Rn, D and T in that order. For the look up table method, Rn and D were the sorting variables with a monthly assigned period. Average fluxes were compiled for 11 monthly periods×15 D-classes×38 Rn-classes. Gaps in the look up tables were interpolated linearly.
The multiple imputation (MI) method is an approach to the statistical analysis of incomplete data. In the MI method, each missing datum is replaced by m > 1 simulated values. The resulting m sets of the complete data can then be analysed using standard complete-data methods, and the results combined to produce the mean estimate as well as the confidence interval of the mean. Norm (multiple imputations of incomplete multivariate data under a normal model, Schafer Reference Schafer1999) was used to gap-fill the missing or rejected data. Half-hourly averages of measured or missing RSDN, Rn, H, λE, U, wind direction, T and D values were used as input variables to fill the missing or rejected H and λE on a monthly basis. Each month, five sets of complete data of turbulent fluxes were created and used for one complete dataset.
Daily averaged H and λE filled by the lookup table method agreed with the corresponding fluxes by multiple imputations method within 1% (RMSE = 10 Wm-2) and 5% (RMSE = 3 Wm-2), respectively. In addition, measured data were replaced with the data from the lookup table method, and this was compared to the measured data. Based on a linear regression analysis using half-hourly data, they agreed well and were within < 11% for H (RMSE = 28 Wm-2) and < 14% for λE (RMSE = 10 Wm-2). In this study, data filled via the lookup table method was used for further analysis.
Results and discussion
Meteorological characteristics
Figure 2 shows monthly averaged T, e, RSDN and U from January 2003–February 2006. The monthly averaged temperature showed pronounced seasonal variations with a range of -7.7 to 2.8°C. The temperature in each January and February was above zero for each year. The temperature in December, however, showed a different behaviour according to the year. In December 2003, it was below zero whereas the temperature in December 2004 and 2005 was above zero. The temperatures of December, January and February averaged over 1988–2004 were 1.0, 2.2, and 2.0°C, respectively. During the last four years, the temperature in December was lower than the mean, especially in 2003. The dependency of temperature and water vapour pressure on wind direction is one of the climatological characteristics around the Antarctic Peninsula (King & Harangozo Reference King and Harangozo1998, Lee et al. Reference Lee, Kwon, Lee, Yoon and Kim2003, Choi et al. unpublished). In December 2003, an easterly wind with a cold air mass was dominant. Although an easterly wind was frequent in December 2004, westerly and north-westerly winds bringing warm air masses were also frequent. The dependency was also reflected in the variations of water vapour pressure. Monthly averaged water vapour pressure ranged from 3.1 to 6.7 mb. Due to low temperature, water vapour pressure was not high even in summer. Overall, water vapour pressure was highest in February and lowest in December.
The monthly average a. air temperature, b. water vapour pressure, c. downward shortwave radiation, and d. wind speed from January 2003 to February 2006.

For the downward shortwave radiation, it was largest in December (up to 210 Wm-2), an observation associated with the winter solstice. It was smallest in February at < 57% of the value in December. The downward shortwave radiation averaged over the summer was approximately 160 Wm-2, which was virtually the same as the average over the summer from 1996–2004 at the same site. This value was smaller compared to that reported for the Antarctic continent. For example, van den Broeke et al. (Reference Van den Broeke, Reijmer and Van de Wal2004) showed that the downward shortwave radiation averaged over December and January for four years of 1997–2001 or 1998–2002 was greater than 300 Wm-2 at four Antarctic automatic weather stations in Dronning Land, East Antarctica, which is located at an approximately 10° higher latitude than this study site. The relatively small downward shortwave radiation was attributed to high levels of cloud associated with the frequent passage of low-pressure systems in summer.
The monthly averaged wind speed was over 5 ms-1. In 2003 and 2004, the wind speed in winter was stronger than that in summer with pronounced seasonal variations. This behaviour is typical around the site based on the wind data from 1988 to 2004. However this was not the case in 2005. The wind speeds in December, January and February averaged over 1988–2004 were 6.9, 6.7, and 7.3 ms-1, respectively. Although the wind speed in January was slightly weaker at 5.9 ms-1 than the mean, the wind speed at the site was strong.
Radiative fluxes
Figure 3 shows daily averaged net shortwave (Rns)/longwave (Rnl) radiation and albedo from December 2005–February 2006. During this period, Rns was positive with a range of 8–329 Wm-2. In early December, Rns was small due to a high albedo. As snow/ice melted and disappeared, the albedo dropped abruptly and did not change significantly until late February with a value of 0.12 on average. Despite its large variability due to precipitation or frequent passage of cloud, the magnitude of Rns was significant until mid January. After that time, Rns tended to decrease as the solar elevation decreased. In the meanwhile, Rnl was nearly negative with a range of -100 to 3 Wm-2. This indicates that the study site lost energy over most summers in terms of its longwave radiation budget. However the energy gained by solar radiation was greater than that lost by longwave radiation, resulting in an energy gain of 3–234 Wm-2 (110 Wm-2 on average). Although the RSDN was not large as mentioned earlier, Rn was significant. The ratio of Rn to RSDN was 0.62 at the site and was greater than the typical ratio of Rn to RSDN at other regions of ice, snow, or glacier in the Antarctic continent or the Antarctic Peninsular. For example, Bintanja (Reference Bintanja1995) showed that the ratio of Rn to RSDN was approximately 0.27 from December to January 1990–91 at the Ecology Glacier on King George Island. Braun et al. (Reference Braun, Saurer, Vogt, Simões and Goßmann2001) showed that the ratio was smaller than 0.1 at four AWS sites on the King George Island ice cap from December 1997–January 1998. Van As et al. (Reference Van As, Van den Broeke, Reijmer and Van de Wal2005a) reported a very small ratio from January–February 2002 at the Antarctic high plateau. The large net radiation was a major source of the surface energy budget components at the site in summer, as will be subsequently discussed.
Daily averaged a. net shortwave (Rns) and longwave (Rnl) radiation and b. net radiation (Rn) and albedo from December 2005 to February 2006.

Energy budget closure
The surface at the study site mainly consisted of various sizes of rock and gravel. Soil occupied < 10% per unit area. This made it difficult to measure representative ground heat flux using heat flux plates or soil temperature profile. Ground heat flux is important in permafrost areas, as permafrost acts as a strong heat sink. In spite of the footprint mismatch among energy budget components, energy budget closure is also used as one measure of data quality. Since ground heat flux were not available, energy budget closure was examined using (H+λE)/RSDN on a daily basis for three (the second from December 2003–February 2004, the third from December 2004–February 2005, and fourth from December 2005–February 2006) summer seasons, respectively (Fig. 4). RSDN, not the Rn at bare soil (Rnbs), was used as a scale factor to consider the effect of snow/ice on the budget. Additionally, Rnbs/RSDN was also plotted to determine whether ice and/or snow covered the surface. For example, a low Rnbs/RSDN indicates that the surface was covered with snow or ice. For the fourth summer, Rn as measured at the flux tower was also used as a scale factor with (H+λE)/Rn added. A period of 36 days with >42 turbulent flux data per day was selected for this analysis. Missing or rejected data were filled with linear interpolations. As the data occurred when the net radiation was small, the effect of the uncertainties by the interpolation on daily mean would be negligible. Based on the variations of the three summer seasons, three characteristics were noticed. First, (H+λE)/RSDN was lower in early summer and higher in mid or late summer. Second, when the ratio was relatively low, λE/RSDN was higher relatively. Finally, there were differences in the phases of the variation. During the second summer, the period with a low ratio (< 0.2) was longer compared to the other seasons. The ratio increased to 0.4 in mid summer and to 0.5 in late summer. In the meanwhile the ratio was greater than 0.5 before mid December in the third summer. The ratio tended to decrease after late January. For the fourth summer, the ratio was less than 0.4 in December. In January, it increased to > 0.5 and the ratio was still large in late February. Rn measured at the flux tower was also used for the ratio in place of RSDN during the fourth summer. In December, the sum of H and λE was less than 60% of Rn. However, it accounted for > 80% of Rn on some days in January and February. It is likely that the surface energy budget may be closed without significant uncertainty.
Sensible (H), latent (λE) heat fluxes and net radiation (over bare soil) normalized by downward short wave radiation for three summer seasons on daily basis. For the fourth season, the net radiation (from flux tower, Rnveg) was also used instead of RSDN. a. December 2003–February 2004, b. December 2004–February 2005, c. & d. December 2005–February 2006.

A low ratio occurred over the second summer. This can be explained by the existence of snow/ice due to cold weather, under which net radiation was used to melt snow/ice, resulting in small turbulent fluxes. In this case, the latent heat flux was comparable to the sensible heat flux due to a sufficient supply of meltwater. In late December, the Rnbs/RSDN was sizable, however, (H+λE)/RSDN was low. This can be explained by the surface heterogeneity. Rnbs was measured ~200 m away from the flux tower. As λE/RSDN was higher than H/RSDN, the area near the flux tower was probably still covered with snow/ice. Low (H+λE)/RSDN between larger values may be attributed to snow events near the flux tower. Except in December 2003 and except for a small number of days with low (H+λE)/RSDN in the other months including the third and the fourth summers, the magnitudes of Rnbs/RSDN and (H+λE)/RSDN may show that (H+λE)/RSDN was obtained over a surface without snow/ice. On days without snow/ice, relatively low (H+λE)/RSDN indicates that much of Rn was partitioned into G to melt frozen ground. The difference in the phase of the (H+λE)/RSDN variation for three summer seasons is attributed to temperature. With the advance of summer, the increase in temperature was earlier in the third summer compared to the other summer seasons. Monthly averaged temperature was already above zero in November 2004. This caused the snow/ice to melt in earlier in November or early December 2004. The Rn was used to melt the frozen ground, which reduced the partitioning of Rn into turbulent fluxes. After the ground warmed up, more energy from Rn was partitioned into turbulent fluxes, thus increasing the turbulent fluxes. This is contrary to the phenomenon observed during the second summer.
Mean diurnal variations
In this section, mean diurnal variations of the radiative and energy budget components on days with both low (LNR) and high (HNR) normalized ratios in the fourth summer are discussed, during which four radiative budget components were available. Four radiative budget components are plotted in Fig. 5a & b. It was relatively clear on the LNR day. RSDN reached a maximum > 800 Wm-2 whereas RSUP was less than 100 Wm-2 due to the low albedo. The magnitude of RLUP (300–370 Wm-2) was larger than that of RLDN (240–275 Wm-2) all day, resulting in an energy loss with < |120| Wm-2. The resultant net radiation showed a maximum of ~ 625 Wm-2. For the HNR day, the RSDN was less than ~ 470 Wm-2. In the meanwhile, RSUP was also small at < 50 Wm-2. As on the LNR day, the magnitude of RLUP (320–360 Wm-2) was larger than that of RLDN (280–300 Wm-2) all day with an energy loss of < |75| Wm-2. The resultant net radiation reached a maximum of ~ 240 Wm-2. With the exception of RLUP, the magnitude of the radiative budget components was larger on the LNR day than on the HNR day.
Mean diurnal variations of the radiation budget components on days a. with low normalized ratio, and b. with high normalized ratio. RSDN indicates downward shortwave radiation, |RSUP| upward shortwave radiation in absolute value, RLDN downward longwave radiation, and |RLUP| upward longwave radiation in absolute value.

Figure 6a & b shows the mean diurnal variations of the Rn, H, λE and G corresponding to the days represented in Fig. 5. G was derived as a residual in Eq. 1 (i.e. Rn- H-λE) assuming energy budget closure at the site. On the LNR day, Rn ranged from -65 to 625 Wm-2. H (with an amplitude of -23 to 240 Wm-2) and λE (5–83 Wm-2) accounted for 20–56% and 13–20% of Rn during the daytime, respectively, whereas G (-65 to 306 Wm-2) accounted for 20–60% of Rn. More of the fraction of Rn was partitioned into G than H, apart from late afternoon during the daytime. On the HNR day, Rn was in the range of -35 to 350 Wm-2. H (0–196 Wm-2) was 40–80% of Rn, whereas λE (5–30 Wm-2) and G (-57 to 172 Wm-2) were 8–12% and 10–56% of Rn, respectively, during the daytime. On this day, a greater fraction of Rn was partitioned into H than G except early in that morning. On both days, the smallest fraction of Rn was partitioned into λE. Although a pronounced difference in the magnitude of Rn, λE and G for both days, the difference in the magnitude of H was not significant. There was no significant difference (at a significance level of α = 0.05) in the averages of H between the LNR and the HNR days. Based on the daily mean, H was ~20% greater on the LNR day than on the HNR day although Rn was nearly 80% higher on the LNR day.
Same as Fig. 5 but showing net radiation (Rn), sensible heat flux (H), latent heat flux (λE) and ground heat flux (G).

Figure 7a & b shows the mean diurnal variations in the surface temperature (Tsfc), T and Tsfc–T. Tsfc was derived from RLUP assuming that the emissivity of the surface was 0.98. Wind speed was stronger on the LNR day except at night-time. The temperatures were similar to each other during the daytime, but were lower on the LNR day at night-time, when they approached zero. Surface temperature was higher on the LNR day due to strong RSDN and was lower at night time, resulting from the stronger radiative cooling. However, there was no significant difference (at a significance level of α = 0.05) in the averages of Tsfc between the LNR and the HNR days. During the daytime, Tsfc–T was higher on the LNR day with a stronger wind speed, which resulted in a larger H. This was negative, however, resulting in negative H at night. Again, there was no significant difference (at a significance level of α = 0.05) in the averages of (Tsfc-T) between the LNR and the HNR days.
Same as Fig. 5 but showing surface temperature (Tsfc), air temperature (T) and Tsfc-T.

In summary, on the LNR day (i.e. in relatively early summer) Rn was significant due to the strong RSDN. The partitioning of Rn into H, λE and G was considerable, especially in case of G. On the HNR day (i.e. in mid summer), despite the relatively small Rn, H remained significant due to the high Tsfc. This indicates that the ground warmed more in mid summer and favoured the partitioning of Rn into H. The mean radiation, H, λE, G, U, T and Tsfc are summarized for each case in Table II.
Mean values of radiation, energy fluxes, wind speed (U), air temperature (T) and surface temperature (Tsfc) on the low-normalized ratio day (LNR) and the high-normalized ratio day (HLR). The units of radiation and energy fluxes are in Wm-2, the wind speed is in ms-1 and the temperature is in °C.

Monthly averaged radiative and turbulent energy fluxes
Figure 8 shows the monthly averaged H, λE and G during the four summer seasons. Ground heat flux was derived as a residual assuming that the energy budget was closed. For this, Rn, which was 1.38 times larger than Rn by NR-Lite, was used in the energy budget, based on the difference between the CNR-1 and the NR-Lite in January and February 2006. The monthly averaged Bowen ratio was also plotted. The monthly average of H ranged from ~2 (December 2003) to ~64 Wm-2 (January 2003) and showed more variability compared to the monthly average of λE with a range of 13–22 Wm-2. The monthly average of G was in the range of 20–63 Wm-2. G in January 2004 and December 2006 was not used as it was deemed unrealistically large. The variability of the H was greater in December and January, while less variability existed in February. Figure 9 shows the relationship between the monthly average H and RSDN. Out of 11 data instances, seven were on or near the 1:1 line. Four instances deviated from the line. They represent every instance in December and January 2004. Given that temperature was near or below zero, much more snow/ice may have covered the area in December than in the other months. The relationship between the monthly average Bowen ratio and RSDN was also identical to H (not shown), indicating that λE increased due to the melting of snow/ice on the surface. In 2003, successive low temperature in November and December delayed the melt of snow/ice on the surface and suppressed Rn through the high albedo in spite of the large RSDN with the advance of summer. Although temperature in January 2004 was above zero, there remained areas covered with snow/ice within the flux footprint. However, most of the site surface appeared free from snow/ice in February 2004, and H was the largest during that season. Except for the period of the second summer (December 2003–February 2004), H was the lowest in February, resulting from the small RSDN and the resultant small net radiation. The monthly average Bowen ratio was over 1 and reached nearly 4 except in December 2003. This indicates that the surface without snow/ice was relatively dry and that the atmosphere was heated mainly by H in summer seasons. In contrast to H, G was the largest in December. G in December appeared to have been higher than H. G was the lowest in February, when G appeared less than H. Due to the increase in temperature from December to February, the partitioning of Rn into H increased. However, G acted as a significant sink for the atmospheric energy in summer.
The variations of monthly average sensible heat flux, latent heat flux and ground heat flux. The monthly averaged Bowen ratio is provided.

The relationship between the monthly average sensible heat flux (H) and downward shortwave radiation (RSDN). 1:1 was derived using the data marked with filled circles.

Comparison with other sites
To compare radiative and turbulent energy exchange at the site with energy exchanges near this site, the energy budget components at King George Island and on the Antarctic Peninsula are summarized in Table III. At the study site, values were provided in January and February when the effect of snow or ice on the surface energy budget was minimized. Overall, the magnitudes of energy budget component varied depending on the latitude or elevation. RSDN at the other sites were greater than 200 Wm-2 except for that at McClary Glacier, the Antarctic Peninsula, in which RSDN was not reported. However, Rn was small and the ratio of Rn to RSDN was less than 0.31. It is worthwhile to note that the ratio averaged over January to February was greater than 0.5 at the site in 2006. The discrepancy was attributed to different albedo magnitudes. Except for at the study site, H had a small or large negative value. λE was also small except for at the glacier, the Antarctic Peninsula at 25.5 Wm-2. H (from the atmosphere to the surface) was an important source for evaporation from the glaciated surface. The sums of H and λE were small positive or large negative values. This indicates that the surface played a role as a weak heat source or heat sink for the atmosphere even in summer. In contrast, Rn was a dominant source for λE at the site. A great amount of turbulent energy flux indicates that the non-glaciated area was a relatively strong heat source for the atmosphere, which may imply that the local climate is more complicated due to the significant difference in the magnitude and the mechanism of heat exchange that resulted from different land surface characteristics.
Mean albedo, radiative and energy fluxes at and near the Antarctic Peninsular during summer. The unit of radiative and energy fluxes is in Wm-2. Sign convention at the study site was applied such that turbulent fluxes directed away from the surface were defined positive. * indicates estimated values from Rn measured for bare soil using the relationship between two radiations on a monthly basis in 2006. At the study site, values were provided in January and February when the effect of snow or ice on the surface energy budget was minimized.

aBraun et al. (Reference Braun, Saurer, Vogt, Simões and Goßmann2001), bSchneider (Reference Schneider1999), cBintanja (Reference Bintanja1995), dThis study.
Evaporation
For many previous studies conducted in Antarctica, λE was quantified over snow/ice covered surfaces mainly using surface energy budget models. In contrast, the λE was directly measured in this study where lichen and moss grew. Therefore, it is worthwhile to discuss λE further. Overall, λE was small compared to H. Evaporation (= λE divided by the latent heat of vaporization, λ) was on average < 1 mm d-1, ranging from 14 to 23.6 mm month-1. Precipitation in January, February, and December 2003 and 2004 ranged from 30 (February 2004) to 129 mm (February 2003). The ratio of evaporation to precipitation ranged from 0.11 to 0.56. Evaporation appeared limited in spite of the large variability of precipitation. To understand the physical or biological influence on evaporation, monthly daytime averaged ga, gc and gi were evaluated (Fig. 10). ga depends on wind speed and surface roughness. On average, ga was 20 mm s-1. The variability of ga agreed well with that of the mean horizontal wind speed. The exception was December 2003, when ga was at its smallest while wind speed was not, as most of the surface was covered with snow and ice. gc was less than 10 mm s-1, except for December 2003, when it reached 30 mm s-1. Typical values of ga and gc for well-watered grass/cereal are 20 and 20 mm s-1 (Kaimal & Finnigan Reference Kaimal and Finnigan1994). While ga at the site was comparable to that for well-watered grass/cereal, gc was significantly smaller, except for December 2003. A larger gc would result in a larger λE. In spite of a larger gc in December 2003, however, λE was not large compared to those in the other months. When ga is substantially greater than gc, evaporation is more controlled by gc or vapour pressure deficit than by available energy. In December 2003, most of the turbulent fluxes were used for λE. However, temperature was low, resulting in a low D. This may limit evaporation from the surface although melted water may exist, which otherwise could be evaporated on the surface. gi depends on available energy, temperature and vapour pressure simultaneously. While available energy showed a large variability (not shown), gi appeared relatively constant, which was likely due to the low D. In conclusion, evaporation may be limited mainly by a low D even if precipitation and energy for evaporation is sufficient.
The monthly daytime average aerodynamic (ga), surface (gc) and climatological (gi) conductance. The error bar indicates the standard deviation. Northerly data were not used due to a possible flow distortion by the building c. 30 m northward of the flux tower.

Summary and conclusions
Based on observed records, the increase in the air temperature was relatively slow in summer compared to winter on the Antarctic Peninsula. However, as glaciers or ice sheets melt in summer due to the higher temperatures, it is important to understand the local climate in that region in summer. To evaluate energy exchanges between a non-glaciated surface and the atmosphere, an eddy covariance system was established, and turbulent fluxes of sensible and latent were measured starting in December 2002 near King Sejong Station, King George Island near the Antarctic Peninsula. Due to its location in sub-Antarctic westerly region, monthly averaged downward shortwave radiation was not large (< 210 Wm-2) due to high levels of cloud associated with the frequent passage of low pressure systems compared to values in the Antarctica continent. When the air temperature was above zero, however, the surface albedo was significantly reduced due to the melting and disappearance of snow/ice and the resultant monthly averaged net radiation reached nearly 130 Wm-2, an order of magnitude larger than that at glaciated areas on the Antarctic Peninsula. A large net radiation produced large energy fluxes. The monthly average sensible heat flux reached 64 Wm-2 with much variability due to the surface states. In contrast, the monthly average latent heat flux was relatively constant, with a range of 15–20 Wm-2. The monthly average turbulent energy fluxes reached ~80 Wm-2, which was an order of magnitude larger than those (-34.8 to 5.6 Wm-2) at glaciated areas on the Antarctic Peninsula. Evaporation was low at < 1 mm d-1 on average and was mainly limited by a small vapour pressure deficit due to low air temperature despite sufficient energy and precipitation for its occurrence. Ground heat flux was also a dominant energy budget component and acted as a significant sink for atmospheric heat throughout summer season. In conclusion, significant energy exchanges between the non-glaciated area and the atmosphere in summer existed compared to the glaciated landscape on the Antarctic Peninsula. In addition, the heat exchange mechanism differed from those over ice-covered or glaciated surfaces on the Antarctic Peninsula, where sensible heat flux from the atmosphere to the ground was also a major source of latent heat flux. In the meanwhile, the latent heat flux was driven by Rn at the study site. Additional modelling approaches are required to evaluate how non-glaciated areas play in the local climate system. Since ground heat flux was estimated as a residual in the energy budget assuming the energy budget closure in this study, it is necessary to evaluate it using independent methods for a better understand of the surface energy budget and for validation and improvement of the numerical models. If the air temperature continues to increase, the non-glaciated area will probably enlarge, indicating that more energy can be transferred into the atmosphere. This illustrates the importance of non-glaciated areas in the local climate system. Therefore, further researches are needed to understand how major land areas, including non-glaciated areas and the sea, influence the local climate before predictions of how the local climate responds to variability in the large-scale climate, especially in summer, can be made.
Acknowledgements
This study was supported by the Integrated Research on the Composition of Polar Atmosphere and Climate Change (COMPAC, PE07030)' Project of the Korea Polar Research Institute. This study was also partly supported by The Eco-Technopia 21 Project of the Ministry of Environment of Korea.



