1 Introduction
As people reach old age, many of them need help from other people with basic daily activities such as eating, bathing and moving around. Informal care provided by family members is an indispensable part of the long-term care system in a country, which helps older people maintain their performance of daily activities and participation in social activities. As population ageing continues to accelerate worldwide, increasing demand for informal care will be a global phenomenon. The past two decades have seen the number of older people in the People’s Republic of China (PRC) increase rapidly, and there is no sign that this is going to slow down in the foreseeable future. The United Nations (2016) has projected that the number of older people aged 60 years and over will rise by 96%, from 210 million to 410 million, in the next two decades in China. In particular, people aged 80 years and over will be the fastest growing group, rising by 168%, from 22 million to 60 million. Indeed, China is regarded as a typical case where the population will ‘grow old before getting rich’ (Cai and Wang, Reference Cai and Wang2009). In this context, it is anticipated that the number of Chinese older people who need to receive informal care will also increase sharply.
Despite a consensus that the rising demand for long-term care will be a serious challenge facing both the Chinese government and society (Li et al., Reference Li, Zhang, Zhang, Zhang, Zhou and Chen2013; Lu et al., Reference Lu, Liu and Piggott2015), very little is known about the exact level of resources that will be required to meet older people’s care need in the future. This paper combines the macrosimulation approach and the Markov approach to make projections on the demand for informal care by older people in the next two decades in China. The research findings will be useful to inform policymaking, as the Chinese government is now making plans in regard to developing the formal social care sector to address the challenges of population ageing.
2 Long-term care system in China
Unlike many developed countries, where the long-term care system consists of both formal social care provided by the state and private enterprises and informal care provided by family carers, China still relies heavily on informal care to meet older people’s daily living needs. It is estimated that 43 million disabled older people are currently receiving informal care per year (Hu and Ma, Reference Hu and Ma2016). With the ageing of the ‘baby boomer’ cohort and the continuous decline in the fertility rate in the Chinese population, serious doubt has been raised about the sustainability of a system where informal care is the main source of support for frail older people (Silverstein et al., Reference Silverstein, Cong and Li2006; Grujiters, Reference Grujiters2017).
The formal care sector in China is still in its infancy (Zhou and Walker, Reference Zhou and Walker2016). Only a tiny proportion of frail older people receive formal care each year. Publicly funded care home services are only available to older people with no offspring, no income and no ability to look after themselves, also known as the ‘three Nos’ (Wong and Leung, Reference Wong and Leung2012). Care home fees are expensive, so self-funded care home residents are more likely to be older people with a higher income rather than those with a disability and in need of help (Feng et al., Reference Feng, Zhan, Feng, Liu, Sun and Mor2011; Lei et al., Reference Lei, Feng and Wu2016).
The Chinese government has been trying to increase the capacity of community-based formal care such as professional home care and day care for years, but since the whole sector started from almost nothing, care facilities remain unavailable in many parts of the country. The government plans to make care facilities available to older people in 90% of the urban communities and 60% of the rural villages by 2020 (State Council, 2013). However, a national survey conducted in 2014 shows that so far only 19% of the urban communities or rural villages have a day care centre (National Survey Research Centre, 2014). Moreover, many older people are unaware of the availability of community-based care services. For those who are aware of these services, many prefer informal care to formal social care (Zhan and Montgomery, Reference Zhan and Montgomery2003). As a result, the utilisation of community-based formal care is low. It is estimated that 43% of older people aged 60 years and over have care needs. Yet only 0.2% of older people have received services from a day centre, and 2% have received paid help with housework. The receipt of personal care at home from professional carers is rare (National Survey Research Centre, 2014).
Nonetheless, the Chinese government is determined to build a long-term care system where ‘home-based care is the foundation, community-based care provides the necessary support and residential care is supplementary’ (Feng et al., Reference Feng, Zhan, Feng, Liu, Sun and Mor2011). The local governments in China are granted discretionary power in regard to administering, providing and financing local long-term care services. Therefore, the objective set out by the central government is subject to substantial local interpretation. In Beijing, the capital city of China, this means that once the policy is fully implemented in the future 90% of the older population will either receive only informal care or not receive any long-term care, 6% will receive community-based care and the rest (4%) will live in care homes. This is also known as the ‘9064’ model (Beijing Municipal Government, 2013). In contrast, Shanghai, a megacity in east China, interprets this as 90% of older people receiving informal care at home, 7% receiving community-based care and the rest (3%) living in care homes (i.e. the ‘9073’ model) (Shanghai Municipal Government, 2011).
3 Theoretical framework
The theoretical foundation of our projection approach is the behavioural model of care services utilisation proposed by Anderson and Newman (Reference Anderson and Newman2005), which divides potential determinants of receiving care into three categories: need factors, predisposing factors and enabling factors. Previous studies show that both people’s need for care, which is usually measured by severity of disability (Suanet et al., Reference Suanet, Van Groenou and Van Tilburg2012; Wolf, Reference Wolf2014; Vlachantoni et al., Reference Vlachantoni, Shaw, Evandrou and Falkingham2015), and people’s predisposing characteristics such as age, gender and level of education (Murphy et al., Reference Murphy, Whelan and Normand2014; Jacobs et al., Reference Jacobs, Groenou, Aartsen and Deeg2016) are important drivers of care demand. Enabling factors such as older people’s marital status and living arrangements indicate the availability of informal carers and impose constraints on demand for informal care (Larsson and Silverstein, Reference Larsson and Silverstein2004; Glaser et al., Reference Glaser, Stuchbury, Tomassini and Askham2008). They have also been conceptualised as supply factors in the literature (Wolf, Reference Wolf2014). Marital status and living arrangements are not the only supply factors. A systematic examination of the supply factors requires a separate discussion on the propensity to provide care, which is beyond the scope of this study.
Demand for informal care cannot be directly observed, but is a function of the demand drivers. What can be observed is the utilisation or the receipt of informal care. This represents a state of equilibrium where demand matches supply. Using this equilibrium state as the starting point, our projection model simulates the changes in the drivers of demand. Meanwhile, it is assumed that the supply of informal care can keep up with demand in the future. In this case, the projected number of people receiving informal care will be equivalent to the projected demand for informal care.
4 Research methods
4.1 Overview of data and model structure
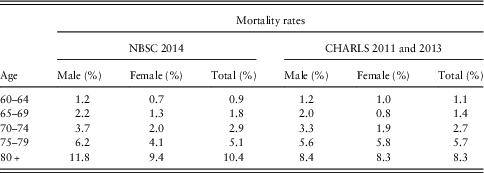
The data used in this paper come from the China Health and Retirement Longitudinal Survey (CHARLS), which collects health and ageing-related information on people aged 45 years and over in private households in China. The baseline interviews (CHARLS 2011) were conducted in 2011. A total of 17,708 individuals in 28 provinces across China participated in the survey. This represented a response rate of 80%. Following a four-stage cluster sampling procedure, the survey provided a nationally representative sample (Zhao et al., Reference Zhao, Strauss, Yang, Giles, Hu, Hu, Lei, Liu, Park, Smith and Wang2013). The same respondents were followed up two years later in the second wave (CHARLS 2013). Among the 17,708 respondents in the CHARLS 2011, 2.5% (n=435) had died by the time of the second wave. The annual mortality rates among older people aged 60 years and over reported by the CHARLS are consistent with those reported by the National Bureau of Statistics of China (2014) (Table 1). Data from both waves are used in our analysis. Apart from the CHARLS data, the population forecast data published by the United Nations (2016) and information from the Chinese Longitudinal Healthy Longevity Survey (CLHLS) were also used in our analyses. Zeng (Reference Zeng2008) provided a more detailed description of the CLHLS data set.
Annual mortality rates reported by the National Bureau of Statistics of China (NBSC) and the China Health and Retirement Longitudinal Survey (CHARLS)

The construction of the projection model consisted of three stages. In the first stage, we built regression models to identify the important drivers of demand for informal care in the Chinese context. Then we built a macrosimulation model to calculate people’s propensity to receive informal care according to these demand drivers. Finally, we made projections on the future trends of the demand drivers in a Markov model and inserted these projection results into the macrosimulation model.
4.2 Measurements
Before building the projection models, we first conducted regression analysis to identify the drivers of informal care utilisation in the Chinese older population. The dependent variable is the receipt of informal care. The selection of independent variables is based on the theoretical framework discussed in the previous section. The questions in relation to informal care receipt in CHARLS 2013 are different from those in CHARLS 2011, so the regression analysis is based on the information from the CHARLS 2011.
The CHARLS 2011 asked respondents whether they received informal help with activities of daily living (ADLs) and instrumental activities of daily living (IADLs) from family members or friends. ADLs are personal care tasks, while IADLs are tasks of a domestic nature. The CHARLS 2011 includes six ADLs (eating, dressing, bathing, using the toilet, controlling urination and defecation and getting in and out of bed) and six IADLs (cooking, shopping, making phone calls, taking medication, managing money and doing housework). If a respondent reported receiving informal care, the person was then asked how many hours of care they received from each informal carer each week. Based on the information obtained from these questions, we created three variables relating to informal care utilisation. The first one is a binary variable that indicates whether a person received informal care. The second variable measures the total hours of informal care received each week (i.e. informal care intensity). The third variable divides informal care recipients into three mutually exclusive categories according to sources of informal care: care from a spouse (including care from a spouse only and care from both a spouse and other family members), care from children but not from a spouse and care from others only. Among the older people who reported receiving informal care, 5.8% did not report the total hours of care. We compared the characteristics of older people who reported and those who did not report this information, and did not find a systematic difference between the two groups.
Older people’s care need was measured by the severity of their disability. The CHARLS 2011 asked respondents whether they could perform each of the ADLs or IADLs. Respondents could choose from one of the four choices: ‘I do not have difficulty’, ‘I have difficulty but can do it’, ‘I need help’ or ‘I cannot do it’. The last two choices were regarded as an indication of disability. Based on the information obtained from the answers to these questions, we created a disability variable with four categories: independence (no ADL or IADL disability), mild disability (IADL disability only), moderate disability (one ADL disabilities) and severe disability (two or more ADL disabilities). Such a measure is comparable with the variables used in the existing literature (Pickard et al., Reference Pickard, Wittenberg, Comas-Herrera, Davies and Darton2000).
Apart from disability, we also included age, gender, rural–urban residence and educational qualifications as predisposing factors, and marital status, living arrangements and receipt of paid help as enabling factors in the regression model. The CHARLS asked respondents about their educational qualifications. The question has nine categories: no formal education (illiterate), did not finish primary school, home school, graduate from primary school, graduate from middle school, graduate from high school, graduate from vocational school, Associate degree or Bachelor’s degree. We divided the older people into two categories according to their educational qualifications: those who were illiterate or did not finish primary school and those who had at least finished primary education. We divided the older people into two categories according to their marital status: those who were single and had never been married, divorced, widowed or separated (single people), and those who were married or cohabiting with their partners (married couples). We divided the older people into two categories according to their living arrangements: those who live alone and those who live with other people in the same household. Based on these two variables, we created a variable that combines marital status and living arrangements. The variable has four categories: older people who are single and live alone, older people who are single and living with others, older couples who live alone and older couples who live with other people.
4.3 Regression analysis
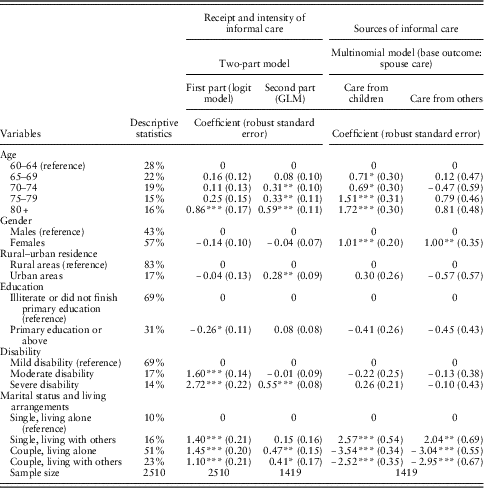
We built a two-part regression model to examine the determinants of receiving informal care and informal care intensity (columns 3 and 4, Table 2), and a multinomial logit regression model to examine the determinants of sources of informal care (columns 5 and 6, Table 2). The regression results show that older people in the higher age groups, people with lower educational qualifications, people with a more severe disability and people living with someone in the same household are more likely to receive informal care. Conditional on the receipt of informal care, people in the higher age groups, people living in urban areas, people with a more severe disability and people living with a spouse receive more hours of informal care each week. Conditional on the receipt of informal care, people in the higher age groups and females are more likely to receive care from children rather than from a spouse. In all, 0.7% (n=18) of the disabled older people reported receiving paid help. The receipt of paid help does not have a significant impact in any of the models.
Determinants of receipt, intensity and sources of informal care among older people with disability in China

Notes: Independent older people are excluded from the analysis. The generalised linear model (GLM) accounts for the highly skewed care intensity data. We tested a gamma regression model, a log-transformed regression model (i.e. the Gaussian family with a log link function) and a negative binomial regression model. The negative binomial model with a log link function has the best fit. The results of this model are reported in column 4.
*p<0.05; **p<0.01; ***p<0.001.
4.4 Macrosimulation model
The macrosimulation approach followed the methodology developed by the Personal Social Services Research Unit in the United Kingdom (Wittenberg et al., Reference Wittenberg, Pickard, Comas-Herrera, Davies and Darton1998; Wittenberg and Hu, Reference Wittenberg and Hu2015). Since we are drawing on information in a national survey to make statistical inferences on the entire older Chinese population, we extend the existing methodology by using the Bayesian approach and the Monte Carlo simulation technique to capture parameter uncertainty.
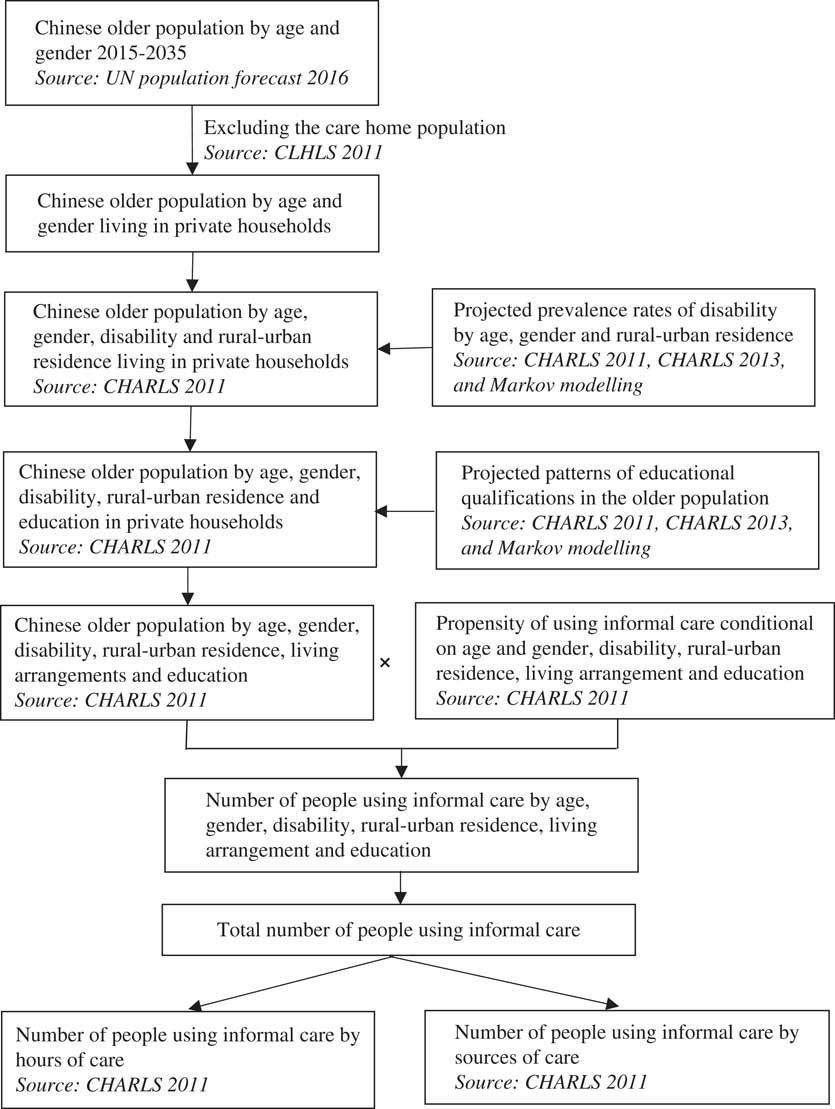
We constructed the base case of the macrosimulation model in the following steps (Figure 1):
1. We first used the prevalence rates of care home services utilisation derived from the CLHLS to divide the entire older population aged 60 years and over reported by the UN (2016) population forecast into those living in private households and those in care homes. The base year is 2015.
2. Informed by the regression analysis (column 3, Table 2), the model then divided the older population living in private households into 480 groups according to age, gender, rural–urban residence, disability, marital status, living arrangements and educational qualifications.
3. For each group, the Bayesian approach was adopted to estimate the propensity to receive informal care (Greenberg, Reference Greenberg2013; Kruschke, Reference Kruschke2015; Gill, Reference Gill2017). The receipt of care has a Bernoulli distribution. The calculation of the posterior distribution of the propensity parameters can be simplified due to the existence of a conjugate prior distribution, which is the beta distribution (see Supplementary Appendix A). The uniform distribution was chosen as the prior distribution. The execution procedures followed those set out by Briggs et al. (Reference Briggs, Claxton and Sculpher2006).
4. The total number of people using informal care was calculated by aggregating the informal care recipients in each group.
5. The care recipients were further broken down into sub-groups according to hours of informal care and sources of informal care. On the basis of the regression analysis (columns 4–6, Table 2), hours of informal care (0–9 hours, 10–29 hours, 30+ hours) are a function of age, disability, marital status and living arrangements, whereas sources of informal care are a function of age, gender, marital status and living arrangements. The Bayesian approach was used to estimate the propensity parameters. Observations on care intensity and care sources have a generalised Bernoulli distribution, and the conjugate prior is the Dirichlet distribution.
6. The number of informal care recipients was multiplied by its corresponding propensity parameter to calculate the number of older people with a certain care intensity or receiving care from a particular source.
7. The projection years of the model had the same structure as the base year, but were plugged with the future trends of the determinants of informal care utilisation. The numbers of older Chinese people by age and gender were projected to rise in line with the UN (2016) population forecast. Future prevalence rates of disability and level of education among older people were estimated by the Markov model (see below). The supply of informal care was assumed to keep up with the demand in the base case, but living arrangements and marital status were allowed to change in the sensitivity analysis. The propensity of care receipt for each group was assumed to remain constant in the projection years.
Structure of the projection models. Note: CHARLS=China Health and Retirement Longitudinal Survey.

4.5 Markov model
We constructed a Markov model and took the following steps to project the future prevalence rates of disability in the Chinese older population. The data come from the longitudinal information in the CHARLS 2011 and 2013.
1. The Markov model started with the Chinese population aged 60 years and over in 2015. Every person in the population aged each year and made transitions in their disability status until they reached mortality. The sample was refreshed each year with younger adults who reached 60 years old.
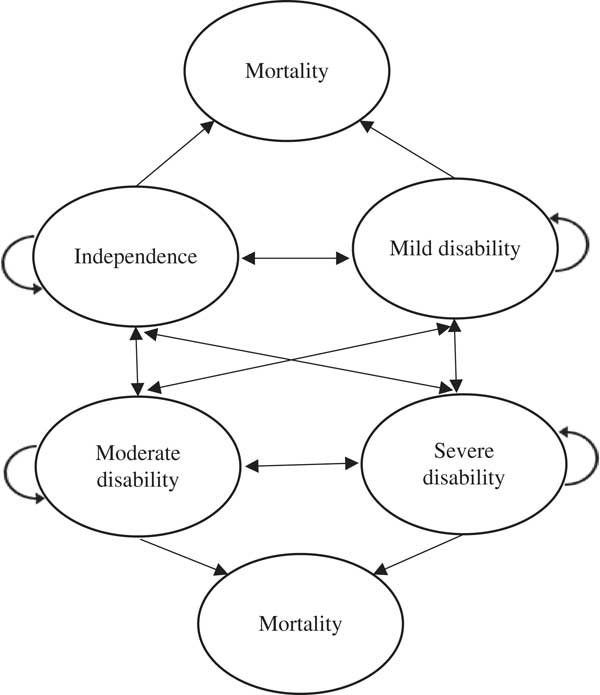
2. A person with a certain disability status in the current year can transition to any other disability status (including mortality) in the next year (Figure 2). To keep in alignment with the structure of the macrosimulation model, the probability of transition is a function of age, gender, rural–urban residence and disability status in the current year. The transition matrices were assumed to be the same in the projection years in the base case (i.e. the homogeneous Markov chain assumption), but were allowed to vary in the sensitivity analysis.
3. The transition probabilities were estimated using the Bayesian approach. Observations on disability transitions have a generalised Bernoulli distribution, and the conjugate prior is the Dirichlet distribution (see Supplementary Appendix A).
4. The prevalence rates of disability conditional on age, gender, severity of disability and rural–urban residence in the projection years were calculated by aggregating the individuals in the relevant categories.
Pathways of disability transitions in the Markov model

The modelling of the future patterns of the educational qualifications in the population followed the same procedures. Again, the transition probabilities were estimated using the Bayesian approach. The projected prevalence rates of disability and patterns of educational qualifications in the future were then fed into the macrosimulation model. The two models were run together with 5000 repetitions, which generated the posterior distributions of disability prevalence rates and the number of people receiving informal care. We report both the mean values and the 95% Bayesian credible intervals (CI) in this paper.
4.6 Sensitivity analysis
We conducted sensitivity analyses to investigate the extent to which our results were sensitive to alternative modelling assumptions, potential demographic changes and proposed policy reforms. We focused on three groups of sensitivity analysis: varied disability transition probabilities, changing household compositions and an increase in formal care services. First, the United Nations (2016) population forecast shows that the mortality rates of the Chinese older population aged 60 years and over will decrease by 11.5% (not percentage points) by 2035. Corresponding to the ongoing debate on morbidity expansion (Gruenberg, Reference Gruenberg1977; Kramer, Reference Kramer1980), morbidity compression (Fries, Reference Fries1980, Reference Fries1983) and dynamic equilibrium (Manton, Reference Manton1982), we tested three scenarios with varied future disability transition probabilities. In the morbidity expansion scenario, the fatality of morbidities is mitigated by technological advancement, so older people live the additional years of their life with a severe disability. In the morbidity compression scenario, healthier lifestyles and effective morbidity prevention programmes delay the onset of disability and slow down its progression, so the period of time spent with a disability is shortened before mortality. In the dynamic equilibrium scenario, older people spend more of the rest of their life with a mild or moderate disability and less with a severe disability.
Second, Zeng et al. (Reference Zeng, Chen, Wang and Land2015) projected that the proportion of disabled older people who are single and live alone in China will increase by 7.8% (not percentage points) and the proportion of disabled older people who are married will increase by 4.2% (not percentage points) between 2015 and 2035. We allowed the parameters in our model relating to living arrangements and marital status to change in alignment with their projected results. We distinguished between two scenarios. Scenario one investigated the impact of an increasing proportion of single people living alone, whereas scenario two looked at the combined effects of an increase in both the proportion of single people living alone and the proportion of married people.
Finally, we used the sensitivity analyses to quantify the extent to which formal social care services can alleviate the pressure of demand for informal care. We tested both the ‘9073’ policy and the ‘9064’ policy discussed above. By 2035, 90% of the older population will either receive only informal care or not receive any care. The other 10%, with various levels of disability, will either receive community-based formal care or live-in care homes. In each policy scenario, for those who receive community-based care, we further distinguished between two hypothetical scenarios. We first looked at the scenario where there is a perfect substitution effect between formal and informal care for every disabled older person. This means that those who receive formal care will no longer demand informal care (the low demand scenario). Such a scenario may be over-optimistic. People with more severe disabilities need longer hours of care (columns 3 and 4, Table 2). Hence, formal care alone may not be sufficient, and informal and professional carers may have to join forces to fully meet older people’s care needs. Following this logic, we also looked at a scenario where the likelihood of perfect substitution between formal and informal care for people with a mild, moderate or severe disability is 100, 50 and 30%, respectively (the high demand scenario).
5 Results
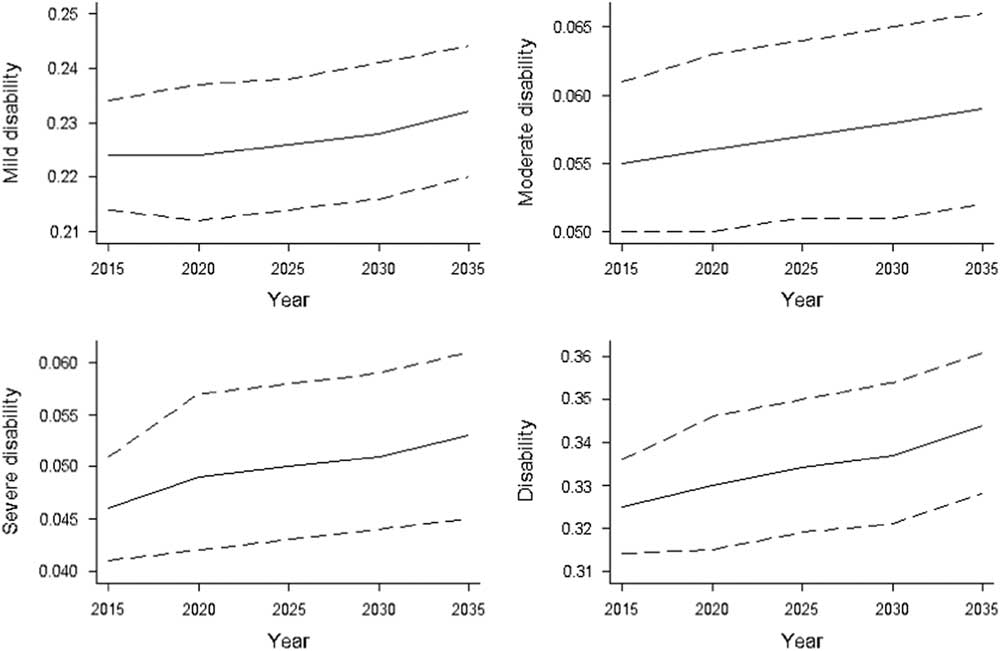
Figure 3 shows the projected prevalence rates of mild, moderate and severe disability in the Chinese older population in the base case. We project that in total the prevalence rate of disability in the Chinese population will increase from 32.5% (95% CI: 31.4–33.6%) in 2015 to 34.4% (95% CI: 32.8–36.1%) in 2035 (lower right panel). We project that the prevalence rate of mild disability will rise by 3.6%, from 22.4% (95% CI: 21.4%–23.4%) to 23.2% (95% CI: 22.0%–24.4%) of the older population. In comparison, the proportions of more disabled older people are projected to rise slightly faster. The prevalence rate of moderate disability will rise by 7.2%, from 5.5% (95% CI: 5.0–6.1%) to 5.9% (95% CI: 5.2–6.6%) of the older population. The prevalence rate of severe disability will rise by 15.2%, from 4.6% (95% CI: 4.1–5.1%) to 5.3% (95% CI: 4.5–6.1%) of the older population.
Projected prevalence rates of different levels of disability in the Chinese older population 2015–35, base case, central estimates and 95% Bayesian credible intervals. Notes: The solid line in each graph is the mean value (central estimate); the dashed lines below and above the solid line are the 2.5th and the 97.5th percentiles, respectively.

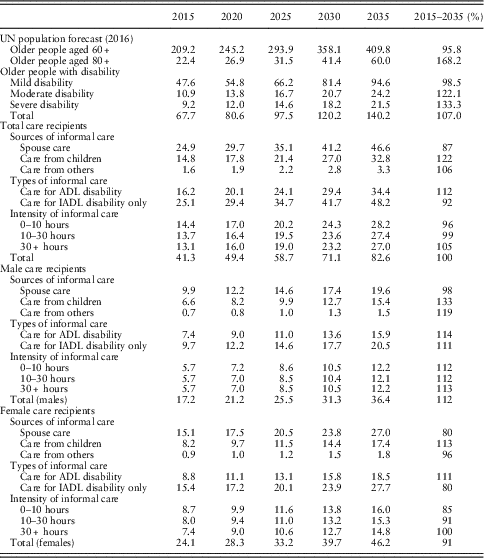
Table 3 shows the projected numbers of Chinese older people receiving informal care in the following two decades in the base case. We project that the number of older people with disability will increase by 107%, from 67.7 million (95% CI: 65.4–70.0) in 2015 to 140.2 million (95% CI: 133.5–147.1) in 2035. We project that the number of older people who need to receive informal care will increase by 100%, from 41.3 million (95% CI: 39.9–42.7) in 2015 to 82.6 million in 2035 (95% CI: 78.3–86.9), to keep pace with the demographic pressure and changes in the prevalence rates of disability.
Projected numbers of older people receiving informal care in China according to sources, types and intensity of care, 2015–35 (base case, central estimates, in million persons)

Note: Figures may not add exactly due to rounding.
ADL=activities of daily living; IADL=instrumental activities of daily living.
If the age-specific prevalence rates of disability are held constant, the demand for informal care is projected to rise by 46.4 million people by 2035. The increase in the prevalence rates of disability will further increase the demand by 1.1 million people. Our Markov model projects that the proportion of disabled older people in China who are illiterate or did not finish primary education will decrease from 66.3% in 2015 to 35.0% in 2035. Since older people with more years of education are less likely to receive informal care (column 3, Table 2), a better educated older population by 2035 will reduce the demand for informal care by 6.2 million people. The combined effect of these factors is an increase of 41.3 million people in informal care demand.
We estimate that 24.9 million people receive spouse care at present. That figure is projected to rise to 46.6 million by 2035, an increase of 87%. We project that the number of people who need to receive care from children will rise by 122%, from 14.8 million to 32.8 million between 2015 and 2035. We project that the number of older people who need to receive informal care for ADL disability and informal care for IADL disability only will rise by 112 and 92%, respectively. We estimate that on average disabled older people receive 37.3 hours of informal care from family members each week at present. We project that the number of older people who need to receive less than 10 hours of care, 10–30 hours of care and more than 30 hours of care will rise by 96, 99 and 105%, respectively.
Table 3 also shows the projected numbers of informal care recipients broken down by gender. Female older people have a much higher demand for informal care. Among the 41.3 million informal care recipients in 2015, 24.1 million are female older people and 17.2 million are male older people. However, it is projected that the increase in demand will be slower among females than among males. The number of female informal care recipients is projected to rise to 46.2 million in 2035, an increase of 91%. In comparison, the number of male informal care recipients is projected to rise to 36.4 million, an increase of 112%. Such a gender difference can be observed for every sub-group of informal care recipients.
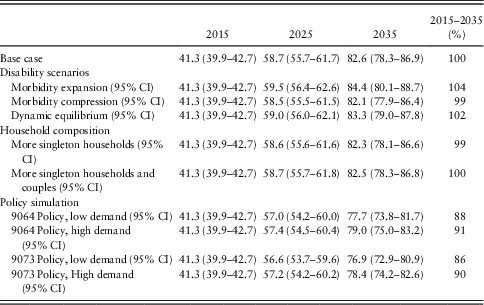
Table 4 shows the results of the sensitivity analyses. In the morbidity expansion scenario, we project that the number of older people who need to receive informal care will rise from 41.3 million (95% CI: 39.9–42.7) in 2015 to 84.4 million (95% CI: 80.1–88.7) in 2035, as opposed to 82.6 million (95% CI: 78.3–86.9) in the base case. It is projected that the number of people who need to receive informal care will rise to 82.1 million (95% CI: 77.9–86.4) in the morbidity compression scenario and 83.3 million (95% CI: 79.0–87.8) in the dynamic equilibrium scenario.
Projected numbers of older people receiving informal care, 2015–35 (sensitivity analysis, central estimates and 95% Bayesian credible intervals (CI), in million persons)

Note: Figures may not add exactly due to rounding.
When we allow the patterns of living arrangements and marital status to change in the sensitivity analyses, the projected numbers of care recipients are no longer equivalent to the demand for informal care, but are constrained by the availability of informal carers. By comparing these results with those in the base case, we are able to evaluate the magnitude of unmet needs in the older population. In our model, if the proportion of disabled older people who are single and live alone rises by 7.8%, it is projected that the number of older people receiving informal care will rise from 41.3 million in 2015 to 82.3 million (95% CI: 78.1–86.6) in 2035, as opposed to 82.6 million in the base case. To put it another way, the demand for informal care will be 82.6 million people in 2035, but only 82.3 million people will receive it. This creates a care gap of 0.3 million people. If the 7.8% rise in the proportion of single people living alone is accompanied by the 4.2% rise in the proportion of married older people, we project that the number of older people receiving informal care will rise to 82.5 million (95% CI: 78.3–86.8) in 2035, which creates a care gap of 0.1 million people.
If the ‘9064’ policy is fully implemented across the country and there is perfect substitution between formal and informal care, the number of informal care recipients will need to rise to only 77.7 million (95% CI: 73.8–81.7) in 2035, as opposed to 82.6 million in the base case. If the likelihood of perfect substitution decreases for more severely disabled older people, it is projected that 79.0 million (95% CI: 75.0–83.2) disabled older people will need to receive informal care. The implementation of the ‘9073’ policy will reduce the demand for informal care even further. We project that the numbers of disabled older people who need to receive informal care in 2035 in the low- and high-demand scenarios will be 76.9 million (95% CI: 72.9–80.9) and 78.4 million (95% CI: 74.2–82.6), respectively.
6 Discussion and conclusion
Like many other countries in the world, the Chinese population is ageing fast. Against this backdrop, it is crucial to understand the magnitude of the care resources needed to meet older people’s demand in the future so that actions can be taken promptly to address the upcoming challenges. This paper combines the macrosimulation approach and the Markov approach to make projections regarding the demand for informal care in the Chinese older population.
Age, disability and level of education have been found to be the most important drivers of demand for informal care. Driven by these factors, the demand for informal care will double by 2035 in China. The magnitude of increase in the demand for informal care is enormous in the case of China. This not only reflects the rapid ageing of the Chinese population but also is attributed to the fact that the long-term care system in this country is heavily reliant on informal care.
Demand pressure will be unevenly distributed within the long-term care system. First, Chinese society will face higher demand pressure from three particular groups of older people: recipients of informal care from children, recipients of care for an ADL disability and recipients of care for more than 30 hours each week. This is attributed to a faster increase in the proportion of the ‘oldest old’ population and the prevalence rates of more severe disability. Second, the demand for informal care among female older people is much higher than that among male older people and will remain so in the following two decades, but the gap between the two groups will decrease. This is mainly down to the patterns of disability in the Chinese older population. According to our analyses of the CHARLS data, the prevalence rate of disability is higher among female older people than among male older people, but female older people tend to transition to a severe stage of disability more slowly.
Our projection results are sensitive to older people’s disability trajectory in the future. With a reduction of 11.5% in the mortality rate by 2035, the number of people who need to receive informal care will be 1.8 million higher in the morbidity expansion scenario and 0.5 million lower in the morbidity compression scenario than in the base case. These findings highlight the important role of healthy lifestyles and effective morbidity prevention programmes in the younger population in addressing the challenges of population ageing.
Apart from physical disability, dementia is another important driver of demand for informal care among older people. In many developed countries, huge quantities of financial resources are invested in the long-term care system each year to provide care services to people with dementia (McDaid, Reference McDaid2001; Wimo et al., Reference Wimo, Jonsson, Bond, Prince and Winblad2010; Prince et al., Reference Prince, Knapp, Guerchet, Mccrone, Prina, Herrera, Wittenberg, Adelaja, Hu, King, Reholl and Salimkumar2014). We were not able to touch upon this issue in the study due to the lack of evidence in the CHARLS data set, but we acknowledge that as the population ageing continues to accelerate it is important to conduct detailed analyses in future research to understand better the cost implications of dementia care in the Chinese context.
Rapid economic development, modernisation and changes in social structure have led to an increase in the proportion of nuclear families and singleton households in China in the previous decades (Cheung and Kwan, Reference Cheung and Kwan2009; Wang, Reference Wang2014). There is considerable concern that a continued decrease in co-residence rates in China will translate into reduced availability of resources in the long-term care system and increased unmet needs among disabled older people (Silverstein et al., Reference Silverstein, Cong and Li2006; Grujiters, Reference Grujiters2017). However, our sensitivity analyses show that future demand for informal care is not highly sensitive to an increase in the proportion of older people living alone. At present, only 10% of the older people in China are single and live alone (column 2, Table 2). This figure is much lower than that in developed countries such as the United States and the United Kingdom, where the proportion of single older people living alone is 28% (US Department of Health and Human Services, 2014) and 31% (Office for National Statistics UK, 2013), respectively. Therefore, a 7% increase in this proportion in China will not create a huge care gap. Moreover, as the proportion of married older people in China rises in the future, more spouse carers will be available to provide care. The projections show that the impacts of these two future trends will roughly offset each other. Our argument is that it is not a reduction in co-residence rates but a continuous rise in the dependency ratio that will potentially lead to a crisis in unmet long-term care needs in the older population (see below).
The Chinese government plans to provide formal community-based care to 6–7% of the older population. Our projections show that such a plan, once fully implemented, will substantially relieve the pressure on demand for informal care. However, such a conclusion relies upon the condition that formal care services are provided to older people who need them. So far, China has not been able to set out the national eligibility criteria within its long-term care system to define the target group of formal care services (Wong and Leung, Reference Wong and Leung2012; Lou and Ci, Reference Lou and Ci2014). As long as this remains the case, formal care services will continue to be used by those people who can afford them rather than those who need them, and will not be particularly effective in alleviating the demand pressure on informal care. Therefore, the Chinese government may want to establish a need-based assessment system as soon as possible, where eligibility in regard to receiving formal care is first and foremost linked with the severity of older people’s disability.
Meanwhile, we argue that more support should be provided to child carers to maintain their caring capacity. First, our projections show that child carers will face higher demand for informal care in the future. Second, due to the implementation of the one child policy, the fertility rate in China has decreased considerably in the past three decades (Du and Yang, Reference Du and Yang2014). As the parents of the one-child cohort reach old age and have a longer life expectancy, the dependency ratio is bound to rise. According to the UN (2016) population forecast, the number of younger adults aged between 20 and 59 years old in China will decrease from 854 million to 737 million in the following two decades, which stands in stark contrast to the fast increase in the number of older people. Compared with a reduction in co-residence rates, a decline in the number of younger informal care providers poses a much more serious challenge to the long-term care system. Two consequences are likely to ensue: (1) some older people may have unmet needs due to the unavailability of child carers, and (2) each child carer may need to provide longer hours of care to their parents. Finally, most of the child carers are working age adults, and thus may have occupational responsibilities to fulfil (Houtven et al., Reference Houtven, Coe and Skira2013). For these reasons, those adult children who need to care for their severely disabled parents will face a higher risk of being overstretched by their caring responsibilities. The caring capacity of child carers will not be sustainable without additional support from the government.
A similar point can be made about spouse carers. Spouse carers themselves often have disability and care needs (Bruce et al., Reference Bruce, Paley, Nichols, Roberts, Underwood and Schaper2005; Kenny et al., Reference Kenny, King and Hall2014). Without help from other carers, their caring responsibilities are likely to have a detrimental effect on their health and reduce their caring capacity. The implication is that the eligibility to receive formal care should also account for the profiles of informal carers. Special attention should be paid to the number of informal carers to whom older people have access. For the Chinese government, lessons from other countries should be learnt, and continued policy reforms and innovations will be needed on the road towards a sustainable long-term care system.
Acknowledgements
The author thanks the two anonymous reviewers for the insightful and constructive comments and suggestions.
Supplementary material
To view supplementary material for this article, please visit https://doi.org/10.1017/S1744133118000221