Implications
Changing the fatty acid profile of beef to obtain a lower proportion of harmful fatty acids is an important way to produce a healthier beef for the consumer and may serve as a tool for beef promotion by the beef cattle industry. However, the best sources for this manipulation are still not well specified, and their impact on beef quality traits needs to be studied. This experiment demonstrates that the addition of cottonseed in the feedlot cattle diets increased the harmful fatty acid content of the beef, compared with the use of soybean grain, and that vitamin E supplementation did not increase beef quality.
Introduction
The addition of lipid sources, rich in polyunsaturated fatty acids (PUFA), in finishing diets of cattle may improve fatty acid profile in beef, increasing the concentrations of CLA and unsaturated fatty acids (UFA) (Oliveira et al., Reference Oliveira, Ladeira, Chizzotti, Machado Neto, Ramos, Goncalves, Bassi, Lanna and Ribeiro2011; Shingfield et al., Reference Shingfield, Bonnet and Scollan2013). In Brazil, cottonseed and soybean grains are widely available owing to large-scale production (Bergmann et al., Reference Bergmann, Tupinambá, Costa, Almeida, Barreto and Quirino2013) and can be used as a source of UFA, such as oleic and linoleic acids. However, sterculic acid present in cottonseed may decrease the activity of the Δ9-desaturase enzyme, resulting in less oleic acid and CLA content in the tissue (Gomez et al., Reference Gomez, Bauman, Ntambi and Fox2003). Furthermore, greater UFA content in meat can reduce its shelf life by increasing susceptibility to lipid peroxidation (Calkins and Hodgen, Reference Calkins and Hodgen2007) and can accelerate myoglobin oxidation (Zakrys et al., Reference Zakrys, Hogan, O’Sullivan, Allen and Kerry2008) impairing the beef color.
In recent years, supplemental vitamin E in the diet of ruminants has been studied for its potential role in preventing lipid peroxidation and increasing meat shelf life (Bloomberg et al., Reference Bloomberg, Hilton, Hanger, Richards, Morgan and Van Overbeke2011). However, no studies have assessed the effect of supplemental vitamin E in conjunction with ground soybeans and ground cottonseed in the diet. Moreover, according to Juarez et al. (Reference Juarez, Dugan, Aldai, Aalhus, Basarab and Baron2010), vitamin E can influence the routes of PUFA ruminal biohydrogenation, increasing the concentrations of n-3 fatty acids. Therefore, the objective of this study was to evaluate the fatty acid profile and qualitative characteristics of meat from young bulls fed ground soybean or ground cottonseed, with or without vitamin E supplementation.
Material and methods
The animal care and handling were approved by the Federal University of Lavras Animal Care and Use Committee before the research was initiated. The experiment was conducted at the Department of Animal Science of the Federal University of Lavras from June to September 2009.
Animals and diet
A total of 40 Red Norte young bulls, with an initial average age of 20 months, and an initial average BW of 339±15 kg, were allotted in a completely randomized design using a 2×2 factorial arrangement, with 10 replicates per treatment. The animals were housed in group pens with 10 animals, according to the diets, with 30 m2/animal, and each animal was the experimental unit. Before the experiment, the animals were weighed and treated for internal and external parasites (Ivomec, Paulinia, Brazil). The experiment lasted for 84 days, preceded by a 28-day period of adaptation to the diets and facilities. The animals were weighed at the beginning and end of the experiment, after a 16-h fasting period.
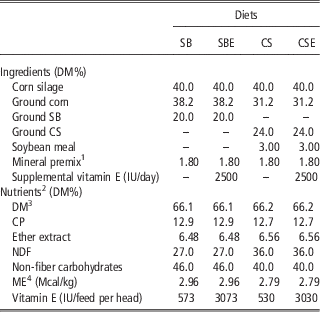
Diets were formulated to be isonitrogenous, according to the NRC (2000), and were provided to the animals ad libitum at 0730 and 1530 h. Corn silage was used as roughage, and two types of concentrates, one containing ground soybean and the other ground cottonseed, were used as lipid sources (Table 1). The oilseeds were ground and passed through a 5-mm mesh to increase ruminal availability of the lipids. Half of the animals that received each concentrate (cottonseed or soybean) were supplemented with 2500 IU of vitamin E/day per head (rac-α-tocopheryl acetate, synthetic form of vitamin E, Microvit-E Promix 50 from M.Cassab®, São Paulo, Brazil, min 50% conforms v. USP reference standard, according to the certificate of analysis) during the experimental period. The vitamin was incorporated to concentrates one day before fed animals and vitamin E content in the diets was calculated from literature data of tocopherol content in oilseeds (Elisia et al., Reference Elisia, Young, Yuan and Kitts2013). The mixture of corn silage with the concentrates occurred a few minutes before feeding the animals. Therefore, the following treatments were assessed: SB, diet containing ground soybean without supplemental vitamin E; SBE, diet containing ground soybean with supplemental vitamin E; CS, diet containing ground cottonseed without supplemental vitamin E and CSE, diet containing ground cottonseed with supplemental vitamin E.
Composition of the experimental diets: soybean (SB), soybean+vitamin E (SBE), cottonseed (CS) and cottonseed+vitamin E (CSE)

DM=dry matter.
1 Guaranteed content per kilogram of product is as follows: Ca, 170 g; Co, 15 mg; Cu, 396 mg; P, 31 g; I, 29 mg; Mg, 15 g; Mn, 515 mg; Se, 5.4 mg; Na, 155 g; Zn, 2000 mg.
2 Nutritional compositions obtained from laboratory analysis.
3 As-fed.
4 Metabolizable energy: calculated according to the NRC (2001).
Samples of concentrate feedstuffs and corn silage were collected every 14 days. Analyses of dry matter (DM), CP and ether extract (EE) were conducted at the Animal Research Laboratory of the Animal Science Department of UFLA, according to AOAC (Helrich, Reference Helrich1990). The NDF was analyzed according to Van Soest et al. (Reference Van Soest, Robertson and Lewis1991). Non-fiber carbohydrates (NFC) and metabolizable energy were calculated using equations proposed by NRC (2001).
The animals were slaughtered at an average weight of 456±15.1 kg (P>0.05) by captive bolt and exsanguination, followed by hide removal and evisceration, without electrical stimulus. The carcasses were identified, washed and divided into halves, which were individually weighed and then refrigerated at 1°C for 24 h. A portable pH meter (Testo-205; Testo, Campinas, Brazil) was used to measure the pH from the longissimus dorsi (LD) of the half-carcasses between the 11th and 12th ribs, immediately after slaughter and again 24 h later.
Tissue collection and meat analysis
At 24 h postmortem, six samples of the LD muscle from each animal, ~200 g, and 2.54 cm thick, were collected from the left half-carcass from the muscle section at the 13th rib in the direction of the head, for chemical composition, fatty acid profile and physical–chemical analysis. Samples for chemical composition and physical–chemical analysis were stored at −20°C, and samples for fatty acid, carotene, lutein, tocopherol and retinol analysis were stored at −80°C. For determination of the chemical composition, one meat sample was homogenized in a multiprocessor to obtain a homogeneous mass. CP was quantified by the Kjeldahl method, EE was determined by the Soxhlet method, moisture content was measured by mass loss in a 105°C oven for 24 h and ash was quantified after 550°C for 4 h.
Fatty acid extraction and gas chromatography analysis
Lipids were extracted from one meat sample after dissected muscle and subcutaneous fat from LD following the method described by Hara and Radin (Reference Hara and Radin1978) and were methylated according to the procedure described by Christie (Reference Christie1982). The transmethylated samples were analyzed using a gas chromatograph (model Focus GC-Finnigan; Thermo Finnigan, San Jose, CA, USA) with a flame-ionization detector and the following capillary column dimensions: 100 m×0.25 mm×0.20 µm (CP-Sil 88; Varian, Palo Alto, CA, USA). Hydrogen was used as the carrier gas at a flow rate of 1.8 ml/min. The initial temperature of the oven was 70°C, maintained for 4 min. It was then increased by 13°C/min to 175°C, where it was maintained for 27 min. The temperature was then increased by 4°C/min to 215°C, where it was maintained for 9 min, followed by another increase of 7°C/min to 230°C, where it was maintained for 5 min. The total duration of the process was 65 min. The temperature of the injector was 250°C, and the temperature of the detector was 300°C.
Main fatty acids were identified by comparison of the retention times of methyl esters in the samples with standards of fatty acids from butter. Fatty acids were quantified by normalizing the areas of methyl esters. Fatty acid results were expressed as percentage of the area (%) obtained using Chromquest 4.1 software (Thermo Electron, Milan, Italy). The Δ9 desaturase and elongase enzymatic activities were determined as described by Malau-Aduli et al. (Reference Malau-Aduli, Siebert, Bottema and Pitchford1997), using mathematical indices. The atherogenicity index was calculated according to Ulbricht and Southgate (Reference Ulbricht and Southgate1991) as an indicator for risk of cardiovascular disease. Calculations were performed as follows:
 $$\eqalign{\Delta ^{{\rm 9}} {\minus}{\rm desaturase \ C16 \ activity}= {\rm 1}00{\rm } [{( {{\rm C16}\!:\!\!{\rm 1}\ cis\hbox-{\rm 9} ) /}} \cr \left( {{\rm C16}\!:\!{\rm 1}\ cis\hbox-{\rm 9}{\plus}{\rm C16}\!:\!0} )} ]$$
 $$\eqalign{ \hskip-1.5pc \Delta ^{{\rm 9}} {\minus}{\rm desaturase\ C18\ activity}= \cr {\rm 1}00{\rm }[ {( {{\rm C18}\!:\!{\rm 1}\ cis\hbox-{\rm 9}} )/( {{\rm C18}\!:\!{\rm 1}\ cis\hbox-{\rm 9}{\plus}{\rm C18}\!:\!0} \right)} \right]$$
 $$\eqalign{ \hskip-3pc {\rm Elongase \ activity}={\rm 1}00{\rm } [{( {{\rm C18}\!:\!0{\plus}{\rm C18}\!:\! {\rm 1}\ cis\hbox-{\rm 9}} \right)}/ \cr ( {{\rm C16}\!:\!0{\plus}{\rm C16}\!:\!{\rm 1}\ cis\hbox-{\rm 9}{\plus}{\rm C18}\!:\!0{\plus}{\rm C18}\!:\!{\rm 1} \ cis\hbox-{\rm 9}} )} \right]$$
 $$\eqalign{{\rm Atherogenicity\ index}=[ {{\rm C12}\!:\!0{\plus}{\rm 4}( {{\rm C14}\!:\!0} )} \cr {\plus}{\rm C16}\!:\!0/\Sigma{\rm UFA}$$
Vitamins analysis
Vitamins were extracted from lyophilized samples of LD muscle, after trimming the subcutaneous fat. A portion of the sample used for fatty acid analysis was used. Meat samples were rehydrated with phosphate buffer (0.05 M; pH 7.7) and 3 ml aliquots were treated with saturated ethanolic KOH for a saponification step and then extracted twice with n-hexane. The organic phase was evaporated under nitrogen flow, dissolved in absolute ethanol (J.T. Baker, Xalostoc, Mexico, HPLC grade) and filtered through a 0.45 μm pore nylon membrane before injection. All samples were analyzed by reverse phase HPLC.
The HPLC system (Thermo Separation Products Inc., San Jose, CA, USA) was equipped with a quaternary pump (model P4000, Thermo Fisher Scientific, Waltham, MA, USA) with a membrane vacuum degasser and an auto sampler (AS4000, Thermo Fisher Scientific) with a 100 μl loop injector and connected to an Alltima C18 column (250×4.6 mm; Alltech, Deerfield, IL, USA), 5 μm particle size. The diode array detector (UV600LP Spectrasystem, Thermo Fisher Scientific) was used with two simultaneous channels set at 325 and 445 nm for retinol and carotenoids detection, respectively. The fluorescence detector was set at 293 to 330 nm for excitation and emission, respectively, and was used for tocopherols determination. The mobile phase consisted in an isocratic mixture of ethanol in methanol (60 : 40) at 1 ml/min. Recovery of retinol, carotenoids and tocopherols was 98%, 97% and 99%, respectively. Calibration curves were performed with all-trans-retinol, lutein, β-carotene γ- and α-tocopherol standards (Sigma-Aldrich Corporation, St. Louis, MO, USA) freshly prepared in absolute ethanol (adapted from Insani et al., Reference Insani, Eyherabide, Grigioni, Sancho, Pensel and Descalzo2008). The chromatographic system permitted, in meat extracts, the detection and quantification of α and γ tocopherol by fluorescence, lutein and β-carotene (as major carotenoid forms in LD samples) at 445 nm and retinol at 325 nm, in a simultaneous run.
Meat color
To determine the meat color using the L*, a* and b* standard CIE reference system, four non-frozen meat samples were used from the LD. The color was measured using the Minolta CR-400 colourimeter (Konica Minolta, Osaka, Japan) at four aging times (0, 7, 14 and 21 days) at 2ºC, in anaerobic and darkness conditions. Each sample was sealed using a Selovac CV8 (São Paulo, Brazil) gas/vacuum packaging machine with −700 mm Hg. Altogether, six scans were performed per slice, and the average of the measurements was used for statistical analysis. Color components (L*, a* and b*) were measured after removing the packaging and exposing the sample to air for 30 min (Abularach et al., Reference Abularach, Rocha and Felicio1998), allowing for myoglobin oxygenation (blooming). The color was measured on the surface of the steak using the illuminant D65 (Konica Minolta, Osaka, Japan) and at a standard observation angle of 10º. Calibration to a standard white was used, where L* is an index associated with lightness (0=black, 100=white), a* is an index that varies from green (−) to red (+) and b* is an index that varies from blue (−) to yellow (+) (Houben et al., Reference Houben, Van Dijk and Eikelenboom2000). Measurements of the chroma index (C*) were conducted according to MacDougal (Reference MacDougall1994) by applying the following formula equation: C*=((a*)2+(b*)2)0.5
Thiobarbituric acid-reactive substances (TBARS)
To analyze lipid stability, the content of TBARS was determined using the acid precipitation technique described by Tarladgis et al. (Reference Tarladgis, Watts and Younathan1960), with minor modifications. We used 50 g of LD from each of the three aging times: 0, 21 and 42 days at 2ºC (after meat color reading). A 10-g sample was ground in a multiprocessor and 0.2 ml of antioxidant BHT (0.03%) was added along with 50 ml of distilled water. After additional homogenization for 1 min, the samples were transferred to 250 ml flasks containing pieces of porcelain, and 50 ml of 4 M HCl was added. Subsequently, the samples were distilled in a heating mantle apparatus at 100°C, until 50 ml of distillate was collected. The distillate was transferred to test tubes in 5 ml aliquots and 5 ml of 0.02 mol/l thiobarbituric acid was added to each tube. The test tubes remained in a boiling water bath for 35 min and were then quenched under running water. Finally, a spectrophotometer was used to access the absorbance at 530 nm. The TBARS value, expressed in mg of malonaldehyde per kg of meat, was obtained by multiplying the absorbance by 7.8 (Tarladgis et al.,Reference Tarladgis, Watts and Younathan1960).
Statistical analysis
The muscle chemical composition, fatty acid profile and enzyme activity indices were analyzed using the GLM procedure of the SAS 9.1 statistical software (SAS Inst. Inc., Cary, NC, USA), considering a completely randomized design using a factorial arrangement of 2×2, with the effects of oilseeds, vitamin E supplementation and their interaction. When the overall F-value was significant at 5% probability, a Tukey’s test was applied to compare the means. Color and lipid oxidation were analyzed using the MIXED procedure of SAS 9.1, as suggested by Littell et al. (Reference Littell, Henry and Ammerman1998). The model included lipid source, vitamin E and days, along with their interaction, as fixed effects. Analysis was conducted using days as a repeated measure in time.
Results and discussion
Performance and chemical composition of meat
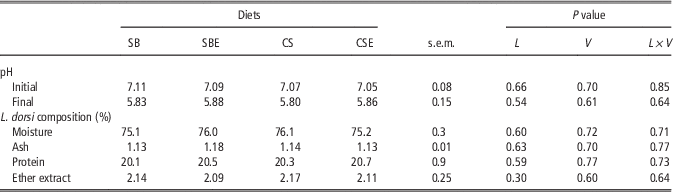
No effect of lipid sources or vitamin E supplementation was verified (P>0.05) on final BW and average daily weight gain of animals (Table 2). This result was expected because the diets had similar nutritional value. Neither the lipid source nor vitamin E supplementation, nor the interaction between them, affected the initial and final pH of the carcass (Table 3). As the diets used in this experiment exhibited similar NFC levels and because the daily DM intake was similar between animals fed different diets, it can be inferred that the muscle glycogen level was similar at slaughter, which resulted in appropriate final pH. Like carcass pH, the oilseeds and vitamin E did not affect the chemical composition of the LD muscle, which can be explained by the similar weight gain and slaughter weight. The main factors that influence the chemical composition are: sex (Arthaud et al., Reference Arthaud, Mandigo, Koch and Kotula1977), aging (Dikeman et al., Reference Dikeman, Obuz, Gök, Akkaya and Stroda2013), breed (De Smet et al., Reference De Smet, Raes and Demeyer2004), growth rate (Chambaz et al., Reference Chambaz, Scheeder, Kreuzer and Dufey2003) and energy intake (Arthaud et al., Reference Arthaud, Mandigo, Koch and Kotula1977), and most of them were similar in this study.
Effects of oilseeds and vitamin E supplementation on initial and final BW and average daily gain of young bulls

SB=soybean; SBE=soybean+vitamin E; CS=cottonseed; CSE=cottonseed+vitamin E; L=effect of the lipid source; V=effect of vitamin E supplement; L×V=interaction between lipid source and vitamin E.
1 Data were not statistically analyzed because the animals were housed in group, for each treatment.
Effects of oilseeds and vitamin E supplementation on initial and final pH of the carcass and chemical composition of the longissimus dorsi of young bulls

SB=soybean; SBE=soybean+vitamin E; CS=cottonseed; CSE=cottonseed+vitamin E; L=effect of the lipid source; V=effect of vitamin E supplement; L×V=interaction between lipid source and vitamin E.
Fatty acid profile
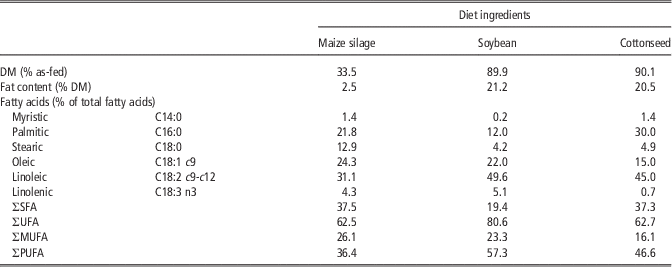
For a better understanding of the effect of diet on the qualitative characteristics of meat, we determined the fatty acid profile of the roughage and oilseeds utilized (Table 4). Soybean has greater concentration of oleic and linoleic acids compared with cottonseed. On the other hand, cottonseed has greater myristic, palmitic, stearic and total saturated fatty acids (SFA) contents.
Dry matter (DM), fat content and concentrations of main fatty acids from silage and lipid sources used in the diets

SFA=saturated fatty acids; UFA=unsaturated fatty acids; MUFA=monounsaturated fatty acids; PUFA=polyunsaturated fatty acids.
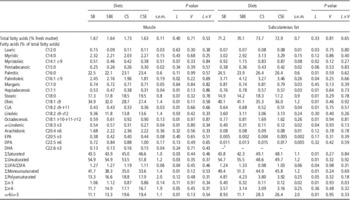
Supplemental vitamin E and its interaction with lipid sources had no effect (P>0.11) on fatty acid concentration in the LD muscle or in subcutaneous fat (Table 5). In contrast, Juarez et al. (Reference Juarez, Dugan, Aalhus, Aldai, Basarab, Baron and McAllister2011), evaluating the effect of flaxseed and vitamin E on beef steers, found greater α-linolenic acid contents when the vitamin was supplemented. The authors suggested that vitamin E acting as an electron acceptor in the rumen, which could mitigate biohydrogenation of n-3 fatty acids. The mode of action of vitamin E has not been clarified yet. Martin and Jenkins (2002) and Pottier et al. (2006) suggested that vitamin E have inhibitory and stimulatory effects on the growth and function of bacteria that produce C18:1 t-10 and t-11, respectively.
Effects of oilseeds and vitamin E supplementation on percentage of main fatty acids in muscle and subcutaneous fat of longissimus dorsi from young bulls

SB=soybean; SBE=soybean+vitamin E; CS=cottonseed; CSE=cottonseed+vitamin E; L=effect of the lipid source; V=effect of vitamin E supplement; L×V=interaction between lipid source and vitamin E; SFA=saturated fatty acids; UFA=unsaturated fatty acids.
n-3 fatty acids: α-linolenic acid, EPA, DHA. n-6 fatty acids: arachidonic acid, DPA, linoleic acid.
1 Trace.
Subcutaneous fat from animals fed ground cottonseed had greater lauric and palmitic acid contents, which can be explained, for the last one, by the high concentration of palmitic acid in this oilseed. According to Grundy et al. (Reference Grundy, Florentin and Nix1988), there is evidence that the intake of lauric, myristic and palmitic acid may increase blood cholesterol levels in human beings, predominantly by increasing low-density lipoprotein (LDL) concentrations. According to Woollett et al. (Reference Woollett, Spady and Dietschy1992), these fatty acids are considered hypercholesterolemic because they interfere with the normal function of hepatic LDL receptors. Nicolosi (Reference Nicolosi1997) and Dorfman and Lichtenstein (Reference Dorfman and Lichtenstein2006) reported that LDL receptors activity is decreased by a reduction in the mRNA abundance. Besides, the decrease in hepatic LDL receptor activity with saturated fat feeding is associated with decreased hepatic sterol acyltransferase activity and, therefore, a reduced inert pool of cholesteryl ester (Nicolosi, Reference Nicolosi1997).
The stearic acid content was greater in the subcutaneous fat and there was a tendency (P=0.07) of increase in muscle from animals fed ground cottonseed, compared with the muscle of animals fed soybean. However, this SFA does not pose a risk to human health because stearic acid consumption is not associated with the increase in blood cholesterol levels (Mensink et al., 2003). Once consumed, in human body, stearic acid might be metabolized into oleic acid by the Δ9-desaturase enzyme. Animals fed ground cottonseed had reduced oleic acid contents in both muscle and subcutaneous fat. This effect is undesirable because oleic acid intake contributes to increase plasma high-density lipoprotein (HDL) and decrease LDL and triglyceride concentrations in human blood (Gilmore et al., Reference Gilmore, Walzem, Crouse, Smith, Adams, Vaidyanathan, Xiaoujuan and Smith2011). Costa et al. (Reference Costa, Roça, Costa, Lanna, Lima and Barros2013) observed a similar result for oleic acid concentration in meat as a function of different cottonseed levels in the diet (0%, 14%, 27% and 34%). In addition, greater NDF content in the cottonseed diets may have contributed to increase retention time of digesta in the rumen, where UFA were exposed to ruminal biohydrogenation for a longer time.
The linolenic acid contents decreased in muscle and subcutaneous fat from animals fed ground cottonseed compared with soybeans, which is explained by its reduced concentration in this feed (Table 4). On the other hand, the linoleic acid content was slightly greater in the muscle of animals fed ground cottonseed. This was not expected, owing to its greater content in soybean and the greater fiber content in these diets. Muscle and subcutaneous fat from animals fed ground cottonseed had greater octadecenoic acid concentrations (C18:1 t-10-11-12). These isomers are largely comprised of vaccenic acid (C18:1 t-11) (Aldai et al., Reference Aldai, Lavín, Kramer, Jaroso and Mantecón2012; He et al., Reference He, McAllister, Kastelic, Mir, Aalhus and Dugan2012), and this fatty acid is the main substrate available for synthesis of CLA (C18:2 c-9, t-11) in adipose tissue and muscle. Despite the greater vaccenic acid content in the tissues, the CLA concentration was lower in animals fed ground cottonseed. The presence of sterculic acid in cottonseed (Vickery, Reference Vickery1980; Gunstone and Harwood, Reference Gunstone and Harwood2007; Yu et al., Reference Yu, Rawat and Shanklin2011); and it negative effect on Δ9-desaturase activity (Ladeira et al., Reference Ladeira, Machado Neto, Chizzotti, Oliveira and Chalfun Júnior2012; Ortinau et al., Reference Ortinau, Nickelson, Stromsdorfer, Naik, Pickering, Haynes, Fritsche and Perfield2013) can explain this result as well.
Addition of cottonseed increased the SFA content in muscle and subcutaneous fat (Table 5), which can be explained by the fact that soybean contains ~20% more UFA than cottonseed. In addition, as mentioned, the presence of Δ9-desaturase enzyme inhibitors in cottonseed reduces the conversion of stearic acid to oleic acid, which also contributes to decreased UFA content in beef. The PUFA concentration in muscle was unaffected by the diets; however, it decreased in subcutaneous fat from animals fed ground cottonseed.
There was no effect of diet on concentrations of EPA, DPA and DHA (P>0.13) in the muscle and subcutaneous fat. However, the n-3 fatty acid content significantly decreased in subcutaneous fat from animals fed ground cottonseed owing to the low α-linolenic acid content in this feed. n-3 fatty acids have important biological functions in human body because they positively affect health by altering membrane protein functions, cell signaling and gene expression profiles (Surette, Reference Surette2013), as well as its anti-inflammatory properties (Ferrucci et al., Reference Ferrucci, Cherubini, Bandinelli, Bartali, Corsi, Lauretani, Martin, Andres-Lacueva, Senin and Guralnik2006). Other metabolic effects of α-linolenic acid were described, such as improved blood pressure (Djousse et al., Reference Djousse, Arnett, Pankow, Hopkins, Province and Ellison2005) and reduced plasma triglycerides concentration (Djousse et al., Reference Djousse, Hunt, Arnett, Province, Eckfeldt and Ellison2003; Vrablik et al., Reference Vrablik, Prusikova, Snejdrlova and Zlatohlavek2009) as well as reduced LDL cholesterol and apolipoprotein B concentrations (Goyens and Mensink, Reference Goyens and Mensink2005). These changes are recognized to have health benefits in humans, especially relating to cardiovascular outcomes. As only 5% of α-linolenic acids in the human body are converted into n-3 fatty acids, dietary sources of these fatty acids are of great importance (Plourde et al., Reference Plourde, Jew, Cunnane and Jones2008). Moreover, animals fed ground cottonseed exhibited greater n-6 fatty acid concentrations in muscle, and n-6/n-3 ratio in both tissues, compared with those fed ground soybean. The relationship between these fatty acids is important because high intake of n-6 fatty acids can inhibit conversion of α-linolenic to EPA (Liou et al., Reference Liou, King, Zibrik and Innis2007). Oliveira et al. (Reference Oliveira, Ladeira, Chizzotti, Machado Neto, Ramos, Goncalves, Bassi, Lanna and Ribeiro2011) also observed a greater n-6/n-3 ratio in the muscle and subcutaneous fat from animals fed cottonseed diets compared with animals fed soybean or linseed diets.
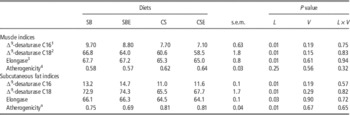
Animals fed ground cottonseed diets exhibited low index activity of Δ9-desaturase C16 and C18 (Table 6), and this result is another indication of the sterculic acid action. The potential of sterculic acid to inhibit Δ9-desaturase activity is well established in the literature (Smith et al., Reference Smith, Knabe and Smith1996; Yang et al., Reference Yang, Larsen and Smith1999) and, according to Gomez et al. (Reference Gomez, Bauman, Ntambi and Fox2003), it directly inhibits Δ9-desaturase activity, possibly by a turnover-dependent reaction, without affecting the processes required for adipocyte differentiation, Δ9-desaturase gene expression or Δ9-desaturase protein translation. Furthermore, the subcutaneous fat from these animals had greater atherogenicity index. It happened because the muscle and subcutaneous fat of animals fed ground cottonseed had lower concentration of fatty acids considered important for the health of beef consumers. Cottonseed is a feed used in large scale in Brazil feedlots, but our results suggest that its use in diets may need to be limited. Gilmore et al. (Reference Gilmore, Walzem, Crouse, Smith, Adams, Vaidyanathan, Xiaoujuan and Smith2011) found that the consumption by men of meat with high monounsaturated fatty acid (MUFA) content increased HDL-cholesterol in the blood, compared with the consumption of meat with low MUFA. In that study, oleic acid content was about 30% greater in meat with high MUFA. In the present study, meat of animals fed soybean had about 20% more oleic acid than meat of animals fed cottonseed.
Effects of oilseeds and vitamin E supplementation on atherogenicity index and indices of enzymes involved in fatty acid metabolism in muscle and subcutaneous fat of longissimus dorsi from young bulls

SB=soybean; SBE=soybean+vitamin E; CS=cottonseed; CSE=cottonseed+vitamin E; L=effect of the lipid source; V=effect of vitamin E supplement; L×V=interaction between lipid source and vitamin E.
1 ∆9-desaturase C16:100 [(C16:1 cis-9)/(C16:1 cis-9+C16:0)].
2 ∆9-desaturase C18:100 [(C18:1 cis-9)/(C18:1 cis-9+C18:0)].
3 Elongase: 100 [(C18:0+C18:1 cis-9)/(C16:0+C16:1 cis-9+C18:0+C18:1 cis-9)].
4 Atherogenicity: [C12:0+4(14:0)+C16:0]/∑UFA).
TBARS, vitamin E and meat color
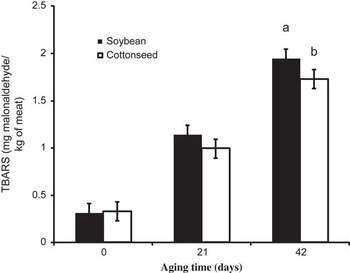
The TBARS concentration was affected by the days of age (P<0.01) and its interaction with lipid source (P<0.05; Figure 1). At 42 days of age, greater lipid peroxidation occurred in meat from animals fed ground soybean, which could be owing to the greater concentrations of UFA in meat from those animals. On the other hand, supplementation with antioxidants, such as vitamin E, can reduce the oxidation in the muscle. However, in this experiment, vitamin E supplementation had no effect on lipid stability in beef (P=0.70). This result can be explained because supplementation of diets with synthetic vitamin E had no significant effect on the incorporation of tocopherols into the muscle (Table 7). Besides, it is possible that the amount of vitamin E in the feed was less than intended because they were calculated and not measured in the ingredients of the diets. According to Eikelenboom (Reference Eikelenboom, Hoving-Bolink and Houben2000), the absence of an effect of vitamin E supplementation on the tocopherol concentration in the meat may be owing to the intake of forage with good nutritional value during the period prior the feedlot, because forage can saturate muscles with α-tocopherol. Furthermore, according to Arnold (Reference Arnold, Arp and Scheller1993), α-tocopherol depletion is slow in the muscle and, therefore, meat from animals slaughtered after feedlot could have high levels of α-tocopherol and other antioxidants obtained from pasture. Similarly, Descalzo et al. (Reference Descalzo, Insani, Biolatto, Sancho, Garcia and Pensel2005) evaluated the effect of the feeding system (pasture or feedlot) and supplemental vitamin E (500 IU/animal per day for 140 days) and found that vitamin supplementation had no effect on TBARS values and only the feeding system affected TBARS. However, Gatellier et al. (Reference Gatellier, Hamelin, Durand and Renerre2001), evaluating the effect of vitamin E (1000 mg/animal per day for 111 days) on lipid stability in beef, found decreased TBARS values owing to vitamin E supplementation.
Malonaldehyde concentration (mg/kg) in longissimus dorsi from young bulls fed soybean and cottonseed, aging under refrigeration (2°C) in anaerobic conditions. Lowercase letters on the same day of aging differ statistically at a probability of 5% by the Tukey’s test.

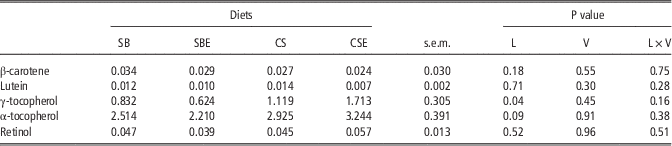
Effects of oilseeds and vitamin E supplementation on carotene, lutein, tocopherol and retinol levels (μ/g fresh meat) in longissimus dorsi from young bulls

SB=soybean; SBE=soybean+vitamin E; CS=cottonseed; CSE=cottonseed+vitamin E; L=effect of the lipid source; V=effect of vitamin E supplement; L×V=interaction between lipid source and vitamin E.
Tocopherol values were greater in meat samples of the animals fed cottonseed than soybean. Therefore, our results suggest that different dietary sources of tocopherols can change its concentration of both, α and γ isomers into LD tissue. The effect of this incorporation could help to explain the oxidative stability of cottonseed meat samples. Besides, it was possible that, in the conditions of the present study, the basal levels of vitamin E in the diets, without vitamin supplementation, were sufficient for its incorporation in LD muscles of the animals. According to Faustman et al. (Reference Faustman, Cassens, Schaefer, Buege, Williams and Scheller1989), muscle tocopherol concentrations >3 µg/g of tissue did not appear to yield any added benefit for reducing lipid oxidation rates in ground sirloin from Holstein steers. The total tocopherol concentration in the muscle of animals fed soybean was 3.09 µg/g of tissue in the present study. In another study with vitamin E, O’Grady et al. (Reference O’Grady, Monahan, Fallon and Allen2001) used 300 IU of α-tocopheryl acetate/kg feed, and found a concentration of 1.35 µg/g of tissue in the muscle of supplemented animals, and 0.37 µg/g in non-supplemented animals, values much lowers than our study. Furthermore, some studies indicate that pre-intestinal vitamin E losses may be as high as 42% in sheep (Alderson et al., Reference Alderson, Mitchell, Little, Warner and Tucker1971) and up to 52% in cattle (Shin and Owens, Reference Shin and Owens1990). There appears to be little evidence that vitamin E is absorbed across the rumen epithelium (Alderson et al., Reference Alderson, Mitchell, Little, Warner and Tucker1971; Hidiroglou and Jenkins, Reference Hidiroglou and Jenkins1974) and rumen microorganisms are implicated as the main cause of vitamin E loss (Chikunya et al., Reference Chikunya, Demirel, Enser, Wood, Wilkinson and Sinclair2004).
There are eight different analogues (α-β-γ and δ-tocopherols and tocotrienols) designated as vitamin E, and α- (most abundant in animal tissues) and γ- (most abundant in plants) tocopherols has been mostly studied (Van Acker et al., Reference Van Acker, Koymans and Bast1993; Jiang et al., Reference Jiang, Christen, Shigenaga and Ames2001). Although they show similar antioxidant activity, their incorporation into tissues and even their biological activity are different. In addition, synthetics forms of vitamin E (rac α-tocopherol esters) have lower activity (at least 30%) than the natural form, which help to explain the lack of effect of vitamin E supplementation on TBARS.
Levels of carotenoids were low, probably owing to the lack of these compounds in soybean and cottonseed (Table 7). Indeed, β-carotene and lutein are preferentially associated with fresh forage feeding (Descalzo et al., Reference Descalzo, Insani, Biolatto, Sancho, Garcia and Pensel2005; Dunne et al., Reference Dunne, Monahan, O’Mara and Moloney2009). Retinol content in meat was also low and showed no differences between feeding treatments.
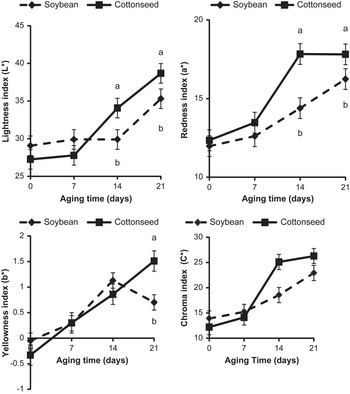
Color data (Figure 2) were analyzed after 30 min of blooming of the vacuum stored meat. It was considered the effects of interaction between lipid sources and aging, because vitamin E supplementation did not affect meat color (P>0.10). Lightness index and red intensity of meat increased as a function of aging, which can be explained by differences in the oxygen consumption rate (OCR) during the blooming. Residual mitochondrial respiration in postmortem muscle is related to the depth of oxygen penetration into exposed muscle surface (McKenna et al., Reference McKenna, Mies, Baird, Pfeiffer, Ellebracht and Savell2005). As meat, muscle continues to respire after slaughter, so molecular oxygen continues to be reduced by NADH at the end of the mitochondrial electron transport chain. This respiratory system competes with myoglobin for the oxygen that diffuses into the meat from the atmosphere (Lanari and Cassens, Reference Lanari and Cassens1991). The net result of the oxygen diffusion and consumption is a steeply decreasing gradient of oxygen concentration from the air to the interior of the meat cut, and oxymyoglobin is formed at shallow depths (MacDougall and Taylor, Reference MacDougall and Taylor1975). However, oxygen consumption decreases with time postmortem (Lanari and Cassens, Reference Lanari and Cassens1991; McKenna et al., Reference McKenna, Mies, Baird, Pfeiffer, Ellebracht and Savell2005; King et al., Reference King, Shackelford, Rodriguez and Wheeler2011). Thus, the balance between metabolic oxygen consumption and oxygen binding by myoglobin changes with time, and the oxymyoglobin layer therefore becomes thicker. King et al. (Reference King, Shackelford, Rodriguez and Wheeler2011) observed that the increase in OCR measured on beefs on day 6 of display was associated with less redness (lower a* value and greater hue angle) and less color intensity (lower chroma values) compared with day 0 of display.
Lightness index (L*), redness index (a*) and yellowness index (b*) of the longissimus dorsi at 0, 7, 14 and 21 days of age from young bulls fed soybean and cottonseed. Lowercase letters on the same day of aging differ statistically at a probability of 5% by the Tukey’s test.

At 14 and 21 days of age, the observed a* values were less in the meat from animals fed ground soybean diets, which may be owing to the chemical state of heme pigments. As the fatty acid profile in the meat from animals fed ground soybean had greater UFA and lower tocopherols content, it was more susceptible to lipid oxidation, as indicated by the TBARS results. Therefore, that lipid oxidation can accelerate myoglobin oxidation (Zakrys et al., Reference Zakrys, Hogan, O’Sullivan, Allen and Kerry2008). At 21 days of age, greater yellow intensity was observed in the meat from animals fed cottonseed, compared with those fed soybean. The chroma index (C*) indicates color purity and was similar to a* values. At 14 days of maturation, meat from animals fed cottonseed diets had a higher C* value, indicating greater color intensity in the meat compared with those of animals fed soybean.
Conclusions
The addition of ground cottonseed in the finishing diets increased the saturated fatty acid content of the LD, compared with ground soybean. However, animals fed cottonseed exhibited greater lightness and redness of beef. In this study, the addition of vitamin E did not increase the concentration of tocopherol and affect qualitative characteristics of meat.
Acknowledgement
This project was funded by Fundação de Amparo a Pesquisa do Estado de Minas Gerais (Belo Horizonte, Minas Gerais, Brazil).