I. INTRODUCTION
Short distance communications encourage the development of optoelectronic components on Silicon. In particular ultra-low-cost silicon based optoelectronics is highly desirable for Radio-over-Fiber applications within buildings and houses [Reference Guillory1]. SiGe phototransistors are potential candidates for light detection that were proposed for the first time in 2003 [Reference Polleux, Moutier, Billabert, Rumelhard, Sönmez and Schumacher2, Reference Polleux, Moutier, Billabert, Rumelhard, Sönmez and Schumacher3] to be integrated in the standard SiGe heterojunction bipolar transistor (HBT) technology. Since then, several laboratories have integrated such devices in various SiGe BiCMOS industrial technological process such as TSMC [Reference Pei4], IBM [Reference Yin5] and AMS [Reference Egels6]. Microwave phototransistors have the advantage to combine a PIN photodiode with an HBT, thus lowering the output impedance and making easier the match to the other components of the electronic circuits. Indeed, it avoids the need of a transimpedance amplifier as previously studied based on InP/InGaAs heterojunction bipolar photo-transistor (HPTs) [Reference Kim, Kanakaraju, Johnson and Lee7, Reference Leven, Houtsma, Kopf, Baeyens and Chen8] and are recently with SiGe HPTs as well [Reference Egels6, Reference Rosales, Polleux and Algani9, Reference Rosales10].
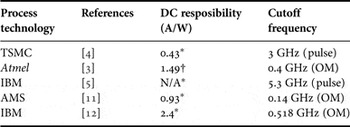
There is a continuous need to verify the ability of the phototransistor integration in newer commercial SiGe technological process offering faster operating frequencies but also to improve the performance of the HPT without modification of the technology vertical stack of layers. Based on different technological approaches, the performances of SiGe HPTs were studied by numerous publications as shown in Table 1. In [Reference Pei4] and [Reference Yin5], the HPTs frequency response is measured through their time domain optical impulse response at 850 nm via fast Fourier transform (FFT). A cutoff frequency as high as 5.3 GHz was demonstrated. In [Reference Polleux, Moutier, Billabert, Rumelhard, Sönmez and Schumacher3, Reference Marchlewski and Zimmermann11] and [Reference Marchlewski and Zimmermann12] the frequency response is extracted directly from opto-microwave continuous wave measurements. It is noticeable that the two methods applied on similar technologies, i.e. [Reference Yin5, Reference Marchlewski and Zimmermann11], provide very different results and may be related to the non-discrimination of the various mechanisms involved in the phototransistor using time domain measurements. In this paper, we will focus on opto-microwave measurements that we trust to be more accurate.
SiGe HPT performance state from publications.

Pulsed: extracted from the impulse response also called FFT transformation.
OM: extracted from opto-microwave continuous wave measurements.
* At 850 nm optical wavelength.
† At 940 nm optical wavelength.
SiGe HPTs have been used for digital optical receiver circuits [Reference Chen, Pappu and Apsel13], photo oscillators [Reference Lecoy and Delacressonnière14] and more recently a transmission of a 60 GHz WiFi signal operating at 3 Gbps [Reference Viana, Tegegne, Rosales, Polleux, Algani, Lecocq, Lyszyk and Denet15]. They provide a novel approach in order to combine high speed HBTs with low cost microwave phototransistors directly in SiGe bipolar and BiCMOS technologies. To optimize the speed of the phototransistor, [Reference Moutier, Polleux, Rumelhard and Schumacher16] identified the fastest and slowest illuminated regions of the structure based on physical simulations. References [Reference Helme and Houstron17, Reference Yuan18] investigated their opto electric compact circuit modeling. M. D. Rosales et al. [Reference Rosales, Duport, Schiellein, Polleux, Algani and Rumelhard19] verified through an opto-microwave scanning near-field optical microscopy (OM-SNOM) that the distance between the base, emitter, and collector contacts and the optical window influences the dynamic characteristics of the phototransistor. However, no optimization of the phototransistor speed has been performed in terms of the optical probe position over the device and DC biasing conditions, simultaneously. Moreover, there is no information about the optical transition frequency (f Topt ) of SiGe HPTs.
This paper investigates the maximum optical transition frequency of a SiGe HPT fabricated in an 80 GHz SiGe2RF Telefunken GmbH SiGe Bipolar technological process. The optimum biasing points are analyzed to maximize the f Topt and an OM-SNOM over the surface of the HPT is done at optimal DC bias to determine the most sensitive as well as the fastest regions of the HPT.
II. SIGE/SI HPT STRUCTURE UNDER TEST
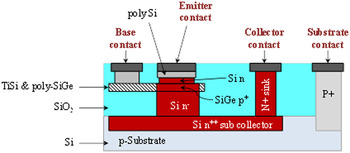
The SiGe HPT was fabricated using the existing SiGe Telefunken technological process for RF bipolar transistors used in wireless communication, which consists in double HBTs based on polysilicon. The minimum emitter size on the layout is of 0.8 × 1.4 µm2 for vertical NPN HBT transistors which provides actual size after processing of 0.5 × 1.1 µm2 due to lateral spacers. This technology exhibits electrical f T up to 80 GHz and f max up to 90 GHz. This enables circuits working above 10 GHz and potentially up to 60 GHz in some configurations [Reference Liu, Trasser and Schumacher20]. The general scheme of the HBT cross-section is shown in Fig. 1.
Schematic cross-section of SiGe2RF technology from Telefunken.

The process parameters of the standard SiGe2RF HBT technology are not modified to design the phototransistors. This ensures compatibility with the technological process and potential integration of complete opto-electric radio frequency (OE-RF) circuits.
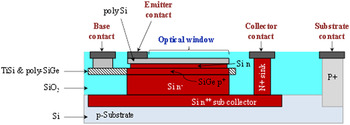
The basic HPT structure is designed by extending simultaneously the emitter, base, and collector layers of the reference HBT [Reference Rosales, Polleux and Algani9]. The optical window is set by designing the metal layer of the emitter contact away from the central region. To improve the optical penetration, the superficial silicon oxide and nitride layers at the defined optical window are removed by using a reactive-ion etching (RIE) step available in the process design kit for pads definition. A cross-section of the phototransistor structure is given in Fig. 2. The light path goes through the polysilicon of the emitter before entering the Si emitter, SiGe base, and Si collector regions. This HPT is essentially one large HBT whose emitter metallization was removed on the top. The optical opening size of the phototransistor emitter is 10 × 10 µm2. The total emitter size is 11.3 × 9.2 µm2 and the total collector dimension is 16.5 × 10.6 µm2. The base profile is a ~40–80 nm thin abrupt SiGe layer with Ge content in the range of 20–25% and with high p-doping in the range of 1019 cm−3 as inferred from static measurements and physical simulation comparison with earlier 50 GHz SiGe HBT generation [Reference Polleux, Moutier, Billabert, Rumelhard, Sönmez and Schumacher3, Reference Moutier, Polleux, Rumelhard and Schumacher16]. The collector is typically 300–400 nm thick and low doped. A p+ guard ring which is connected to the ground is surrounding the substrate region and creates a homojunction at the interface with the substrate.
Simplified schematic cross-section of an extended Emitter Base Collector HPT.

III. MEASUREMENT BENCH SETUP
Figure 3 shows the on-wafer test setup used to measure the HPT opto-microwave performances. It makes use of an 8753ES 40 GHz vector network analyzer (VNA) from Agilent. Port 1 of the VNA directly modulates a 10 Gbps 850 nm multimode vertical cavity surface emitting laser (VCSEL) from Philips ULM photonics. We prefer to use a multimode light source to characterize our device for greater ease and availability but also as it is better consistent with the practical conditions of use of the HPT in home area network (HAN) applications where multimode sources and multimode fibers are largely deployed at 850 nm [Reference Guillory1]. The directly modulated optical signal is connected to a 90/10 optical splitter. The 10% output of the optical power feeds a power meter for monitoring, while the 90% output is injected into the phototransistor through a focusing lensed fiber vertically placed above the HPT optical window. The VCSEL is biased so as to provide a 2.38 mW optical beam at the end of the lensed fiber. The optical probe is mounted on a three axes nano-positioner used to optimize the optical coupling to the HPT.
On wafer opto-microwave measurement bench setup.

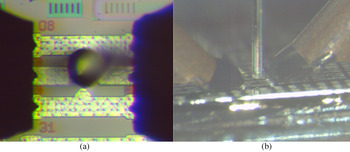
A tilted mirror is used to monitor the height of the optical probe above the optical window of the HPT through the microscope as shown in Fig. 4. This distance is set at 50 µm from the surface to align the optical window within the beam waist of the lensed fiber.
(a) Top view of the fiber probe spot illuminating the phototransistor, with RF probes at the extremities of GSG access lines; (b) side view through the tilted mirror of the fiber probe illuminating the phototransistor.

The optical probe scans a 60 × 60 µm2 surface above the HPT including the 10 × 10 µm2 optical window with a 2 µm step (±20 nm). For each position, S-parameters of the optical link are measured in the (50–20 GHz) frequency range using the VNA. This characterization provides a complete OM-SNOM view of the HPT under test.
The HPT is mounted in a common emitter configuration topology with two 100 µm-pitch GSG pads in order to perform on wafer microwave measurements. The base is biased through an external bias tee loaded with 50 Ω which is the standard normalization load in microwave applications. This 50 Ω value is also important as well for intrinsic HPT characterization according to [Reference Schiellein21, Reference Polleux, Paszkiewicz, Billabert, Salset and Rumelhard22] on InP/InGaAs. The collector is connected to the port 2 of the VNA and biased through the internal bias tee of the VNA. An Agilent B1500 semiconductor parametric analyzer is used to monitor and to generate the biasing levels required for the HPT.
A proper de-embedding technique is required to extract the behavior of the HPT from the pads, interconnections, and probes effects. There are three techniques suited for an on-probe opto-microwave de-embedding: adapter removal, T-matrix approach, and ghost removal technique [Reference Schiellein21, 23].
The adapter removal technique is applied to study a device-under-test (DUT) composed of the VCSEL, the lensed fiber, the SiGe HPT under test, and the RF probes.
The ghost removal sets the DUT to include the VCSEL, the fiber, and the SiGe HPT until only its pad. The measurement of the SiGe HPT with this technique requires four measurement steps and then a two steps post-processing. The DUT in the T-matrix system is composed of the VCSEL, the fiber, the SiGe HPT, and its GSG probes. It requires three measurement steps according to [Reference Schiellein21, 23], the first one being a short-open-load-thru (SOLT) calibration at the K-connector's probe planes, and the second one being the extraction of the probe characteristics through a SOLT GSG calibration substrate. The third step consists of the measurement of the full DUT. We preferred to use the T-matrix technique as it involves less measurement steps, procedures that are mathematically easier to implement and a lower number of connector-level calibrations [Reference Schiellein21].
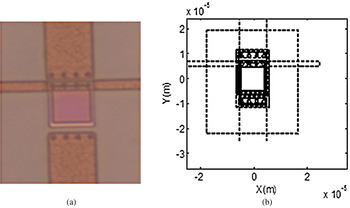
Figure 5(a) shows the microscopic picture of the phototransistor where the ground (left and right) and signal (up and down) lines are clearly visible. The base contact is taken from the top side, the collector contact from the bottom side, and the emitter contact is connected at its left and right side to the ground. The layout is accordingly sketched in Fig. 5(b) which defines the optical probe coordinates with its origin given at the center of the HPT optical window.
(a) Top view of the phototransistor; (b) layout of the phototransistor and optical probe coordinate axes centered at the HPT optical window center.

IV. EXPERIMENTAL RESULTS
The S-parameters measurement allows determining the opto-microwave properties of the phototransistor. The opto-microwave gain of the phototransistor, known as the 50 Ω responsivity of the HPT, can be extracted from the transmission parameter (S 21) [Reference Polleux, Moutier, Billabert, Rumelhard, Sönmez and Schumacher2, Reference Polleux, Paszkiewicz, Billabert, Salset and Rumelhard22]. The optical transition frequency (f Topt ) is defined as the frequency at which the 50 Ω opto-microwave gain of the HPT mode is equal to the 50 Ω low frequency gain of the PD mode (Vbe = 0 V). Thus, f Topt is extracted from these two S-parameter mode measurements.
It is important to determine the best region for optical coupling in order to optimize both the speed and the responsivity of the device. It is also important to optimize its DC biasing level accordingly. Performing an OM-SNOM at various DC biasing conditions could be an ideal way of characterizing the HPT structure. However, due to the limitation of computer memory and measurement time, we prefer to perform OM-SNOM once the biasing conditions have been optimized.
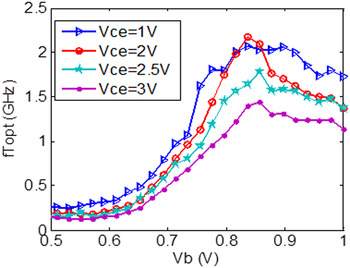
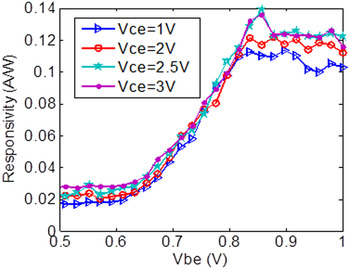
We first perform the opto-microwave measurement of the HPT by setting the optical probe at a given position of the optical window (seeking the maximum gain as much as possible) in order to fix the DC bias. Preliminary results of f Topt as a function of the base voltage at various collector-emitter voltages are extracted and shown in Fig. 6. For this optical probe position, a maximum f Topt of 2.2 GHz is obtained at Vbe = 0.857 and Vce = 2 V. The low frequency responsivity at 50 MHz versus Vbe and Vce is then given in Fig. 7. A high responsivity is achieved above Vbe = 0.837 V when Vce = 1 and 2 V, and at Vbe = 0.857 V when Vce = 2.5 and 3 V.
Optical transition frequency as a function of Vbe and Vce at non-optimal position of the optical probe.

Responsivity at 50 MHz as a function of Vbe and Vce at non-optimal position of the optical probe.

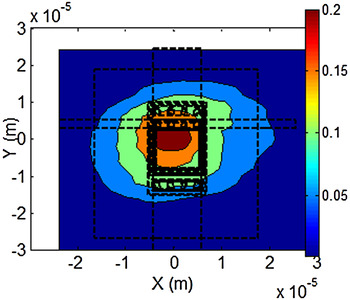
The experimental OM-SNOM of the HPT is then performed both in the photodiode mode and in the phototransistor mode at the optimum biasing conditions in terms of f Topt deduced from the previous result: at a fixed collector-emitter voltage of 2 V and a fixed base-emitter voltage of 0.857 V in phototransistor mode, and 2 V Vce and short circuited base emitter in the photodiode mode. Figure 8 shows the OM-SNOM view of the 50 Ω low frequency opto-microwave gain (at 50 MHz), i.e. 50 Ω responsivity. The optical beam is assumed to have a Gaussian profile along x- and y-axes.
OM-SNOM view of the 50 Ω opto-microwave gain at 50 MHz in phototransistor mode, with the HPT layout superimposed, at Vce = 2 V and Vbe = 0.857 V.

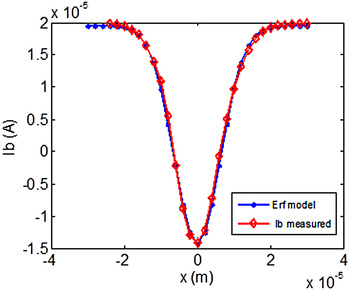
The resulting opto-microwave response is thus the correlation between the optical window and the Gaussian profile of the beam. The Erf function is then used to model this gain and to fit with the measurement [Reference Rosales, Duport, Schiellein, Polleux, Algani and Rumelhard19]. However, since the substrate photodiode created by the n+ sub-collector and the p+ ground ring (shown in Fig. 1) is photosensitive at 850 nm, fitting the Erf model with respect to the low frequency responsivity is not the right way to extract the optical beam parameters. Indeed, we prefer to fit the model with respect to the base current of the HPT measured in the phototransistor mode as it is independent from the substrate photocurrent. The comparison of the so-extracted model and the measurements is given in Fig. 9. It can be noticed that the photocurrent induced in the base is opposite to the dark current and create a negative sign of Ib at the peak injection.
Slice of the OM-SNOM view of the base current versus x position at y = 0 m with measurement results (diamonds) and adjusted model (circles) at Vce = 2 V and Vbe = 0.857 V.

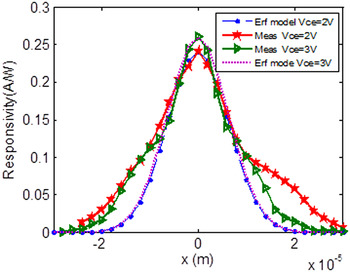
The OM-SNOM view of the gain is symmetrical along x- and y-axes as shown in Fig. 8. This is also illustrated on the x-axis cross-section given in Fig. 10. From the adjusted model, we estimate that the power shape of the beam is circular with a full width half maximum diameter of 28 µm. This beam size is larger than the HPT window size. An optical coupling rate of 32.3% between the lensed fiber and the HPT window is then deduced.
Slice of opto-microwave responsivity at 50 MHz as a function of x position (y = 0 m) at Vce = 2 and 3 V (Vbe = 0.857 V). Bold lines are measured values. Light and dotted lines are Erf models.

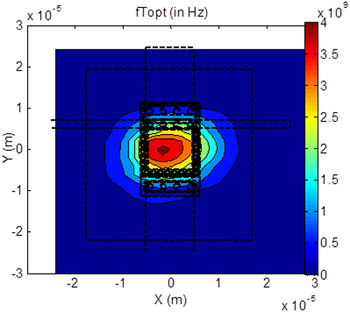
The dynamic behavior of the phototransistor over the surface of the structure is analyzed through the optical transition frequency f Topt . Figure 11 shows the OM-SNOM view of f Topt as a function of the lensed fiber position. The 50 Ω opto-microwave gain at the peak detection position is plotted in Fig. 12 for both photodiode and phototransistor modes. The opto-microwave cutoff frequency in phototransistor mode, f -3dB,hpt , is measured to be 0.42 GHz. The measured f Topt curve is symmetrical with respect to the x- and y-axes and has a peak at the center of the optical window, x = y = 0 µm. Its peak value is 4.12 GHz.
OM-SNOM view of the optical transition frequency at Vbe = 0.857 and Vce = 2 V, with the HPT layout superimposed.

Opto-microwave gain of the photodiode and phototransistor modes at x = 0 and y = 0 m (peak position of f Topt ) at Vbe = 0.857 and Vce = 2 V.

V. DISCUSSION
The measured opto-microwave gain is well fitted with an Erf function in the −5 µm < x < 5 µm range as shown in the cross-section given in Fig. 10. This indicates that the opto-microwave gain is actually only affected by the coupling ratio in this specific region. At the center of the optical window, a raw 0.26A/W (resp. 0.241A/W) responsivity is measured when Vce = 3 V (resp. 2 V). Taking into account the 32.3% coupling ratio of the lensed fiber to the HPT, an absolute responsivity of 0.805A/W is then extracted when Vce = 3 V. We also observe an optical gain of 20 dB as shown in Fig. 12 compared with a DC current gain (β) of 300. It indicates that we benefit from the phototransistor internal amplification property beyond its equivalent photodiode mode operation. An application of this device was shown in [Reference Viana, Tegegne, Rosales, Polleux, Algani, Lecocq, Lyszyk and Denet15] with a 3 Gbps data transmission.
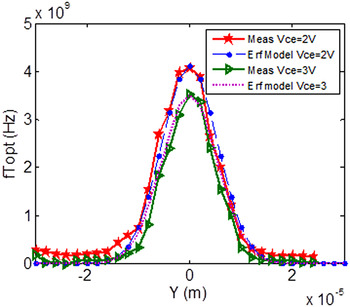
The Erf function model does not fit well for |x| > 5 µm. In this case the measured gain is higher than what is predicted from the model curve. This region presents a very low f Topt , as can be seen in Fig. 13, with no specific dependency of the responsivity on the position when moving the fiber across the optical window. This can be explained by the contribution of the Si substrate which absorbs light at 850 nm.
Slice of optical transition frequency at x = 0 m.

A maximum f Topt of 4.12 and 3.5 GHz is measured at the peak position when Vce = 2 and 3 V, respectively. According to Fig. 13, the f Topt curve versus the fiber position follows the same Erf function variation as the opto-microwave gain. At both extremities, its value is very low and could be attributed to the substrate detection. This indicates that f Topt follows the coupling efficiency variation law into the HPT and is then mostly limited by the substrate effect on the photodiode mode. Table 2 provides a summary of the SiGe HPT performances at 850 nm.
SiGe HPT Performances.

* At 50 MHz.
VI. CONCLUSION
This paper presents a SiGe HPT of 10 × 10 µm2 optical window developed in an existing 80 GHz SiGe HBT technology without modifying the vertical stacks and layers. The optimal DC biasing has been extracted in order to maximize the 50 Ω opto-microwave gain and the optical transition frequency f Topt of the device. An OM-SNOM characterization has been conducted to understand the behavior of the SiGe HPT. A detailed description of the experimental bench setup was provided and use of a direct modulated optical signal to avoid discrepant measurements as seen with SiGe HPTs in the literature. For an optimum DC bias of Vce = 2 and Vbe = 0.857 V, an f Topt of 4.12 GHz, a 3 dB cutoff frequency of 420 MHz in HPT mode and an absolute responsivity of 0.805A/W at 50 MHz have been experimentally demonstrated. This phototransistor can be used in further opto-microwave applications where the operating frequency could lie in the 1–10 GHz range where integration to Si integrated circuits and cost are the main issues.
ACKNOWLEDGEMENT
This work was partly supported by the French DGCIS FUI8 ORIGIN project, and by the Engineering Research and Development for Technology – Department of Science and Technology (ERDT-DOST) of the Philippines.
 Zerihun Gedeb Tegegne was born in West Gojjam, Ethiopia in 1983. He received his B.Sc. in Electrical Engineering from Arbamich University, Ethiopian in 2007 and master degree in Optical Communications and Photonic Technologies from Politecnico di Torino, Italy in 2012. He worked as a transmission network engineer at Ethiopian Telecommunication Corporation from 2007 to 2011. He is currently pursuing a doctoral degree at the Université Paris-Est, France, in ESYCOM laboratory. His current research topic is on SiGe/Si microwave photonic devices for Radio-over-Fiber applications. He is focused on experimental studies and physical modeling of SiGe phototransistors as well as designing and realization of Silicon based on chip optical and microwave interconnections.
 Carlos Viana was born in Viana do Castelo, Portugal, in 1986. He received the M.S. degree in Electrical and Computers Engineering from the Faculty of Engineering of the University of Porto (FEUP), Porto, Portugal in 2010 and Ph.D. degree in Electronics, Optoelectronics and Systems from Université Paris-Est, Champs-sur-Marne, France, in 2014. Since 2010 he has been a researcher with ESYCOM laboratory at ESIEE-Paris, Noisy-le-Grand, France. His research interest includes optoelectronic device developments, integration and packaging for low cost Radio-over-Fiber technology applications.
 Marc D. Rosales received his B.Sc. in Electronics and Communications Engineering and his M.Sc. in Electrical Engineering with a major in Microelectronics from the University of the Philippines, Diliman in 1999 and 2004, respectively. He received his Ph.D. degree in the Opto-Microwave field from Université Paris-Est (UPE) in 2014 at ESYCOM. He is currently an Assistant Professor at the University of the Philippines, Diliman an affiliate of the UP Microlectronics and Microprocessors Laboratory.
 Julien Schiellein was born in Paris, France, in 1982. He received his Engineering degree in Microelectronic from ENSERG, Grenoble, France, and the Master degree in Optic and Radiofrequencies from the Institut Polytechnique de Grenoble, France, both in 2008. He received his Ph.D. degree in the Opto-Microwave field in December 2012 from Université Paris Est at ESYCOM. His dissertation topic was contributing to the theoretical and experimental studies of InP/InGaAs HPTs. Dr., Schiellein is now working for Thales Air System on opto-microwave systems dedicated to Radar Systems.
 Jean-Luc Polleux received his Master degree/Diplôme d'ingénieur in Microelectronic from ENSEIRB, Bordeaux, France, and the DEA degree in Electronic and Telecommunications from the University of Bordeaux 1, France, both in 1997. He received his Ph.D. degree in the Opto-Microwave field from CNAM, Paris, in 2001. He then joined ESIEE-Paris at Université Paris-Est (UPE), France, and the joint laboratory ESYCOM. He is now Associate Professor. His current research involves microwave-photonics devices and systems for Radio-over-Fiber applications with special emphasis on microwave phototransistors (SiGe/Si and InGaAs/InP), Silicon-based integration and packaging, analogue VCSELs and opto-microwave devices modeling. He published over 60 scientific publications and two patents. He is administrator of Optics'Valley, Ile-de-France region, and head of the international master of Electronics of ESIEE Paris-UPE.
 Marjorie Grzeskowiak was born in France, in 1973. She received her M.Sc and Ph.D. degrees, both in Electronics and in Microelectronics Engineering, from the Université des Sciences et Technologies de Lille (USTL) in France, in 1996 and 1999, respectively. Her dissertation dealt with the design, simulation, realization, and measurement of the microwave antennas on GaAs substrate. In 2000, she joined the Electronic, Communication, Systems and Microsystems (ESYCOM) Laboratory at the Université de Marne-la-Vallée (UPEM) in Marne-la-Vallée, France, as an Assistant Professor, where she is involved in the propagation and the design of the millimeter wave passive devices, and more recently in the study of the magnetic coupling. She is focused on the design, simulation, and measurement.
 Elodie Richalot received her Master degree/Engineer Diploma and Ph.D. degree in Electronics Engineering from the ENSEEIHT and the INPT, Toulouse, France, in 1995 and 1998, respectively. Since 1998, she has been with the University Paris-Est Marne-la-Vallée, Champs-sur-Marne, France, as Associate Professor then Professor in Electronics in 2010. She is currently the head of the Master of electronics of her university and of the research group in Electromagnetism at ESYCOM. Her current research interests include modeling techniques, electromagnetic compatibility, urban propagation, and millimeter wave transmission lines.
 Catherine Algani received her Degree from the University of Paris 6, Paris, France, the D.E.A. degree in Electronics, and the Ph.D. degree in 1987 and 1990, respectively. Her dissertation focused active MMIC design using GaAs HBTs technology in CNET-Bagneux. In 1991, she joined the Electronics Engineering Department and the LISIF Laboratory, University of Paris 6, as a Lecturer. From 1991 to 2005, she worked on the design of microwave and millimetre-wave integrated circuits on different GaAs technologies. In 1997, she began to work in the area of microwave photonics (optically controlled microwave switches on GaAs and electro-optic organic modulator). In 2005, she joined ESYCOM, CNAM-Paris, Paris, where she is currently a Full Professor. Her current research interests include the development of devices, circuits, and sub-systems for ultrahigh speed digital and analog communications for ROF and wireless applications. These researches include the modeling, the design, and the characterization of such structures.