INTRODUCTION
Despite constant efforts to find new remedies, eukaryotic parasites remain today one of the most damaging plagues for the human species. A classical approach to fight against a parasite consists of disturbing its metabolism in a lethal way, for instance by the use of a drug inhibiting the action of a target enzyme. This drug also has to be designed in order to limit its effects on the host metabolism. To decipher both the effect of drugs and their potential targets, it is important to understand as completely as possible the metabolism of the parasite and the host.
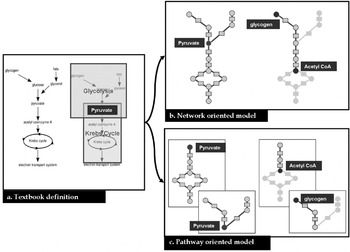
Descriptive studies can be achieved by using low- and high-throughput experimental techniques. For instance, carbon flux tracing or knock-out tests enable us to describe a few central metabolic pathways in several parasites (Coustou et al. Reference Coustou, Biran, Breton, Guegan, Rivière, Plazolles, Nolan, Barrett, Franconi and Bringaud2008). But gene regulation and other complex processes can trigger metabolic events in pathways other than the ones under study. It is thus necessary to complete these pathway-oriented studies with a larger (genome-scale) analysis of metabolism. Functional annotation of a complete genome provides an overview of the enzymatic activities potentially performed by an organism. These activities can then be translated into biochemical reactions gathered into metabolic pathways. For several parasites, these pathways are stored in browsable databases such as KEGG (Kanehisa et al. Reference Kanehisa, Goto, Furumichi, Tanabe and Hirakawa2010) or BioCyc (Caspi et al. Reference Caspi, Altman, Dale, Dreher, Fulcher, Gilham, Kaipa, Karthikeyan, Kothari, Krummenacker, Latendresse, Mueller, Paley, Popescu, Pujar, Shearer, Zhang and Karp2008). Although they are very helpful for the study of metabolic functions independently, these databases do not enable us to analyse the metabolism at once in its entirety. This is particularly the case when a metabolic process spans several metabolic pathways (see Fig. 1). An alternative to pathway-oriented analysis is to gather all the reactions present in the organism's metabolism into a single metabolic network. In that case, a compound or a reaction occurring in several pathways will be considered as a single element thus keeping a faithful image of the connectivity (see Fig. 1b).
Difference between pathway- and network-oriented modelling. Given a text-book description (a.) of energetic metabolism, two kinds of models can be generated, a network-oriented (b.) and a pathway-oriented one (c.). In fact, energy metabolism can be divided into two pathways: glycolysis and Krebs cycle both sharing the pyruvate. In the network-oriented model pyruvate is modelled by one node whereas it is duplicated in the pathway-oriented model. For a path search (e.g. which reactions are linking glycogen and acetyl coenzyme A), the network model is more adapted, especially when the path spans several pathways.

The most detailed and faithful computational analysis of metabolism consists of modelling each reaction using all its kinetic parameters in order to get a list of ordinary differential equations. Solvers can then be applied to this mathematical model in order to simulate the dynamical behaviour of the metabolism (Garfinkel, Reference Garfinkel1968; Voit, Reference Voit2002). This method provides the most detailed image of metabolism but requires many parameters such as enzyme kinetic properties or initial concentrations. This model is thus not suitable for large-scale studies.
Constraint-based methods such as Flux Balance Analysis (Palsson, Reference Palsson2000) or elementary mode analysis (Schuster and Hilgetag, Reference Schuster and Hilgetag1994), enable us to model the distribution of the flux in the metabolic network under certain conditions. Nevertheless, to be really efficient, these models need a rigorous and tedious data curation step as they require exact stoichiometric coefficients and system boundaries to fulfil the steady-state assumption on which they are based (Reed et al. Reference Reed, Famili, Thiele and Palsson2006). Some global metabolic questions can be addressed using less data in the network. The graph model only requires a list of reactions and is already a powerful tool to get a first insight on a complete metabolic network. For instance, the search of potential drug targets can be guided by using a metabolic graph model. This mathematical object has long been studied and a large range of algorithms to analyse graphs is already available. Some of these methods are particularly well suited for biological network mining (Barabási and Oltvai, Reference Barabási and Oltvai2004). A graph is made of a set of nodes and links (edges) connecting them. This modelling is itself a challenge since there are several ways to build a metabolic graph, depending on the elements (reactions, compounds, enzymes) and the kind of interactions one wants to model (Lacroix et al. Reference Lacroix, Cottret, Thébault and Sagot2008).
Moreover, the relevance of an algorithm output is strongly conditioned by these modelling choices. The challenge for parasitologists interested in such approaches is to know which graph models and methods are more appropriate to their biological questions. The purpose of this review is to guide parasitologists in graph modelling of parasite metabolism, from the construction of the metabolic network to the choice of a graph model and suitable methods. As the pertinence of the results obtained from modelling is often directly linked to the quality of the original data, we first address the metabolic reconstruction process and its limitations. Then, we briefly review the characteristics of metabolic databases and format exchanges focusing on their utility in network modelling. Next, we detail the different ways to model a genome-scale metabolic network into a metabolic graph. Finally, we demonstrate the relevance of graph modelling for analysing parasite metabolism, in particular by providing a framework to map omics experiments, and by using the graph topology to provide some clues about new drug targets.
METABOLIC NETWORK RECONSTRUCTION
The reconstruction of the metabolic network consists precisely of defining the reactions potentially occurring in a given organism.
From genomic data
The process classically starts by determining the enzymatic activities potentially coded by the genome of an organism. This functional annotation is essentially performed by sequence homology but could be refined by using genome-context information (synteny groups, protein co-evolution and gene fusion) or generated by transcriptomics or proteomics. To perform this first step, many methods have been developed. Their efficiency and limitations have been discussed in recent papers (Francke et al. Reference Francke, Siezen and Teusink2005; Reed et al. Reference Reed, Famili, Thiele and Palsson2006; Lacroix et al. Reference Lacroix, Cottret, Thébault and Sagot2008) and, in particular, when applied to eukaryotic parasites (Pinney et al. Reference Pinney, Papp, Hyland, Wambua, Westhead and McConkey2007).
The second step consists in inferring a list of reactions from the list of metabolic activities deduced from the functional annotation of the genome. Most enzymatic activities are coded by an EC number, made of four point separated numbers (e.g. 1.6.3.1), each one providing a more detailed description of the enzymatic activity. By referencing to databases as ENZYME (Bairoch, Reference Bairoch2000), or BRENDA (Schomburg et al. Reference Schomburg, Chang, Ebeling, Gremse, Heldt, Huhn and Schomburg2004), a list of potential reactions can be linked to each EC number. It may happen that an enzyme has no assigned EC number. To circumvent this problem, the PATHOLOGIC software compares the enzyme name to a dictionary where enzymatic activity names are linked to potential reactions (Karp et al. Reference Karp, Paley and Romero2002).
This preliminary list of reactions has to be refined for several reasons. Some reactions may be missing because the corresponding enzyme was not assigned during the annotation process. To overcome this limitation, it is possible to use the information about metabolic pathways already inferred in the organism. In fact, if a metabolic pathway is known as being present in the organism, most of its reactions should be present in the list (Green and Karp, Reference Green and Karp2004). For each missing reaction, the Pathway Hole Filler proposes a list of candidate genes that could correspond to the missing enzymatic activity. This search is performed by homology to genes coding for the same activity in other organisms. To strengthen this prediction, the co-localisation with other genes of the pathway is also taken into account (Green and Karp Reference Green and Karp2004). The SEED system proposes the same approach but, in addition, the list of reactions is constrained by checking the feasibility of biological scenarios on the inferred network. A scenario is simply the synthesis of a set of products from a set of substrates using a sequence of reactions. If the model used does not fulfil this constraint, a list of potentially missing reactions is proposed (DeJongh et al. Reference DeJongh, Formsma, Boillot, Gould, Rycenga and Best2007).
An enzyme can potentially catalyse several reactions, but it is often the case that not all these reactions occur in a single organism. For instance, although primary metabolites are often the same for homologous enzymes across organisms, the use of cofactors may vary (Reed et al. Reference Reed, Famili, Thiele and Palsson2006). A first option to determine the specificity of an enzyme consists of manually browsing BRENDA (Schomburg et al. Reference Schomburg, Chang, Ebeling, Gremse, Heldt, Huhn and Schomburg2004). This database contains, for a large range of organisms, literature-based enzyme reaction correspondences. For many non-model organisms, in particular eukaryotic parasites, BRENDA does not cover the entire list of enzymes. In this case the SEED (DeJongh et al. Reference DeJongh, Formsma, Boillot, Gould, Rycenga and Best2007) and the method called AUTOGRAPH (Notebaart et al. Reference Notebaart, van Enckevort, Francke, Siezen and Teusink2006) propose to automatically do this enzyme specificity assignment by looking for the considered enzyme in a reference organism.
Substrates of many reactions inferred from EC numbers or enzymatic activity names are not actually specified but correspond to generic classes of compounds (e.g. an aldehyde). In a network analysis, these reactions cannot be considered as the other ones. It is necessary to determine manually precisely which metabolites are actually involved. In the previous reconstruction steps, the direction of reactions is not determined. A simple way to achieve this assignation consists of considering a reaction as irreversible if its direction is always the same in all the pathways where it occurs. However, the direction of a reaction can vary depending on the cell conditions, such as the temperature, pH and concentration of the metabolites (Reed et al. Reference Reed, Famili, Thiele and Palsson2006). Recently, some methods were proposed to combine the overall topology of the network and thermodynamical constraints to infer these directions (Kümmel et al. Reference Kümmel, Panke and Heinemann2006; Feist et al. Reference Feist, Henry, Reed, Krummenacker, Joyce, Karp, Broadbelt, Hatzimanikatis and Palsson2007).
The localisation of enzymes and consequently of the reactions in membrane-bound compartments have a great impact on the overall functioning of metabolism, especially in eukaryotes. In a complete metabolic network, some reaction cascades are impossible because of the sub-cellular localisation of the enzymes involved. In Roberts et al. (Reference Roberts, Robichaux, Chavali, Manque, Lee, Lara, Papin and Buck2009) and Chavali et al. (Reference Chavali, Whittemore, Eddy, Williams and Papin2008), the authors added compartment information in the genome-scale metabolic reconstruction for Trypanosoma cruzi and Leishmania major, respectively according to the literature. Unfortunately, this kind of information is not available for every organism and implies expensive large-scale experiments. To circumvent this problem, automatic methods based on signatures in the sequence or in the structure of the enzyme were designed (Casadio et al. Reference Casadio, Martelli and Pierleoni2008). However, the accuracy of these methods depends on the organism and the compartments. Mintz-Oron et al. (Reference Mintz-Oron, Aharoni, Ruppin and Shlomi2009) propose a method which takes into account stoichiometric constraints and a priori localised reactions to predict the compartmentalisation of the whole network.
During their life cycles, the metabolism of parasites can be the subject of substantial modifications, in particular those caused by modifications of the environment. Therefore, to build stage-dependent models, it is essential to determine in which life stage each reaction is active. For instance in proteomics, data are used to characterize and analyze the metabolism of Trypanosoma cruzi when the parasite is present in the insect gut (Roberts et al. Reference Roberts, Robichaux, Chavali, Manque, Lee, Lara, Papin and Buck2009).
From metabolomic data
In silico reconstruction has mainly been done using genome annotation. However, the development of high-throughput methods allows getting a different point of view on the metabolism. In this section we will focus on the use of metabolomics to refine and extend metabolic network reconstructions.
High resolution mass spectrometry (FT-ICR, LTQ-Orbitrap) gives a more accurate view of the metabolome (Wilson et al. Reference Wilson, Plumb, Granger, Major, Williams and Lenz2005). In fact, Breitling et al. (Reference Breitling, Pitt and Barrett2006a) show that, with a precision lower than two PPM (parts per million), the number of possible molecular formulae is becoming low enough for annotation. Based on this level of accuracy, Breitling et al (Reference Breitling, Ritchie, Goodenowe, Stewart and Barrett2006b) proposed a method to build networks based only on high resolution masses called ab initio. This method computes the difference M1−M2 between each pair of masses of the metabolome {M1,M2}. This difference is then compared to a list of potential biochemical transformations. If this difference corresponds to one of the transformations then a potential link is defined between two metabolites. For instance, if the difference corresponds to the molecular weight of a water molecule then a link modelling the adding/removing of a water molecule is added to the network. This method provides a potential network but does not take into account thermodynamic rules or cellular localisation, and really depends on the quality of the mass list used as input. The software Metanetter (Jourdan et al. Reference Jourdan, Breitling, Barrett and Gilbert2008) implements this algorithm and allows the visualization into Cytoscape (Shannon et al. Reference Shannon, Markiel, Ozier, Baliga, Wang, Ramage, Amin, Schwikowski and Ideker2003) software.
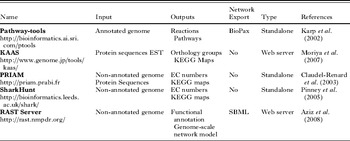
Metabolomics can associate quantitative values with observed metabolites. In a perturbed system metabolite quantities can be followed during a time series. There is a large range of probabilistic methods able to imply relations between metabolites from these quantitative data (Bayesian methods, correlation based methods … etc). The main limitation in using these approaches for metabolic network is that the predicted links (edges) do not necessarily correspond to a single biochemical reaction (de la Fuente et al. Reference de la Fuente, Bing, Hoeschele and Mendes2004). A great advantage of a metabolic network reconstruction based on metabolomics is that it detects non-enzymatic reactions and that it does not depend on the availability of a genome sequence. However, the approaches described here are very sensitive and generate many false positive links between metabolites. Furthermore, even with high resolution metabolomic data, one mass can match several metabolites (Kind and Fiehn, Reference Kind and Fiehn2007), adding imprecision in the metabolic network produced. When both genomic and metabolomic data are available for the same organism, the confrontation of the two sources can greatly improve the quality of the metabolic network. One of the next challenges in the metabolic network reconstruction will be to create methods able to integrate the network built from genomic annotations and the one built from metabolomic experiments and other omics experiments. Table 1 presents a non-exhaustive list of tools to reconstruct metabolic networks.
Metabolic reconstruction tools

Metabolic databases
The two most commonly used metabolic databases are BioCyc (Caspi et al. Reference Caspi, Altman, Dale, Dreher, Fulcher, Gilham, Kaipa, Karthikeyan, Kothari, Krummenacker, Latendresse, Mueller, Paley, Popescu, Pujar, Shearer, Zhang and Karp2008) and KEGG (Kanehisa et al. Reference Kanehisa, Goto, Furumichi, Tanabe and Hirakawa2010). The main advantage of these two databases is that they have an open access policy for the data they store. These data are of different kinds: genomic, biochemical, and metabolic. Moreover, they cover almost the entire scope of organisms that have been sequenced. Finally, they offer a wide range of bioinformatics tools to mine metabolic networks.
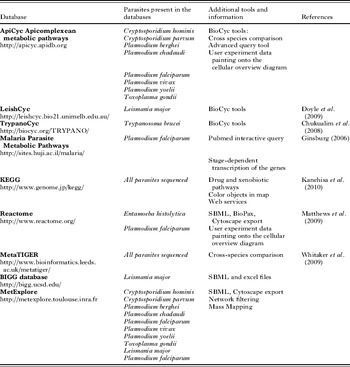
The main difference between these two databases is their metabolic network reconstruction strategy. KEGG is made of a unique repository where all metabolic reconstructions are centralised and were built by the same team. BioCyc works in a more distributive manner. The assumption is that no single team can curate the reconstruction of such a large range of organisms. For each new sequenced organism they provide a first automatically built reconstruction. Then expert teams curate their own organism-specific database. Moreover, the pathway-tools, metabolic reconstruction software provided by BioCyc, allow creation of a web front-end to the curated database. This web interface implements BioCyc graphical conventions and functions. BioCyc-like databases have been developed by expert groups for many parasites (see Table 2).
Metabolic databases containing metabolic network information about eukaryotic parasites

MetaTIGER database contains information about the metabolic networks of more than 500 organisms (Whitaker et al. Reference Whitaker, Letunic, McConkey and Westhead2009). The specificity of this database is that it offers a comparative view of several organisms on KEGG metabolic maps. Another specificity of MetaTIGER is to give a confidence score to each inferred enzyme. The database Malaria Parasite Metabolic Pathway (MPMP) describes a collection of metabolic pathways highly curated for Plasmodium falciparum (Ginsburg, Reference Ginsburg2006). In addition to this complete source of information, graphical views of metabolic pathways show the transcription level of metabolic genes according to the stage in the life cycle of the parasite. Moreover, MPMP allows a direct access to PubMed to obtain articles on metabolic pathways specific to Plasmodium falciparum. But it is not possible to retrieve the data in another format than the graphic one which makes the use of other bioinformatics tools difficult. Table 2 presents a non-exhaustive list of databases containing information about the metabolism of eukaryotic parasites.
Data exchange
One aim of metabolic reconstruction is to allow the application of several computational methods on a metabolic network. But these methods are often implemented in various softwares. To facilitate the use of these softwares on the same metabolic network, standard exchange formats have been developed. It is thus relevant for databases to export networks in at least one of these formats. For metabolic networks mainly two formats are available: Biopax and SBML, both are based on the XML format (Extensible Markup Language). Both formats and their specificity have been described by Strömbäck and Lambrix (Reference Strömbäck and Lambrix2005). BioPax format is more complete since it is able to handle hierarchical links between objects and all the information, from genes to metabolites, can be stored in a single file. Nevertheless, it seems that its complexity makes it rarely used in metabolic network tools. The SBML format (Systems Biology Markup Language) is much simpler. It is essentially made of a list of reactions with a list of all the substrates and products (Finney and Hucka, Reference Finney and Hucka2003). Information on metabolite concentrations and kinetic properties can be added to allow the numerical simulation of the network. SBML is now used by a large number of systems biology software.
The previously mentioned databases do not provide a description of the whole network in these formats. The BIGG web server (http://bigg.ucsd.edu/) gives access to around 40 highly curated metabolic reconstructions directly available in SBML format. But BIGG contains only a metabolic reconstruction for one eukaryotic parasite (Leishmania major). Recently, our group developed the web server MetExplore (http://metexplore.toulouse.inra.fr) that contains about 50 metabolic networks built from genomic annotations and available in SBML format. Of them, about 10 come from eukaryotic parasites (Table 2). SBML format also allows graph visualisation of a metabolic network. Indeed, Metaviz (Bourqui et al. Reference Bourqui, Cottret, Lacroix, Auber, Mary, Sagot and Jourdan2007) and Cytoscape (Shannon et al. Reference Shannon, Markiel, Ozier, Baliga, Wang, Ramage, Amin, Schwikowski and Ideker2003) represent a SBML file as a bipartite graph and, beyond its visualisation, propose graph tools to analyse it. Once the list of reactions and, eventually, the associated enzymes are obtained, the next step in the graph modelling is to choose which elements of the network among the reactions, the compounds and the enzymes the model will be focused on and the kind of relations that will be modelled.
GRAPH MODELLING OF METABOLIC NETWORKS
Graph models
A graph is a mathematical object that describes connections between elements of a dataset. A graph is defined as a set of nodes connected by a set of edges (for a more formal definition, please refer to Lacroix et al. (Reference Lacroix, Cottret, Thébault and Sagot2008)). Creating a graph model consists in translating a list of textual descriptions of connections into a formal object. We will see that this translation is not unique in the case of metabolic networks.
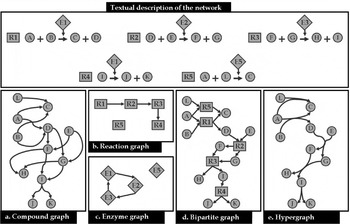
Defining a graph model for a metabolic network requires identifying which biological entities are associated with nodes and what is the meaning of the connections between them. This choice mainly depends on the question one wishes to address using this graph model. The genome reconstruction described above will provide a list of reactions, for instance metabolites A and B are turned into metabolites C and D. From this list it is possible to build different kind of metabolic graphs (see Fig. 2), depending on which objects and relations the modelling is centred on.
Metabolic graph models. Given a textual description of the five reactions of the network, five metabolic graph models can be built. In this figure and all the following ones, the round nodes correspond to the metabolites and the square nodes to the reactions. In the compound graph (a), nodes are compounds and two compounds are connected if they are input and output of a reaction. In the reaction graph (b) nodes are reactions and two reactions are connected if the product of one is the substrate of the other. In the enzyme graph (c), nodes are enzymes and they are connected if at least one reaction catalysed by the first enzyme has a product which is the substrate of at least one reaction catalysed by the other enzyme. In the bipartite graph (d) there are two kinds of nodes, reactions and metabolites; a compound is connected to a reaction if it is a substrate or a product of this reaction. In the hypergraph model (e) substrates of a reaction are connected to products of a reaction through a hyperedge.

In the compound graph, nodes correspond to metabolites and there is an edge between two metabolites if a reaction exists where one is the substrate and the other the product. In Fig. 2a, A and C are linked by an edge because the reaction R1 produces C from A. In the reaction graph, nodes correspond to reactions. There is an edge between two reactions if one produces a metabolite that is consumed by the other one. In Fig. 2b, there is an edge between R1 and R2 because R1 produces D which is a substrate of R2. R5 is not linked to any other reaction node because its substrate (L) is not produced by any reaction and its product (C) is not used by any reaction.
In the enzyme graph, nodes correspond to enzymes. There is an edge between two enzymes if one catalyses at least one reaction that produces a metabolite which can be consumed by a reaction catalysed by the other one. In Fig. 2c, there is an edge between E3 and E1 since E3 catalyses R3 which produces I and I is a substrate of R4, catalysed by E1. One can observe that these graphs, even if modelling the same network, do not have the same topological properties, underlying the fact that it is necessary to take particular care when choosing the model to use.
Moreover modelling a metabolic network using one of these three graphs could lead to a loss of information. In fact, in Fig. 2a, an edge exists between A and C that could be interpreted as: C can be created using only A. Nevertheless, R1 requires both A and B to produce C. Two kinds of models can overcome this ambiguity: bipartite graphs and hypergraphs. In a bipartite graph, the set of nodes can be divided in two subsets. One kind of node can only be connected to another kind of node. In the case of metabolic networks one set of nodes corresponds to the metabolites and the other one to the reactions. As shown in Fig. 2d, it models the necessity of the availability of the two substrates (A and B) to activate the reaction and synthesize its products (C and D).
A hypergraph is a graph where edges (called hyperedges) can link more than one node. In a metabolic hypergraph, nodes correspond to metabolites and hyperedges link set of substrates and set of products of the same reaction (see Fig. 2e). All these kinds of graphs can be directed or not. In a directed graph, each edge has a direction. In an undirected graph, an edge has no direction, meaning that the connection between its extremities can go in both ways. When all the reactions are reversible, then the metabolic network can be modelled by an undirected graph. When all the reactions are irreversible, then the graph has to be directed. Most often, reversible and irreversible reactions coexist in a metabolic network. Then, the classical way to model such a network is to build a directed graph by splitting each reversible reaction into two reactions, one for each direction.
Graph filtering
The necessity of several substrates to activate a reaction in a metabolic network should require modelling it as a bipartite graph or a hypergraph. However, many concepts, well defined for simple graphs, have not been defined in hypergraphs or bipartite graphs. For instance, whereas the notion of path between two nodes is quite normal in simple graphs, the definition and the algorithms to compute them remain subjects of discussion when dealing with bipartite graphs and hypergraphs. Many studies about metabolic networks thus used a simple graph representation. Some of them lead to biological misinterpretations caused by artifactual links between nodes. In particular, compounds such as water or cofactors (e.g. ATP, NADH) are commonly involved in reactions and cause shortcuts without biological meaning when computing paths in a simple graph (Arita, Reference Arita2004).
Several automatic ways exist to filter the network to avoid these artifactual links. The first way is to remove from the metabolic network the most connected nodes as they often correspond to cofactors or to compounds (as water or protons) not actually involved in the main transformation of the reaction. Several problems are linked to this quite strong filter. The first one is that important metabolites that are also very connected, such as pyruvate, might be removed from the metabolic network. The second one is that an objective way to choose that a threshold does not exist, based either on its absolute connectivity or on its rank among the most connected metabolites, to decide if a metabolite has to be removed or not. Finally, some important metabolic processes (e.g. the formation of ATP) might disappear from the metabolic network (Lacroix et al. Reference Lacroix, Cottret, Thébault and Sagot2008). Another way is to break down each reaction into several sub-reactions corresponding to independent transformations in the reactions. For instance, it is easy to detect common cofactor transformations (as ATP→ADP+Pi) and to separate them from the rest of the reactions. More subtle methods split the reaction by computing the most probable exchanges of group atoms between subsets of substrates and products. In KEGG, such information is available in the RPAIR database (Oh et al. Reference Oh, Yamada, Hattori, Goto and Kanehisa2007).
Recently, methods based on graphs, either simple or not, have been designed especially to analyse metabolic networks. In the next section, we describe some of them and their use in the context of parasitology.
USE OF METABOLIC GRAPHS IN PARASITOLOGY
Therapeutic target identification
In this section we consider the reactions as potential therapeutic targets since generally drugs act on enzymes. The aim is to use the graph modelling to find reactions that can be considered as potential ‘weak’ points of the network since inhibiting one of them may have drastic metabolic effects. These reactions will also have to be specific to the parasite to avoid harming the host.
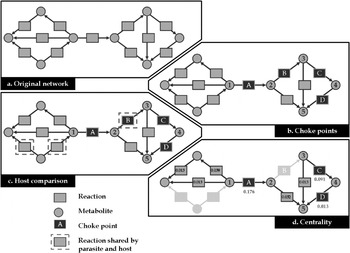
Yeh et al. (Reference Yeh, Hanekamp, Tsoka, Karp and Altman2004) introduced the notion of choke points which aims at finding potential drug targets based on the topological structure of the network. The idea is that accumulation or depletion of a particular metabolite can strongly, maybe lethally, affect the metabolism of a parasite. The formal definition of a choke point is as follows: a reaction which is the only one to consume (produce respectively) a metabolite. In fact the inhibition of a choke point results in the accumulation (starvation respectively) of a metabolite. For instance, in Fig. 3b reaction A is the only one to consume metabolite 1 and reaction B is the only one to produce metabolite 3.
The choke point analysis pipeline. Given an original network (a) it is possible to detect four choke points (reactions A, B, C and D of b). The enzymes catalysing these reactions are then compared using BLAST to the host metabolic network, the circled reactions are present both in the host and in the parasite (c), they should not be considered as relevant drug targets. The choke point B is thus discarded. Finally (d), the betweenness centrality is computed. Higher values (e.g. 0·176 for A) mean that many paths go through the reaction. It helps ordering the three remaining choke points: A (0·176), C (0·091) and D (0·013).

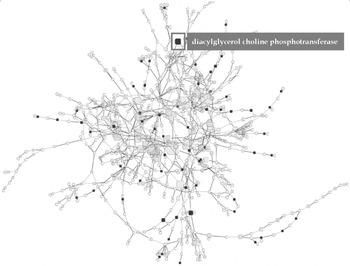
In their article, Yeh et al. (Reference Yeh, Hanekamp, Tsoka, Karp and Altman2004) computed all the choke points of Plasmodium falciparum. They identified 216 reactions that corresponded to the choke point definition. Among these reactions, 100% of the existing drug targets and 87·5% of the clinically proven targets were found. But this number is still too important to directly use this list of choke points. They proposed to filter this list by only keeping the enzymes not coded by the human genome. In 2007, Singh et al. followed the same idea with another parasite, Entamoeba histolytica. Rahman and Schomburg, (Reference Rahman and Schomburg2006) improved this approach by ranking the choke points by their centrality in the metabolic network. The centrality of a reaction can be measured as the proportion of shortest paths involving this reaction in the reaction graph. We applied this analysis pipeline on the metabolic graph of Trypanosoma brucei built from the metabolic information available in TrypanoCyc (Chukualim et al. Reference Chukualim, Peters, Fowler and Berriman2008). First, we identified 285 choke points over a total of 422 reactions involved in the small molecule metabolism of T. brucei. Then, we removed from this set all the reactions reported for Homo sapiens in HumanCyc (Romero et al. Reference Romero, Wagg, Green, Kaiser, Krummenacker and Karp2005). We thus obtained a list of 64 choke points in T. brucei that are not involved in H. sapiens. Finally, we computed the centrality as defined above. Interestingly, the most central choke point corresponds to the diacylglycerol choline phosphotransferase (see Fig. 4) and is involved in the synthesis of phospholipids in T. brucei. In parasites, this pathway is involved in specific processes such as host cell invasion, nutrient acquisition or host immune system modulation and was indicated as an interesting target for new drugs (Vial et al. Reference Vial, Eldin, Tielens and van Hellemond2003).
Complete metabolic network of Trypanosoma brucei. Choke points not present in the human metabolic network are highlighted in red and their size is proportional to their centrality in the network.

This quick analysis demonstrates the relevance of using a graph model of the whole network to help the parasitologists in the first steps of new drugs design.
Measure of the influence of metabolites on a metabolic network
In the context of parasitology, it is important to know how the metabolic network is affected by the import of some metabolites in the cell of the parasite. The imported metabolites can be products of the host metabolism or therapeutic drugs.
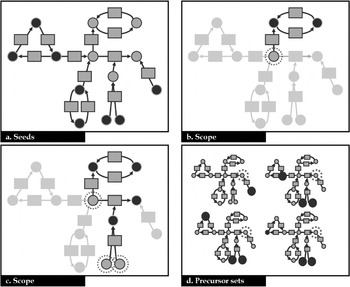
The topology of metabolic graphs gives information about the synthetic capacity of a set of metabolites. Handorf et al. (Reference Handorf, Ebenhöh and Heinrich2005) defined the scope of a set of metabolites (so-called inputs) as the sum of all metabolites that the inputs are able to produce using the reactions available in an organism. On the contrary, of shortest paths computed in simple graphs, the scope concept takes into account the availability of all the substrates to use a reaction (Fig. 5b,c). The scope is computed in an iterative way, called expansion process. At each step, the reactions using inputs are checked: if all the substrates are in the set of inputs, then they are activated (fired) and all their products join the set of inputs. The process stops when no additional reactions can be fired. The metabolites contained in the final set of inputs represent the scope of the initial set of inputs. Schwartz and Nacher (Reference Schwartz and Nacher2009) used the notion of scope to determine the sub-network affected by several drugs in the human metabolic network, and were able to classify them considering the extent of their scope.
Identification of seeds, scopes and precursors. The metabolic network is represented as a bipartite graph. (a) Identification of the seeds as defined by Borenstein et al. (Reference Borenstein, Kupiec, Feldman and Ruppin2008). The identified seeds are the black nodes. Each seed belongs to a strongly connected component without input edge in the graph. (b, c). Scope. The inputs are circled with dotted lines and the compounds produced during the scope are coloured in black. In (b), the initial input is only able to fire one reaction; all the substrates of the other reaction using it are not available. In (c), the extension of the input set makes available all the substrates of the second reaction and enables the extension of the scope. (d) Precursors. The target metabolite is circled with dotted lines, the potential precursors are the seeds defined in (a). Each graph represents an alternative precursor set of the target. Each seed involved in the precursor set is coloured in black.

Identification of the metabolic exchanges between the parasite and its host
The complete understanding of the parasite's metabolism requires knowledge of the metabolic exchanges between the parasite and its host. Indeed, the metabolism of the parasite depends on the availability of nutrients provided by the host. The set of nutrients used by the parasite (so-called sources) can be computed in an automatic way by considering them as all the metabolites not produced by any reaction. Because of the uncertainty about the metabolic reconstruction, in particular about the direction of the reactions, this definition is often not sufficient. The method proposed by Borenstein et al. (Reference Borenstein, Kupiec, Feldman and Ruppin2008) to find the set of sources (or seeds) is based on the identification of strongly connected components (sub-network such that it exists a path between any pair of nodes) that do not have incoming edge, forming a collection of candidate sources (Fig. 5a). Once the sources of the metabolites are defined, it is interesting next to know which subsets of them (so-called precursor sets) are sufficient to produce important metabolites (so-called target metabolites), such as those involved in vital or pathogenic functions in a parasite (Fig. 5d). Handorf and Ebenhöh (Reference Handorf and Ebenhöh2007) used the expansion process that they defined to test whether some precursor subsets heuristically defined are able to produce given target metabolites. However, this method does not return all the alternative precursor sets for a given set of targets and does not take into account the presence of cycles between the sources and the target metabolites. A method was recently developed to overcome these limitations (Cottret et al. Reference Cottret, Vieira Milreu, Acu na, Marchetti-Spaccamela, Viduani Martinez, Sagot and Stougie2008).
Metabolic networks for contextual analysis
Nikolsky et al. (Reference Nikolsky, Nikolskaya and Bugrim2005) suggest that biological interaction networks can be used as a universal data integration platform especially in drug discovery. Metabolic networks help to understand the link between gene products and metabolites, thus they can be used as a context for cross analysis, for instance to cross transcriptomics and metabolomics data. In a metabolomics study, not all the metabolites present in the network are identified. To understand the metabolic processes connecting the ones identified, it is useful to put them in the context of the complete metabolic network.
One way to map metabolomics data in metabolic networks consists of using the ultra-high resolution offered by new mass spectrometers (e.g. LTQ-Orbitrap). In this case the molecular weight is detected with sufficient resolution to get most of the time a unique formula for a mass. Tools like MassTRIX (Suhre and Schmitt-Kopplin, Reference Suhre and Schmitt-Kopplin2008) take advantage of this high resolution by mapping masses to metabolites. Thus, given a list of masses, it is possible to obtain a report showing metabolites identified in each KEGG pathway regarding the number of predicted metabolites for the organism under study. Once the experimentally detected metabolites are identified in the network, a first analysis can be done by investigating these data visually in the network context. Tools like KEGG or the omics viewer provide pathway oriented visualisations. But as discussed previously, pathway analysis implies a loss in the connectivity knowledge. Thus we will focus on network visualisation. A wide range of tools to visualise networks exists and some are particularly dedicated to the visualisation of biological networks (Shannon et al. Reference Shannon, Markiel, Ozier, Baliga, Wang, Ramage, Amin, Schwikowski and Ideker2003) even metabolic networks (Bourqui et al. Reference Bourqui, Cottret, Lacroix, Auber, Mary, Sagot and Jourdan2007). Drawing this kind of network in a relevant way is a computational challenge (Jünger and Mutzel, Reference Jünger and Mutzel2004). But a network view of metabolomics data will generally result in an overloaded view. Thus a relevant approach consists of extracting from this network the sub-network connecting the identified metabolites.
Sub-network extraction
A first approach consists of connecting two metabolites if they are output and input of a reaction. But the metabolites identified by metabolomics only represent a part of the complete metabolome and are generally linked through a sequence of reactions. It could be due to technical artefacts. For instance, metabolites with low masses will not be detected or the separation method will preferentially detect particular families of metabolites. Moreover, some metabolites are consumed almost immediately when they are produced. Thus the sub-network extraction method has to compute paths between metabolites.
An opposite solution would be to consider all the possible paths between the identified metabolites and then to merge them to build the sub-network. In that case, the size of the sub-network can be too large and, in the worst case, can reach the size of the original one. So the idea of Antonov et al. (Reference Antonov, Dietmann, Wong and Mewes2009) is to consider only the shortest paths between two identified metabolites. They consider the length of a path between two metabolites as the number of metabolites (gaps) that have to be produced to create one metabolite from the other. If the number of gaps is not limited then the sub-network can be large. Thus they build one sub-network for each number of allowed gaps until no new connection is made. For each sub-network associated to a given number of gaps, a P value is computed to indicate the statistical relevance of the extraction. This method was designed for compound graphs and, most importantly, they do not take into account the availability of all the substrates to incorporate a reaction in their path. Recently, we proposed an approach allowing only one gap but designed for bipartite graphs and taking into account availability of substrates to activate a reaction (Jourdan et al. Reference Jourdan, Cottret, Wildridge, Scheltema, Hillenweck, Barrett, Zalko, Watson and Debrauwer2010). These methods are quite useful for biological interpretation since they help the expert focus on relevant metabolic processes as they connect metabolites of interest. Moreover it provides feedback on the metabolomics data identification, for instance by proposing metabolites that appear with a too low abundance in mass spectra (Jourdan et al. Reference Jourdan, Cottret, Wildridge, Scheltema, Hillenweck, Barrett, Zalko, Watson and Debrauwer2010).
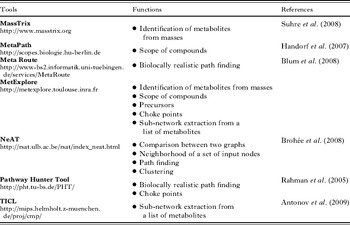
Table 3 presents a selection of web-servers providing graph functions to apply on metabolic networks.
Web-servers providing graph functions to apply on metabolic networks

DISCUSSION
Each step of metabolic reconstruction can generate mistakes that can propagate to the following ones (Lacroix et al. Reference Lacroix, Cottret, Thébault and Sagot2008). All these biases may create inconsistency in the results of the network analysis used. Great efforts have been made in bioinformatics to improve the quality at each level. Anyway the reconstruction is a cyclic process because feedback on analysis helps in new annotations of a network: metabolic reconstruction is a permanent curation process (Palsson, Reference Palsson2000).
Recently, Ginsburg (Reference Ginsburg2009) criticised the efficiency of automatic reconstruction methods for metabolic networks. In particular he focused on the prediction of metabolic pathways for eukaryotes. The author compares the metabolic pathways predicted for Plasmodium falciparum by different automatic methods and available on three different databases (BioCyc, KEGG and metaTIGER) to the manually defined list present in the “Malaria Parasite Metabolic Pathway” (MPMP) (Ginsburg, Reference Ginsburg2006). For each automatic method, around 25% of the metabolic pathways are present in MPMP. This study clearly shows that metabolic pathways present in an organism cannot be determined only by comparison of reference pathways. Ginsburg mentions false pathway predictions which could have been avoided by a manual curation as has been done in MPMP. Unfortunately, highly curated databases such as MPMP are available for only few organisms. Thus it is necessary, when using metabolic networks, to take this limitation into account. More than these prediction limitations, the organisation into metabolic pathways is different from one database to another. Thus to get a global unbiased view of the metabolism it is better to analyse the data at the network level. In fact, metabolic pathways are not independent and they share reactions and compounds. For instance, following a path spanning different pathways becomes difficult even in small metabolic networks (see Fig. 1).
According to the biological question, the modelling choice is a critical step in graph- based studies of metabolic networks. It is the case for the definition of biological entities associated nodes and edges but also for the filters that should be applied to the original network reconstruction. With a sufficiently curated reconstruction and a relevant modelling choice, we identified several examples showing that metabolic graphs can enhance global studies of parasite metabolism. From a computational point of view, we showed that drug target identification could be guided by studying the topology of the network. In particular, the choke points are relevant starting points for these studies. But they clearly benefit from the combination with other topological measures as centrality.
The metabolic graph facilitates the contextual analysis of experimental data such as metabolomics. This methodology is still a challenging problem that requires new algorithms. The first difficulty is to make the correspondences between masses or metabolites identifiers and nodes in the metabolic graphs. It is known that even with high resolution techniques, the mass alone is not sufficient to give an unambiguous identification (Kind and Fiehn, Reference Kind and Fiehn2006). Technical considerations, biological and chemical knowledge are commonly used to identify metabolites manually from metabolomics experiments. The development of freely available automatic methods taking into account clues other than mass is urgently required to allow interpretation of the metabolomics results. Even with metabolites already identified, the lack of common controlled vocabularies and ontologies makes difficult their mapping on a metabolic network. Confronting metabolites identified from metabolic experiments and metabolites present in metabolic networks built from genomic annotations allows the curation of both sources of information. The second difficulty with interpreting metabolomics studies by using metabolic networks as context is to extract sub-networks relevant enough to find the biological links between identified metabolites. Some recent methods using the graph topology have been developed (Antonov et al. Reference Antonov, Dietmann, Wong and Mewes2009; Jourdan et al. Reference Jourdan, Cottret, Wildridge, Scheltema, Hillenweck, Barrett, Zalko, Watson and Debrauwer2010). The integration in these methods of biological considerations such as the spent energy or the number of involved reactions, should improve the selection of pertinent scenarios that link identified metabolites.
All these graph-based methods provide a first insight on the metabolism of a parasite. They are quite useful since they only require the topology of the network and are particularly well suited even for genome-scale metabolic networks. The first conclusions drawn by these studies will then require a more in-depth analysis, for instance by using flux-based methods. All these results will be improved by gathering parasitology community knowledge and automatic methods to accelerate and strengthen the curation of these metabolic networks. In particular, stage and compartmental information are required to get better metabolic models.
FINANCIAL SUPPORT
This study was funded by SysTryp ANR-BBSRC grant.