INTRODUCTION
Legislative requirements to minimize the environmental impact of milk production systems significantly affect dairy farm management. In grassland-based systems, variation in N excretion in faeces and urine is large (Kebreab et al. Reference Kebreab, France, Mills, Allison and Dijkstra2002). Management options, including variation in fertilization level, grass cultivar and stage of maturity, may help increase the efficiency of N utilization (Ferris Reference Ferris2007). In recent years there has also been renewed interest in the emission of greenhouse gases from dairy farms. Under Dutch conditions, methane (CH4) emissions from cows and manure contributes on average about 0·5 of the total emission of carbon dioxide equivalents from on-farm activities with about 0·75 of this assumed to originate from enteric fermentation (Olesen et al. Reference Olesen, Schelde, Weiske, Weisbjerg, Asman and Djurhuus2006; Schils et al. Reference Schils, Verhagen, Aarts, Kuikman and Šebek2006). In surveys of greenhouse gas emissions, generally constant animal CH4 emission factors are used for grass forages. However, changes in grassland management may alter the chemical composition of fresh or ensiled grass, grass intake and digestion processes in the cow, thus affecting CH4 yield from enteric fermentation as well. The confounding of various simultaneous effects on rumen fermentation in particular seriously complicates estimation of the effect of management measures in practice.
Several empirical models have been published to predict enteric CH4 production (e.g. Moe & Tyrrell Reference Moe and Tyrrell1979; Yan et al. Reference Yan, Agnew, Gordon and Porter2000; Mills et al. Reference Mills, Kebreab, Yates, Crompton, Cammell, Dhanoa, Agnew and France2003; Hindrichsen et al. Reference Hindrichsen, Wettstein, Machmüller, Jörg and Kreuzer2005). These equations indicate a large effect of diet composition on enteric CH4 emission from dairy cattle. In a direct comparison between observed CH4 emission and predictions with an empirical equation, Hensen et al. (Reference Hensen, Groot, Van den Bulk, Vermeulen, Olesen and Schelde2006) established prediction errors equal to 0·3 to 1·0 of observed values. Although a substantial part of these errors probably has to be attributed to measurement inaccuracy, errors of this scale warrant substantial improvement in the method of CH4 prediction in whole farm surveys. Indeed, addressing the interactions between various feed characteristics and fermentation conditions on enteric CH4 yield benefits from a more mechanistic modelling approach (Benchaar et al. Reference Benchaar, Rivest, Pomar and Chiquette1998; Bannink et al. Reference Bannink, Dijkstra, Mills, Kebreab, France, Kuczynski, Dämmgen, Webb and Myczko2005; Kebreab et al. Reference Kebreab, France, McBride, Odongo, Bannink, Mills, Dijkstra, Kebreab, Dijkstra, Bannink, Gerrits and France2006; Ellis et al. Reference Ellis, Dijkstra, Kebreab, Bannink, Odongo, McBride and France2008). Benchaar et al. (Reference Benchaar, Rivest, Pomar and Chiquette1998) concluded that mechanistic models gave a better explanation of observed CH4 emission from cows than empirical regression models. Experimental observations on the effects of grass chemical composition on CH4 emission from dairy cattle are scarce, however.
The objective of the present study was to evaluate whether grass quality (as a result of N fertilization rate and stage of maturity) affects CH4 emission from dairy cows, using a modified version of a mechanistic model of enteric fermentation (Mills et al. Reference Mills, Dijkstra, Bannink, Cammell, Kebreab and France2001). The model was modified to include representation of the effect of rumen pH on molar proportions of volatile fatty acids (VFA) and CH4 produced in the rumen (Bannink et al. Reference Bannink, Dijkstra, Mills, Kebreab, France, Kuczynski, Dämmgen, Webb and Myczko2005, Reference Bannink, France, López, Gerrits, Kebreab, Tamminga and Dijkstra2008).
METHODS
Model representation
Mechanistic model
An adapted version of a mechanistic model developed by Mills et al. (Reference Mills, Dijkstra, Bannink, Cammell, Kebreab and France2001) was used, which represents the fermentative processes in the rumen and hindgut of dairy cows. The model contains a dynamic representation of the processes of feed degradation, VFA and ammonia absorption, microbial growth, and outflow from the rumen and intestines. Furthermore, intra-ruminal recycling of microbial matter as a result of predation by protozoa and N recycling via saliva and the gastrointestinal wall are represented. The model takes into account the effects of the dynamics of rumen fermentation conditions (available concentrations of substrates, micro-organisms and acids, pH, outflow rates of water and particles and rumen volume) on these processes (Dijkstra et al. Reference Dijkstra, Neal, Beever and France1992). The main inputs to the model are daily dry matter intake (DMI), soluble carbohydrates, starch, neutral detergent fibre (NDF), crude protein (CP) and fat, and fractional degradation characteristics of starch, NDF and CP established by in situ incubations.
The predecessor (Dijkstra et al. Reference Dijkstra, Neal, Beever and France1992) of the model of Mills et al. (Reference Mills, Dijkstra, Bannink, Cammell, Kebreab and France2001) was evaluated extensively against independent data (Neal et al. Reference Neal, Dijkstra and Gill1992; Bannink et al. Reference Bannink, De Visser, Klop, Dijkstra and France1997a, Reference Bannink, De Visser and Van Vuurenb) and was shown to be capable of predicting the main aspects of rumen function. Prediction of yield of individual types of VFA was unsatisfactory, however. This aspect of rumen fermentation is essential for accurate prediction of excess hydrogen, which is converted into CH4 by methanogens (Mills et al. Reference Mills, Dijkstra, Bannink, Cammell, Kebreab and France2001; Ellis et al. Reference Ellis, Dijkstra, Kebreab, Bannink, Odongo, McBride and France2008). For this reason, revised coefficients for VFA yields from fermented substrate were applied by Mills et al. (Reference Mills, Dijkstra, Bannink, Cammell, Kebreab and France2001). These VFA coefficients were fully described by Bannink et al. (Reference Bannink, Kogut, Dijkstra, France, Kebreab, Van Vuuren and Tamminga2006) applying a revised version of the method developed by Murphy et al. (Reference Murphy, Baldwin and Koong1982). A total of 20 coefficient values (combinations of four types of VFA and five types of fermented substrate) were fitted using VFA molar proportions observed in vivo in rumen fermentation trials with lactating cows covering a wide range of dietary treatments (182 dietary treatments). Different sets of VFA coefficients appeared necessary for diets mainly composed of roughages and diets mainly composed of concentrate. Compared to other representations published in the literature, predicted VFA yield was improved (Bannink & Tamminga Reference Bannink, Tamminga, Dijkstra, Forbes and France2005), though much variation remained unexplained.
VFA and CH4 yield
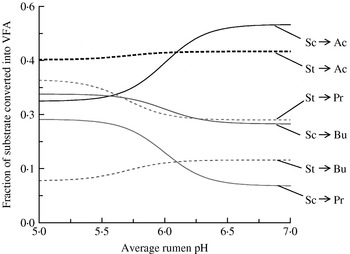
Earlier studies by Argyle & Baldwin (Reference Argyle and Baldwin1988) demonstrated the dependency between pH and VFA yields from sugars and starch. Kohn & Boston (Reference Kohn, Boston, McNamara, France and Beever2000) argued from a thermodynamic point of view that with increased rates of substrate fermentation the production of propionate becomes energetically more favourable at the expense of acetate production and methanogenesis. In their review on starch degradation, Mills et al. (Reference Mills, France and Dijkstra1999a) also indicated the negative relation between pH and propionate molar proportion. For this reason, Bannink et al. (Reference Bannink, France, López, Gerrits, Kebreab, Tamminga and Dijkstra2008) attempted to improve further prediction of VFA molar proportions and derived new VFA coefficient values by introducing pH-dependent VFA yield from fermented soluble carbohydrates and starch. Logistic equations were used to represent this pH dependency, with an inflexion point for soluble carbohydrates at pH 6·0 and for starch at pH 5·7, and with steepness parameters of 6·0 for both types of carbohydrate. The size of the effect of pH was fitted for soluble carbohydrates and starch separately and for each type of VFA (Fig. 1; Bannink et al. Reference Bannink, France, López, Gerrits, Kebreab, Tamminga and Dijkstra2008). Despite the inclusion of rumen pH as an additional explanatory factor in the regression model, a clear distinction remained between roughage-rich and concentrate-rich diets. The total residual sum of squares of fitted VFA molar proportions (expressed as mmol of a specific VFA/100 mmol total VFA), summed over both types of diets, decreased by 15%. It was assumed that the equations are a reasonable representation of the effect of pH and VFA concentrations on estimated VFA molar proportions in rumen fluid. Consequences of these regression results on predictions of CH4 yield will be discussed later. These newly derived equations were introduced into the model used in the present study, hence it is a modification of the model proposed by Mills et al. (Reference Mills, Dijkstra, Bannink, Cammell, Kebreab and France2001).
Fitted effect of rumen pH on the fraction of individual types of VFA (Ac, Pr, Bu for acetate, propionate and butyrate, respectively) produced from rapidly fermentable carbohydrates (Sc and St indicate soluble carbohydrates and starch, respectively). Derived from Bannink et al. (Reference Bannink, France, López, Gerrits, Kebreab, Tamminga and Dijkstra2008). Figure reproduced with kind permission of Elsevier.

Simulations
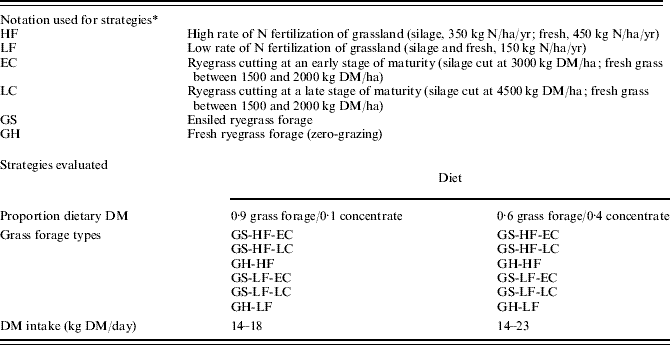
Simulations using the modified Mills et al. (Reference Mills, Dijkstra, Bannink, Cammell, Kebreab and France2001) model were performed for the different farm management scenarios listed in Table 1. First, different types of ryegrass quality as a result of N fertilization rate (high fertilization (HF) and low fertilization (LF)), stage of maturity (early cut (EC) and late cut (LC)) and harvesting method (fresh grass herbage (GH) and ensiled grass (grass silage (GS))) were tested. For all types of grass forage, diets were simulated which contained a concentrate proportion of 0·1 and a grass forage proportion of 0·9 in dietary dry matter (DM). The effects were simulated with either an equal DMI of 18 kg/day of various grass forages (resulting in a range of fat and protein corrected milk (FCM) yield, or with an equal FCM of 22·4 kg/day corresponding to the grass quality with lowest FCM simulated (resulting in a range of DMI that generates equal amounts of energy absorbed from the gastrointestinal tract, and assuming equal milk composition). GH was compared with GS under the assumption of zero-grazing conditions, hence leaving out the effects of cow activity on energy requirement and the effects of GH quality and GH availability on GH intake under grazing conditions. Fractional rates of outflow of particles and fluid from the rumen, fluid volume, average pH, minimum pH and the time period pH remains below 6·3 were assumed to be 1·07/day, 3·42/day, 80 litres, 6·1, 5·8 and 15 h, respectively, for all diets with a proportion of 0·9 of grass forage in dietary DM.
Notation and description of strategies evaluated
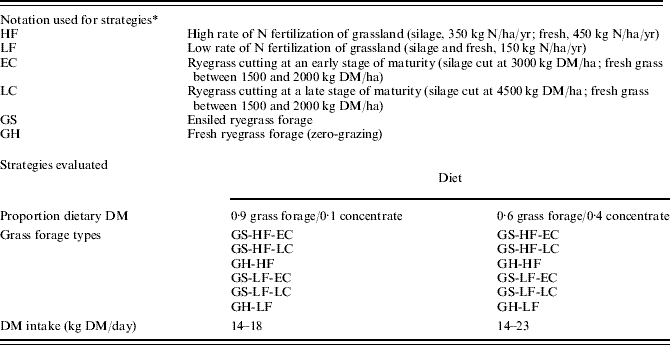
* GS strategies based on Reijs (Reference Reijs2007) and fresh grass strategies based on Valk et al. (Reference Valk, Kappers and Tamminga1996, Reference Valk, Leusink-Kappers and van Vuuren2000).
Secondly, the effects of increasing DMI were simulated for all types of grass forage. The DMI was increased from 14 to 18 kg/day (increment step size of 1 kg/day) with a proportion of 0·9 of grass forage and 0·1 of concentrates in dietary DM, or from 14 to 23 kg/day (increment step size of 3 kg/day) with a proportion of 0·6 of grass forage and 0·4 of concentrate in dietary DM. The highest levels of DMI (19–23 kg/day) with a proportion of 0·9 of grass forage were not simulated because this level is unlikely to be achieved (Tas et al. Reference Tas, Taweel, Smit, Elgersma, Dijkstra and Tamminga2005). Fractional outflow rates of particles and fluid from the rumen, fluid volume, average pH, minimum pH and the time period pH remains below 6·3, varied from 0·92/day, 3·17/day, 70 litres, 6·4, 6·1 and 10 h to 1·07/day, 3·42/day, 80 litres, 6·2, 5·9 and 14 h with increasing DMI for the diet containing a proportion of 0·9 of grass forage and 0·1 of concentrate in dietary DM, and from 0·92/day, 2·74/day, 70 litres, 6·3, 6·0 and 12 h to 1·47/day, 2·99/day, 85 litres, 6·0, 5·7 and 17 h for the diet with a proportion of 0·6 of grass forage and 0·4 of concentrate in dietary DM. Fractional outflow rates were based on empirical equations derived by Van Straalen (Reference Van Straalen1995) with a stronger effect of DMI on the fractional outflow rate of particulate matter in concentrates than in forages. The pH parameters were assumed to depend on DMI.
Similar fractional passage rates, volume and pH parameters were used for GS-HF-EC and GH-HF, and for GS-LF-EC and GH-LF, because both GS-EC and GH are highly digestible. Only for the diets with a proportion of 0·4 of concentrate in dietary DM, upon a change from EC to LC and a change from HF to LF, the average pH and minimum pH were increased by 0·1 and the time period of pH below 6·3 was decreased by 2 h; for all diets fractional outflow rates of particles and fluid were reduced by 0·1/day. Maximum values of average pH of 6·5 and of minimum pH of 6·2 were assumed, in combination with a minimum time period of pH below 6·3 of 8 h.
Grass quality and grass ensiling
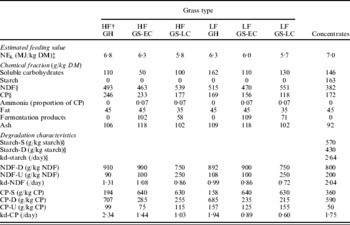
Differences in the quality of GH and GS were assumed to be caused either by rate of applied N fertilization, stage of maturity of grass harvested and choice between conservation and feeding herbage. Grass composition and degradation characteristics were estimated from previous trials and representative data in the literature for GH (Valk et al. Reference Valk, Kappers and Tamminga1996, Reference Valk, Leusink-Kappers and van Vuuren2000) and GS (Reijs Reference Reijs2007). Average values were used for chemical composition and degradation characteristics of concentrates (Reijs Reference Reijs2007). Table 2 contains a summary of the assumptions made for the range of forage qualities evaluated. The sensitivity of estimated CH4 emission to these values was simulated.
Summary of chemical contentFootnote *, degradation characteristics and feeding value assumed for different qualities of ryegrass herbage, ryegrass silage (GS) and concentrates

* The fraction of OM minus soluble carbohydrates, starch, NDF, CP which remained undetermined was attributed the proportion of 0·5; NDF was also attributed the proportion of 0·5.
† GS, grass silage; GH, grass herbage; HF, high rate of N fertilization; LF, low rate of N fertilization; EC, cut at early stage of maturity; LC, cut at late stage of maturity. For GS and GH, estimates were derived from Reijs (Reference Reijs2007) and Valk et al. (Reference Valk, Kappers and Tamminga1996, Reference Valk, Leusink-Kappers and van Vuuren2000), respectively. Contents and characteristics of concentrates were derived from Reijs (Reference Reijs2007).
‡ Net energy of lactation according to Dutch energy evaluation system (Van Es Reference Van Es1978; CVB 2005).
§ NDF, neutral detergent fibre; CP, crude protein, total CP calculated from total N content, including ammonia-N; S, D and U, the washable, the potentially degradable and the undegradable fraction of substrate with in situ incubations; kd, the fraction rate of degradation of the potentially degradable fraction with in situ incubations.
Further assumption
In comparing different types of grass forage with respect to simulated CH4 emission per unit of milk produced, milk yield needed to be simulated as well. Milk yield was calculated as the FCM allowed according to the net energy requirements for lactation (NEL) (Van Es Reference Van Es1978). A dairy cow of 650 kg body weight was assumed throughout the whole study. Exploring consequences of stage of lactation and changes in energy balance (weight changes) on CH4 emission were beyond the scope of the present study.
Model evaluations
Indirect calorimetry trials
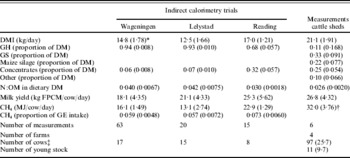
Model predictions of CH4 yield were evaluated against independent measurements of CH4 emission in cows consuming diets based mainly on GH (a proportion of around 0·05 of concentrate in dietary DM) by indirect calorimetry methods. Data from the research facilities in Lelystad and Wageningen (the Netherlands) were used and were described in detail by Bruinenberg et al. (Reference Bruinenberg, Van der Honing, Agnew, Yan, van Vuuren and Valk2002). A total of 83 measurements on individual cows (63 from Wageningen; 20 from Lelystad) were categorized according to N content of organic matter (OM), resulting in five classes (between a proportion of N of 0·030 and 0·035, between 0·035 and 0·040, between 0·040 and 0·045, between 0·045 and 0·050, and more than 0·050). This means that this part of the evaluation is limited to grass forage with a high fraction of CP in dietary DM of more than 0·165. Average values were calculated for these classes which resulted in five values for Wageningen and four values for Lelystad. In addition, 15 measurements were available from the Reading (UK) indirect calorimetry facility for cows consuming GH and 5·2 kg DM/day of concentrates which accounted for roughly one-third of dietary DM (Mills et al. Reference Mills, Dijkstra, Bannink, Cammell, Kebreab and France2001). Averages were calculated for type of grass sward and for measurement year, which yielded an additional four values. All diets are summarized in Table 3. Where details of composition and digestibility were missing, these were estimated from available information on feeding value, digestibility and N content (Valk et al. Reference Valk, Kappers and Tamminga1996; Reijs Reference Reijs2007). Estimates of the effects of N content on GH characteristics were derived by linear interpolation according to the values given in Table 2. Similar estimates were used for fractional passage rates, rumen fluid volume and pH parameters as those described above for the simulation studies, depending on DMI.
Summary of data used for model evaluation in the present study

* s.d. between parentheses.
† Including CH4 emission from young stock, dry cows and lactating cows and from manure storage, expressed per cow present.
‡ Number of individual cows used in calorimetry trials, or total number of dry and lactating cows stalled in cattle sheds.
DM, dry matter.
Practical cases
In addition to data from indirect calorimetry trials, model predictions were evaluated against measurements of total CH4 emission in cattle sheds under practical circumstances within the Dutch ‘Cows and Opportunities’ project, which aimed to improve mineral management (Oenema et al. Reference Oenema, Koskamp and Galama2001). Measurements of CH4 were part of a monitoring study to quantify ammonia emission in naturally ventilated cattle sheds and included CH4 from lactating cows, dry cows, young stock and stored slurry (Smits & Huis in ‘t Veld Reference Smits, Huis in ‘t Veld, Monteny and Hartung2007). Emissions were measured on one or two consecutive days per measurement period. Selection of cattle sheds was based on the criteria of stall-feeding and a small number of young stock present, in order to exclude as much as possible the variation introduced by the opening of stall-doors and temporary grazing outside, and to have representative data for the dairy herd. Furthermore, measurements were performed under normal circumstances with filled manure storages. There was no manure handling or emptying of storages preceding the CH4 measurements. The carbon dioxide (CO2) mass balance method was applied to quantify ventilation rates. The total animal production of carbon dioxide was estimated according to CIGR (Van Ouwerkerk & Pedersen Reference Van Ouwerkerk and Pedersen1994; Pedersen et al. Reference Pedersen, Takai, Johnsen, Metz, Groot Koerkamp, Uenk, Phillips, Holden, Sneath, Short, White, Hartung, Seedorf, Schröder, Linkert and Wathes1998). Air near the ventilation output was sampled continuously and collected for 18–24 h at a constant flow. The CO2 and CH4 concentrations in the collected air sample for one day were analysed using a GC-MS in the laboratory. Emissions of CH4 were calculated from quantified ventilation rates and assuming ratios of the measured concentrations of CO2:CH4 were equal to the ratios of their source strengths (mass fluxes reflecting emission rates). In total, four farms were monitored and two farms had two independent measurements. Data were available for the number of cows and young stock present, the type and amount of feed ingested and milk production. Because of the varying dietary composition on individual farms and since almost all young stock were older than one year, it was assumed that individual young stock contributed half of the CH4 emission rate calculated for each cow. In general, cow diets on the farms contained less grass forage, and milk production and feed intake level were substantially higher, than in the indirect calorimetry trials.
RESULTS AND DISCUSSION
Applicability of VFA coefficients
Along with amount of OM fermented and efficiency of microbial growth, type of VFA produced is the main determinant of hydrogen balance and methanogenesis. For this reason, attention is given here to the applicability of the representation of VFA yield. The representation used in the present study is illustrated in Fig. 1. The consequences of this representation for predicted CH4 yield have been discussed previously (Bannink et al. Reference Bannink, Dijkstra, Mills, Kebreab, France, Kuczynski, Dämmgen, Webb and Myczko2005, Reference Bannink, Kogut, Dijkstra, France, Kebreab, Van Vuuren and Tamminga2006; Kebreab et al. Reference Kebreab, France, McBride, Odongo, Bannink, Mills, Dijkstra, Kebreab, Dijkstra, Bannink, Gerrits and France2006) and are indicated in Fig. 2 (Dijkstra et al. Reference Dijkstra, Bannink, France, Kebreab, Meng, Ren and Cao2007). The results correspond with the effect of source of rumen digested carbohydrate on CH4 emission established recently by Hindrichsen et al. (Reference Hindrichsen, Wettstein, Machmüller, Jörg and Kreuzer2005) in lactating cows in vivo.
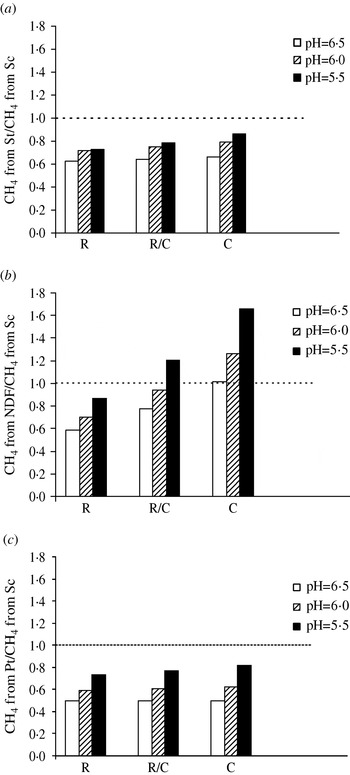
Effect of rumen pH (6·5, 6·0 or 5·5) and type of diet (R, R/C and C for a proportion of forage in dietary DM higher than 0·55, between 0·40 and 0·55, and less than 0·4, respectively) on the relative amount of CH4 formed from (a) fermented starch (St), (b) NDF and (c) protein (Pt). Amounts expressed relative to the amount formed from fermented soluble carbohydrate (Sc). Figure adapted from results presented by Dijkstra et al. (Reference Dijkstra, Bannink, France, Kebreab, Meng, Ren and Cao2007).

The CH4 yield from starch converted into VFA relative to that from soluble carbohydrates varies between 0·6 at pH 6·5 and 0·8 at pH 5·5 (Fig. 2a), whereas Hindrichsen et al. (Reference Hindrichsen, Wettstein, Machmüller, Jörg and Kreuzer2005) established 0·4 from the amounts digested with a 0·5 proportion of roughage in dietary DM. Not all starch is fermented in the rumen, whereas soluble carbohydrates are almost completely fermented. On the assumption that on average a third of ingested starch by-passes rumen fermentation (Mills et al. Reference Mills, France and Dijkstra1999b) and does not contribute to CH4 yield, the relative value of 0·4 for the results of Hindrichsen et al. (Reference Hindrichsen, Wettstein, Machmüller, Jörg and Kreuzer2005) can be corrected to 0·6, which is similar to the value at high pH adopted in the present study. Also for digestion of fibre, or NDF, the results are comparable. Digestion of NDF must be completely attributed to microbial fermentation, and a similar correction as discussed for starch does not apply here. In the current study, the relative CH4 yield from NDF compared to that from soluble carbohydrates converted into VFA varies between 0·6 at pH 6·5 and 0·9 at pH 5·5 for forage-rich diets, and between 1·0 and 1·6, respectively, for concentrate-rich diets (Fig. 2b).
In addition, Hindrichsen et al. (Reference Hindrichsen, Wettstein, Machmüller, Jörg and Kreuzer2005) discussed extensively the effect of pH on relative CH4 formation from sugars and from fibre. With a drop in pH the fermentation products from sugars shift from a relative large amount of butyric acid to a large amount of propionic acid. Hindrichsen et al. (Reference Hindrichsen, Wettstein, Machmüller, Jörg and Kreuzer2005) therefore argued that the much more pronounced CH4 production from sugars compared with fibre would only occur at higher pH values. Such an effect of pH on the shift in VFA molar proportions and, consequently, on the ratio of CH4 produced from sugars v. fibre is confirmed by the results of the present study (Fig. 1). Hindrichsen et al. (Reference Hindrichsen, Wettstein, Machmüller, Jörg and Kreuzer2005) did not measure rumen pH. Given the moderate DMI levels of 14–17 kg/day of the diets with a 0·5 proportion of roughage and a 0·5 proportion of concentrate, and the high fibre content of the concentrate in Hindrichsen et al. (Reference Hindrichsen, Wettstein, Machmüller, Jörg and Kreuzer2005), average rumen pH is expected to have been well above 6·0, and therefore a pronounced higher amount of CH4 produced from sugars compared with that from NDF is expected, which is in line with the results of our modelling. The average in the current study of a proportion of 0·8 for CH4 from NDF compared to CH4 from sugars for a diet with a 0·5 proportion of forage and a 0·5 proportion of concentrate at high rumen pH (Fig. 2b), compares with the value of 0·7 as an average for CH4 from digested hemi-cellulose and cellulose compared to CH4 sugars derived by Hindrichsen et al. (Reference Hindrichsen, Wettstein, Machmüller, Jörg and Kreuzer2005). The representation adopted in the present study differs from that of Hindrichsen et al. (Reference Hindrichsen, Wettstein, Machmüller, Jörg and Kreuzer2005) in that it takes into account diet type (based on fraction of concentrates in dietary DM) and the effect of rumen pH on VFA yield. Furthermore, it is based on a much wider range of dietary treatments and on in vivo measurements of rumen digestion instead of whole-tract digestion.
Other in vivo findings indicate the need to include the effect of type of carbohydrate fermented and the effect of changes in fermentation conditions associated with changes in rumen pH on the type of VFA produced. In a study by Hristov et al. (Reference Hristov, Ropp, Grandeen, Abedi, Etter, Melgar and Foley2005) an alfalfa hay diet for lactating cows was supplemented to a proportion of 0·2 of DM with maize dextrose or maize starch, and oat fibre. With maize dextrose supplementation the molar proportion of acetate was reduced by 8 mmol acetate/100 mmol VFA (61 and 69, respectively), that of propionate hardly changed (18 and 17 mmol propionate/100 mmol VFA, respectively), and that of butyrate increased by 7 mmol butyrate/100 mmol VFA (18 and 11, respectively). These changes, however, were associated with a decline in pH (6·0 and 6·2, respectively, compared to 6·4 when oat NDF was added). These results are in line with the modelling results (Fig. 1) which indicate that a drop in pH to 6·0 with glucose fermentation results in a strong decrease in acetate yield (getting similar to, or even less than acetate yield from starch), in a strong increase in propionate yield (getting close to propionate yield from starch) and in an increase in butyrate yield (getting higher and more divergent from butyrate yield from starch). At pH 6·2 with starch supplementation, VFA yield is relatively insensitive to changes in pH. Hence, it appears that results such as those of Hristov et al. (Reference Hristov, Ropp, Grandeen, Abedi, Etter, Melgar and Foley2005) are explainable by accounting for the type of carbohydrate fermented as well as the change in fermentation conditions associated with changes in pH.
Predicted molar proportions (0·62, 0·23 and 0·12 for acetate, propionate and butyrate, respectively, with 18 kg DMI and a proportion of GH of 0·9) in the present study are consistent with those reported for diets composed mainly of GH (Van Vuuren et al. Reference Van Vuuren, Krol-Kramer, Van der Lee and Corbijn1992; Taweel et al. Reference Taweel, Tas, Smit, Elgersma, Dijkstra and Tamminga2005; Abrahamse et al. Reference Abrahamse, Dijkstra, Vlaeminck and Tamminga2008, Reference Abrahamse, Tamminga and Dijkstra2009). Within studies, observed effects of GS harvested at different stages of maturity on butyrate and propionate molar proportion are generally less than two percentage units. Such a small variation was also apparent in the present simulation study. However, between studies there appear to be large differences which remain hard to explain. Bosch et al. (Reference Bosch, Tamminga, Post, Leffering and Muylaert1992) reported lower molar proportions of propionate (0·17) and butyrate (0·11) than simulated in the present study, whereas Rinne et al. (Reference Rinne, Huhtanen and Jaakkola2002) also found less propionate (0·16) but more butyrate (0·15). Although GSs of varying quality were the main dietary component in both studies, other factors such as DMI, rumen pH, type of carbohydrate fermented and fractional rate of VFA absorption may have caused these differences. All these factors were taken into account, however, when deriving the representation of VFA and CH4 yield which was adopted in the present study.
Effect of forage quality
Effects of type and quality of grass forage
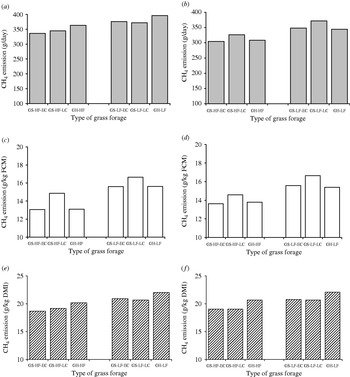
With a fixed DMI of 18 kg DM/day and a 0·9 proportion of grass forage and a 0·1 proportion of concentrate in dietary DM, the absolute rate of CH4 emission in g/day within fertilization treatment was simulated to be highest for GH and lowest for GS-EC and GS-LC with an absolute difference of 8 and 7% under the HF and LF regimes, respectively (Fig. 3a). However, the ranking of grass forages according to their potential to yield CH4 changes when CH4 is expressed per unit of FCM produced (Fig. 3c). In this case, the values for GS-LC were 14 and 7% higher than the lowest values for GS-EC with the HF and LF regimes, respectively. This means that although in absolute terms most CH4 is generated from GH, this is compensated by its higher energetic value to the dairy cow which results in higher FCM yield and similar and lower CH4 yield per unit of milk produced compared to GS-EC and GS-LC, respectively.
Effects of N fertilization rate (HF, high fertilization; LF, low fertilization) and harvesting management (GS, grass silage; EC, early cut; LC, late cut; GH, grass herbage) on predicted CH4 emission (g/day, (a) and (b); g/kg FCM (c) and (d); or g/kg DMI (e) and (f)) in cows consuming 18 kg of DM/day (a), (c) and (e), or producing 22·4 kg FCM/day (b), (d) and (f) equal to the lowest predicted FCM at a DMI of 18 kg/day with GS-LC under the LF regime. The proportion of concentrates in dietary DM was 0·1 for all diets tested.

With a fixed amount of energy available for milk synthesis (equal to FCM yield of 22·4 kg FCM/day) the ranking between grass forages changed for g CH4/day (Fig. 3b) but remained similar for g CH4/kg FCM (Fig. 3d). In this case, differences between grass forages in g CH4/kg FCM reflect their potential to yield CH4 at equal FCM yield. Predicted CH4 emission in g CH4/kg FCM for GS-LC remained 7 and 8% higher compared to the lowest values for GS-EC on the HF and GH on the LF regime, respectively, caused by the differences in DMI, chemical composition and degradation characteristics. However, as indicated above, with a fixed DMI of 18 kg DM/day (Fig. 3a) it was 14 and 7% higher, respectively. This indicates that under the HF regime the main part of the differences among grass forages in g CH4/kg FCM has to be attributed to variable contribution to metabolizable energy. This was less the case under the LF regime.
Surveys on CH4 emission often adopt the unit g CH4/kg DM consumed. With equal DMI, this delivers the same differences between grass forages (Fig. 3e) as the absolute CH4 emission rate (Fig. 3a). But, when compared at equal FCM, the results reflect a combined effect of differences in absolute rate of CH4 emission as well as the energetic value of dietary DM. This led to a different ranking with 8 and 7% higher values for GH than for GS-EC and GS-LC under the HF and LF regimes, respectively (Fig. 3f) compared to the ranking of absolute CH4 emission rates (Fig. 3b).
Comparing the HF and LF regimes indicates that a reduction in N fertilization rate strongly increased CH4 emission when expressed in either g CH4/day, g CH4/kg FCM or g CH4/kg DM. With a diet with a proportion of 0·9 of GS-EC, GS-LC or GH in dietary DM at equal DMI of 18 kg DM/day (Fig. 3a), these emissions increased by 12, 8 and 9% when expressed in g CH4/day (or in g CH4/kg DM), respectively, and increased by 20, 12 and 19% when expressed in g CH4/kg FCM (Fig. 3c). Consequently, increase of g CH4/kg FCM is a combined effect of differences in chemical composition of dietary DM and rumen degradation characteristics (Table 2), as well as FCM yield. At equal FCM yield, similar increases were predicted but of a smaller size for GS-EC and GH (14, 14 and 12% when expressed g CH4/kg FCM, Fig. 3d; 9, 8 and 7% when expressed in g CH4/kg DM, Fig. 3f).
Comparing GS-EC and GS-LC indicates that cutting at a later stage of maturity also increased CH4 emission. At equal DMI, the emission expressed in g CH4/kg FCM due to later cutting increased by 14 and 7% under the HF and LF regimes respectively (Fig. 3c). Predicted increase at equal FCM was 7 and 7%, respectively (Fig. 3d). This indicates that the effect of stage of maturity on CH4 emission is less pronounced than that of N fertilization rate. The choice between GS-EC and GH seems to have less impact than N fertilization rate and stage of cutting under the assumptions of the present study. When expressed in g CH4/kg FCM and comparing at equal DMI, values were almost the same under the HF and LF regime (Fig. 3c). At equal FCM, emissions were just 1% higher and 1% lower, respectively.
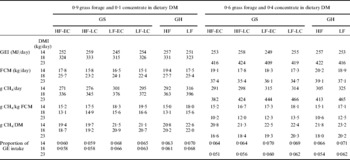
The simulation results suggest that the impact of rate of N fertilization (HF v. LF), of the stage of maturity of grass consumed (EC v. LC) and the choice between fresh herbage or ensiled grass (GH v. GS) may all be relevant in estimating CH4 emission rate with grass-based diets. Large differences among the various forage types were established. There was a maximum difference in g CH4/kg FCM between GS-HF-EC and GS-LF-LC of 27% with equal DMI at 18 kg DM intake/day (Fig. 3c), and of 22% with equal FCM of 22·4 kg FCM/day (Fig. 3d). For a proportion of 0·1 of concentrate in dietary DM, a maximum difference of 30% was established at the lowest DMI of 14 kg DM/day, whereas for a proportion of 0·4 of concentrate in dietary DM the difference was 32% at the highest DMI of 23 kg DM/day (Table 4). The simulations also indicate that the assumption of a fixed amount of CH4 energy per unit gross energy intake (GEI) is not valid. However, a proportion of 0·06 of GEI is assumed to be emitted as CH4 energy according to IPCC (1996). Over the range of simulations in Table 4, CH4 energy varied between 0·051 and 0·071 of GEI. Such large differences only apply, however, for the extreme ranges in grass quality compared in the present study. More subtle differences in N fertilization rate and grass harvesting management may lead to smaller differences and less distinct results. Moreover, some other factors were not considered in the present study, such as species heterogeneity in grass swards and its effect on composition and degradation characteristics, grazing management and energy expenditure of cows during grazing. Further, in the preceding discussion GSs and GH were compared at equal DMI, but grass quality must be expected to affect grass intake as well. This means that a higher DMI may be achieved with HF and EC than with LF and LC. Recognition of such differences in DMI will inflate the differences in CH4/kg FCM between GS-HF-EC and GS-LF-LC (Fig. 4; discussed in next section). It further became clear that the units used to express CH4 emission rate strongly affect the relative value for various grass forage types. With equal DMI different results for g CH4/day (or g CH4/kg DM) and g CH4/kg FCM must be expected, and with equal FCM different results for g CH4/day (or g CH4/kg FCM) and g CH4/kg DM (Fig. 3).
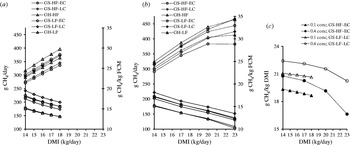
Effects of N fertilization rate (HF, high fertilization; LF, low fertilization) and harvesting management (GS, grass silage; EC, early cut; LC, late cut; GH, grass herbage) on predicted CH4 emission (in g/day on left y-axis, dashed lines, and in g/kg FCM on right y-axis, solid lines) in cows consuming (a) a diet with a proportion of 0·9 of grass forage and 0·1 of concentrate in dietary DM with DMI varying from 14 to 18 kg/day, and (b) a diet with a proportion of 0·6 of grass forage and 0·4 of concentrate in dietary DM with DMI varying from 14 to 23 kg/day. Results of (b) were also expressed in g/kg DMI (c) with closed symbols for a proportion of 0·9 of grass forage and 0·1 of concentrate in dietary DM, and open symbols for a proportion of 0·6 of grass forage and 0·4 of concentrate in dietary DM, and with (▵) for GS-HF-EC and (○) GH-LF which differed most.

Simulation results for methane emission from cows under various feeding regimes with diets containing various types of grass forageFootnote *

* HF, High rate of N fertilization of grassland (silage, 350 kg N/ha/yr; fresh, 450 kg N/ha/yr); LF, low rate of N fertilization of grassland (silage and fresh, 150 kg N/ha/yr); EC, ryegrass cut at an early stage of maturity (silage cut at 3000 kg DM/ha; fresh grass between 1500 and 2000 kg DM/ha); LC, ryegrass cut at a late stage of maturity (silage cut at 4500 kg DM/ha; fresh grass between 1500 and 2000 kg DM/ha); GS, ensiled ryegrass forage; GH, fresh ryegrass forage (zero-grazing); FCM, fat corrected milk; DM, dry matter; GE, gross energy.
From these simulations, it can be concluded that emission of CH4 by cows depends strongly on the type and quality of grass forage. The current modelling exercise identifies various nutritional factors that elucidate these effects, i.e. chemical composition, degradation characteristics, molar proportions of VFA formed, the amount of net energy for lactation and FCM yield. A realistic analysis therefore requires attention is given to the mechanisms responsible for interactions between these factors and for their effects on enteric CH4 formation. Various whole farm models aimed at estimating environmental impact of dairy farming adopt fixed CH4 emission factors (e.g. estimate of CH4 energy as 0·06 of GEI; IPCC, 1996; fixed 27 g CH4/kg grass DM; Schils et al. Reference Schils, Verhagen, Aarts, Kuikman and Šebek2006). The simulations also suggest that use of fixed CH4 emission factors for all types and qualities of GH, expressed as absolute amounts (g CH4/day), as a fraction of GEI, or relative to DMI or FCM level, may introduce substantial error into inventories of greenhouse gas emission and lead to incorrect mitigation recommendations.
Effect of DMI
In addition to the effects of grass type and grass management, the effects of varying DMI on CH4 emission were simulated (Table 4; Fig. 4). An increase in DMI of a diet with a proportion of 0·9 of grass forage in dietary DM from 14 to 18 kg/day resulted in an almost linear increase in g CH4/day. When expressed in g/kg FCM, the decline was curvilinear and varied from 13 to 15% for the different forage types (Fig. 4a). Differences between GS and GH, between EC and LC and between HF and LF, discussed in the previous section for 18 kg of DMI, remained for the whole range of DMI tested. Effect of DMI on predicted CH4 emission per unit FCM was curvilinear with the fastest rate of decrease at the lowest DMI of 14 kg/day. With a proportion of concentrate of 0·1 only in dietary DM, the effect of DMI remained smaller than that of grass forage type. Under the HF as well as the LF regime, predicted values increased in the order GH, GS-EC and GS-LC.
The average value over all forage types and DMI levels tested was 15·9 and 14·2 g CH4/kg FCM with a proportion of 0·1 and 0·4 of concentrate in dietary DM, respectively (with a range from 10·2 to 19·5; Table 4). Average values for g CH4/kg DM were 20·6 and 20·8 g CH4/kg DM, respectively (ranging from 16·6 to 23·2; Table 4), with CH4 energy accounting for on average 0·063 and 0·064 of GEI, respectively (ranging from 0·051 to 0·071; Table 4). Regardless of units, the simulation results clearly indicate that estimates of CH4 emission vary with level of DMI and FCM. For diets with a proportion of 0·4 of concentrate in dietary DM (Fig. 4b) and an increase of DMI from 14 to 23 kg DM/day, the decline in g CH4 emission/kg FCM varied from 26 to 33% with GS-LF-LC and GS-HF-EC, respectively. The accompanying decline in g CH4/kg DM (Fig. 4b) or in CH4 energy as a proportion of GEI varied from 10 to 20%, respectively. The lowest values of 10·2 g CH4/kg FCM, 16·6 g CH4/kg DM and 0·051 of GEI were established at the highest DMI of 23 kg DM/day of the diet with a proportion of 0·4 of concentrate in dietary DM under the GS-EC-HF regime.
Higher DMI levels are usually associated with decreased CH4 emission per kg of DMI (e.g. Holter & Young Reference Holter and Young1992; Yan et al. Reference Yan, Agnew, Gordon and Porter2000). The present study indicates that such empirically established effects need not have general applicability with respect to prediction of the consequences of feeding strategy on CH4 emission. An important factor that needs to be taken into account as well is the quality of the forage, which had more effect on CH4 emission than DMI over the range evaluated in the present study. A further factor that is strongly confounded with DMI in data sets from various trials reported in the literature is the proportion of concentrates in dietary DM as a reflection of the type of diet involved. Empirical relationships derived from such data sets normally do not include both DMI and proportion of concentrates as independent explanatory variables. However, our modelling results clearly indicated the need to vary predicted yield of VFA and CH4 from fermented substrates with varying proportion of concentrates in dietary DM (Fig. 2). These effects are discussed further in the next section.
Effect of proportion of concentrate in DMI
To evaluate the effect of a higher DMI in combination with a higher proportion of concentrates in the diet, the proportion of concentrate in grass-based diets was changed from 0·1 to 0·4 of dietary DM. With increase in proportion of concentrates, the predicted differences between forage types became much smaller (Fig. 4b v. Fig. 4a; expressed in either g CH4/day, g CH4/kg FCM or g CH4/kg DM, or as a proportion of GEI; Table 4). When expressed in g CH4/kg FCM, a distinct decline was established with an increase of DMI from 14 to 23 kg/day. In correspondence with the literature (Holter & Young Reference Holter and Young1992; Yan et al. Reference Yan, Agnew, Gordon and Porter2000), lower CH4 emission was predicted from concentrates. At an equal DMI of 14 kg/day, the predicted values were 3–6% lower compared to those obtained with a proportion of 0·1 of concentrate in dietary DM, except for grass forages of highest quality (GS-EC and GH under the HF regime; Table 4). In the present study, the effect remained rather small, however, as a result of the assumption of a relatively high and low content of soluble carbohydrates and starch in concentrates DM, respectively. Assuming a higher starch content, for example, would have reduced CH4 further without compromising FCM. At DMI of 23 kg/day, predicted values (g CH4/kg FCM) for all grass forage types were much lower than those found with a proportion of 0·1 of concentrate at 18 kg DMI/day (Fig. 4b v. Fig. 4a; Table 4). The main part of this effect was caused by higher DMI and not as much by lower CH4 emission from concentrates compared to grass forage.
Implications
The interpretation of the present results strongly depends on the assumptions made for chemical composition of grass forages and concentrates, for degradation characteristics, for fractional passage rates and for rumen acidity. Besides rumen degradability, type of carbohydrates in concentrates will also affect the VFA profile and consequently CH4 emission. The assumptions made about this in the model used in the present study are supported by several empirical equations published in literature which take into account type of carbohydrate fermented (e.g. Moe & Tyrrell Reference Moe and Tyrrell1979; Mills et al. Reference Mills, Kebreab, Yates, Crompton, Cammell, Dhanoa, Agnew and France2003; Hindrichsen et al. Reference Hindrichsen, Wettstein, Machmüller, Jörg and Kreuzer2005) instead of general measures such as proportion of concentrates in dietary DM. In addition to starch and soluble carbohydrates, however, protein fermentation and content of fermentation products as a result of ensiling need to be included in these types of analysis which seems to have gone unnoticed in the literature. Although outcomes in CH4 emission from concentrates as compared to those from forages probably cannot be seen as generally applicable for the reasons discussed in the previous section, comparative outcomes for the various types and qualities of grass forage probably can.
The present simulation results strongly suggest that CH4 emission in cows varies with type of grass forage fed and with grassland management, with DMI, with amount and type of fermentable carbohydrate and protein available for microbial utilization in the rumen, and with rumen fermentation conditions. The lower the proportion of concentrates in dietary DM, the larger the relative importance of the differences between grass forage types. Although this importance becomes smaller with high proportions of concentrate, it appears that the effects remain relevant. With a proportion of 0·4 of concentrate in dietary DM, the maximum difference established between the various grass forage types was 28–45% in g CH4/kg FCM for all levels of DMI evaluated (Table 4). In conclusion, all these aspects need to be considered when evaluating the effects of nutritional strategies on CH4 emission in cows. There seems to be no basis for the assumption of a fixed order between types of concentrates, between types of forages and between different types of carbohydrate regarding their contribution to CH4 emission. The current results indicate that if the aim is to predict CH4 emission in cows with empirical models, such an attempt is best preceded by consideration of the errors introduced with such major simplification of estimates for CH4 emission.
Finally, the results indicate the problem that outcomes of CH4 emission may strongly differ with the units of expression must be addressed. When expressing CH4 emission in g CH4/kg DM, a curvilinear decline was simulated with increasing DMI and a proportion of 0·4 of concentrate in dietary DM (Fig. 4c; Table 4). The decline was caused by an increase in fractional passage rates and rumen fluid volume and by a decrease in rumen pH (and concomitant changes in molar proportions of VFA), reducing fermentation of especially fibre in the rumen. However, such a curvilinear decline was not found when CH4 was expressed in g CH4/kg FCM (Fig. 4a, b). This difference is illustrative of how a different choice of units may lead to a different interpretation of the effect of nutrition on CH4 emission.
Model evaluation
Indirect calorimetry trials
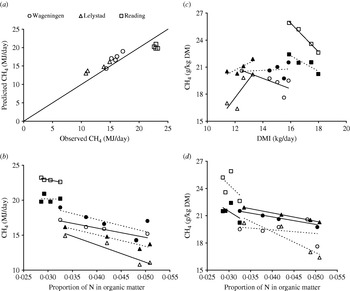
The data set was from cows consuming diets with a proportion of more than 0·9 (Lelystad and Wageningen data sets) or nearly 0·7 of GH in dietary DM (Reading data set). Although the data set contained a wide range of N:OM ratios and herbage qualities, which suited the purpose of evaluating predictive accuracy of the model for GH-based diets, it does not apply to grass diets with a low CP content. The evaluation results in Fig. 5a indicate that model predictions follow the trend in observed CH4 emission but on average over-predicted by 1·1 and 1·8 MJ/day for the Wageningen and Lelystad data set, respectively, and under-predicted by 2·7 MJ/day for the Reading data set (Fig. 5a). The means of predicted and observed values for the whole data set closely matched (17·2 and 17·0 MJ/day respectively). The square root of the mean square prediction error was 2·0 MJ/day and equal to 0·12 of the mean observed value, which is in the lower range of prediction errors reported with earlier evaluations studies (Mills et al. Reference Mills, Dijkstra, Bannink, Cammell, Kebreab and France2001; Kebreab et al. Reference Kebreab, France, McBride, Odongo, Bannink, Mills, Dijkstra, Kebreab, Dijkstra, Bannink, Gerrits and France2006). The fact that only GH-based diets were used in the present evaluation probably contributed to this low error. Total prediction error was decomposed into error due to overall bias of prediction (by a proportion of 0·005), due to deviation of the regression slope from unity (by a proportion of 0·548), and due to disturbance or random variation (by a proportion of 0·447; Bibby & Toutenburg Reference Bibby and Toutenburg1977). The significant contribution of the error due to deviation of the regression slope from unity is caused by the fact that at the lower end of observed values, all data from Lelystad and Wageningen cluster, which were over-predicted, while at the higher end of observed values, the under-predicted Reading data cluster.
Observed (open symbols) and predicted (closed symbols) CH4 emission (MJ/day) from cows consuming diets with GH of varying quality in indirect calorimetry trials at the Wageningen (○), Lelystad (▵) and Reading (□) research facilities. (a) Observed and predicted CH4 emission (root mean-squared prediction error 2·04 MJ/day or 12·0% of the mean value observed. The dashed lines indicate the line of unity. (b) Observed and predicted CH4 emission related to the proportion of N in dietary OM. (c) The results of (b) expressed in g CH4/kg DM related to DMI. (d) The results of (b) expressed in g CH4/kg DM related to the proportion of N in OM. Dashed (closed symbols) and continuous lines (open symbols) in (b), (c) and (d) indicate the linear trend predicted and observed, respectively, for CH4 emission rates for the Wageningen, Lelystad and Reading data set.

It remains speculation what the precise causes of these differences are besides erroneous representation of relationships in the model. It cannot be related to the assumption of a high soluble carbohydrate content in concentrates (Table 2) because the concentrates were a minor fraction of the diet. More likely, errors were made in estimating the contents of soluble carbohydrate and NDF, and their degradation characteristics for the various types of GH tested. Alternatively, estimates of VFA yield and associated formation of CH4 may have been erroneous and not applicable to mainly GH-based diets. However, the latter is considered unlikely to be a main cause because of different results obtained for the Reading data compared to the data from Wageningen and Lelystad (Fig. 5a). The cause may also lie in the large differences in level of CH4 emission observed amongst the different research facilities, with substantially higher emission rates for the Reading data set compared to the Lelystad and Wageningen ones, although all measurements were obtained with GH-based diets. The background to such large differences (a difference of 0·016 of GEI emitted as CH4 from comparable types of GH) remains unclear.
The evaluation results further indicated an effect of N:OM ratio in dietary DM on CH4 emission (Fig. 5b). Both observed and predicted CH4 emission decreased with an increase in dietary N:OM ratio. The model therefore seems capable of reproducing the observed effect on CH4 emission of varying CP content in GH. The model did predict the highest CH4 emission for this data set corresponding to the highest values observed at the low proportion of N in OM of 0·03. However, part of the variation observed must also be attributed to differences in DMI. Besides proportion of N in OM, also variation in DMI may have affected the results as discussed previously for the simulation results (Fig. 4). The results in Fig. 5c and d are expressed in g CH4/kg DM. The model again predicted similar trends as observed. The DMI tended to increase with an increased proportion of N in OM with the Reading dataset, whereas DMI decreased with the Wageningen and Lelystad data sets. Because CH4 emission decreases with both an increase of DMI as well as with an increase of N proportion in OM, the reduction of g CH4/kg DM was strongest for the Reading data set (Fig. 5c and d). For the Wageningen and Lelystad data sets the effect of DMI and N proportion in OM were counteractive, resulting in a smaller decrease of g CH4/kg DM. When related to the proportion of N in OM (Fig. 5d) the predicted amounts of g CH4/kg DM decreased by 0·4, 2·3 and 4·5 g CH4/kg DM per 0·01 increase in the proportion of N in OM for the Wageningen, Lelystad and Reading data set, respectively, and by 0·8, 0·9 and 3·0 g CH4/kg DM for the amounts observed, respectively. At a level of 20 g CH4/kg DM a change in the proportion of N in OM of 0·01 therefore corresponded on average to a change of 12% for predicted values and of 8% for observed values.
Practical cases
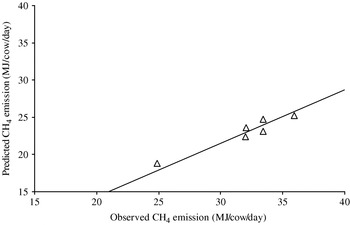
Comparison of model predictions against data from on-farm monitoring surveys indicated that much more CH4 was emitted than could have been produced by cows and young stock (Fig. 6). Such a result is expected because considerable methanogenesis occurs in the slurry pit (Smits & Huis in ‘t Veld Reference Smits, Huis in ‘t Veld, Monteny and Hartung2007). Compared to the model predictions of CH4 emission from cattle, 0·28 appeared to have originated from another source, which must have been the slurry pit. Also Hindrichsen et al. (Reference Hindrichsen, Wettstein, Machmüller, Jörg and Kreuzer2005) established a substantial contribution from slurry of 0·16–0·22 of total CH4 emission measured, which is slightly less than suggested by the current evaluation results. The contribution of slurry to total barn CH4 emission is therefore substantial and appeared to be of the same order of magnitude as the variation in CH4 emission among individual measurements (Fig. 6). Regression of predicted against measured CH4 emission expressed per cow indicated a good relationship with a slope of 0·72. (R 2=0·87; P<0·001). It appears unlikely that the assumption about young stock (half the contribution of an adult cow) strongly affected prediction errors. More likely causes are erroneous model prediction, erroneous measurement of barn emissions, erroneous monitoring of farm management and cow feeding, and errors made due to the assumption of an average diet for animals in the herd. Quantifying ventilation rates in naturally ventilated buildings cannot be done as accurately as in forced ventilated buildings and inaccuracies may easily exceed 0·10. The ratio of CO2:CH4 concentrations may not exactly reflect the ratio of the source strengths of these gases.
Comparison of observed and predicted CH4 emission (MJ/cow/day) from cattle sheds under practical conditions. The regression equation was: Predicted CH4 (MJ/day)=0·72×Observed CH4 (MJ/day), R 2=0·87 (P<0·00001).

Variation between farms may be much larger than established in the present study. Diverse feeding regimes (different combinations of DMI, and of types of forages available and types of concentrates, by-products and starch sources purchased) easily lead to more variation in CH4 emission from cattle than indicated here. Notwithstanding all these factors contributing to variation, the present results give a clear indication that the contribution of slurry to CH4 emission is substantial. This contribution may add variation in measured emissions between different farms depending on various factors, such as the amount of manure stored, the duration of storage, manure temperature, and storage emptying and cleaning. In the present evaluation, the mechanistic model explained 0·87 of observed variation in CH4 emission per cow, which suggests that the model can be used to predict CH4 emission under practical conditions with various nutritional strategies and production levels. However, more data and model evaluations are clearly needed to investigate further the prediction potential of the mechanistic model under practical conditions. A similar approach was used by Hensen et al. (Reference Hensen, Groot, Van den Bulk, Vermeulen, Olesen and Schelde2006), but worse results were obtained despite the larger number of measurements available. They performed field measurement of total farm CH4 emission instead of stall measurements, however, and explained 0·27 and 0·60 of observed variation when using the empirical farm model of greenhouse gas emission of Olesen et al. (Reference Olesen, Schelde, Weiske, Weisbjerg, Asman and Djurhuus2006) or simple emission factors, respectively, rather than a mechanistic model.
CONCLUSIONS
The present study indicates that alterations in grassland management have a strong impact on simulated CH4 emission. The N fertilization regime (HF v. LF), stage of maturity when grass is harvested (EC v. LC) and choice between fresh or ensiled grass (GH and GS) all contributed to variation in CH4 emission, with N fertilization rate apparently having the largest impact. Furthermore, CH4 emission depends on DMI level and the type and amount of fermentable carbohydrate and non-carbohydrates in the diet. Generally, a lower CH4 emission was predicted for HF compared to LF, and for EC compared to LC irrespective of the units of expression (g CH4/day, g CH4/kg FCM, g CH4/kg DM or proportion of GEI; Table 4). Methane emission was lower or equal for GH than for GS-EC when expressed in g CH4/kg FCM (except for the highest DMI levels tested), but always higher when expressed in g CH4/kg DM or CH4 energy as a proportion of GEI. Both observed and predicted emissions expressed in g CH4/day or g CH4/kg DM decreased upon an increase in dietary N:OM ratio. The results imply that with calculations of CH4 emission under various feeding regimes or production conditions, variations in type and proportion of grass forage in the diet are important aspects that need to be taken into account. With respect to the comparison between grass forages and concentrates in their contribution to CH4 it must be noted that the results from the present study have no general applicability. For such a comparison more specific studies are needed. It appears that the contribution of forages to CH4 emission cannot be simplified to the constant coefficient values adopted in various empirical models (e.g. estimate of 0·06 of GEI by cows; IPCC 1996) meant to be used under a wide range of production conditions. This has importance for the applicability of results of scenario studies that aim to discriminate between various management measures to reduce greenhouse gas emission. The mechanistic model used in the present study can estimate CH4 emission under various feeding and production conditions, taking into account the nutritional factors identified to affect enteric methanogenesis. Although the simulated effects of grass forage quality are thought to have general applicability, further evaluations are needed with independent measurements. Such data should preferably be obtained from experiments conducted under controlled experimental conditions and designed to evaluate the effect of grass quality on CH4 emission.