


Introduction
Precipitation is an important process in the interaction between ice sheets and the atmosphere. In general, precipitation is related to surface elevation as a result of changes in the water-holding capacity of the atmosphere. Precipitation has been related to surface temperature by a parameterization with coefficients determined by ice-core analyses (Reference Yiou, Raisbeck, Bourles, Lorius and BarkovYiou and others, 1985; Reference Clausen, Gundestrup, Johnsen, Bindschadler and ZwallyClausen and others, 1988; Reference Huybrechts and T’siobbelHuybrechts and T’siobbel, 1995), and this parameterization has been used in a number of studies to simulate the distribution of ice sheets at the Last Glacial Maximum (LGM; 21 kyr) and/or ice-age cycles (Reference Huybrechts and T’siobbelHuybrechts and T’siobbel, 1995; Reference Peltier and MarshallPeltier and Marshall, 1995; Reference Ritz, Fabre and LetréguillyRitz and others, 1997; Reference Tarasov and PeltierTarasov and Peltier, 1997; Reference Greve, Wyrwoll and EisenhauerGreve and others, 1999; Reference Cuffey and MarshallCuffey and Marshall, 2000). In those studies, it was assumed that the pattern of precipitation was the same as at present, with a simple modification proportional to the change in surface temperature or sea-level temperature estimated from ice-core data or a snapshot result from an energy-balance model. As the conventional parameterization is defined in reference to surface temperature or sea-level temperature, it has a low computational cost compared to the atmospheric general circulation model (AGCM) and as such is suitable for the simulation of ice sheets at long timescales.
However, the change in local temperature is not the only factor determining a change in precipitation. The atmosphere is also affected by the topography of the ice sheets themselves (Reference Hall, Valdes and DongHall and others, 1996; Reference Kageyama and ValdesKageyama and Valdes, 2000; Reference Vettoretti, Peltier and McFarlaneVettoretti and others, 2000). Precipitation increases on the windward side of ice sheets due to the ascent of air up the slopes, resulting in desertification of the interior of the ice sheets. Reference Budd and SmithBudd and Smith (1981) parameterized the interior desertification effect based on surface elevation, and Reference Tarasov and PeltierTarasov and Peltier (2004) indicated that interior desertification on the Laurentide ice sheet is necessary in order to fit relative sea-level observations. Reference Ritz, Fabre and LetréguillyRitz and others (1997) and Reference Cuffey and MarshallCuffey and Marshall (2000) considered orographically driven precipitation by the ascent of air at the margins of Greenland based on estimations from the changes in ice surface slopes. The change in large-scale atmospheric circulation, which cannot be expressed by local changes in surface slopes, also influences precipitation, where the topography of the ice sheets alters stationary waves and causes the concentration and shifting of transient eddies. The increase in precipitation due to the change in transient eddies may in fact have promoted the southward growth of the Laurentide ice sheet (Reference Broccoli and ManabeBroccoli and Manabe, 1987).
A range of physical processes have also been shown to affect precipitation. Reference Krinner and GenthonKrinner and Genthon (1999) evaluated the dependence of precipitation on surface temperature in Greenland through an AGCM experiment, and Reference Sanberg and OerlemansSanberg and Oerlemans (1983) and Reference Roe and LindzenRoe and Lindzen (2001) estimated the precipitation on an ice sheet based on the temporal-mean wind and temperature field. In the present study, the change in precipitation due to changes in ice-sheet topography is examined for several types of ice sheets based on AGCM experiments performed at higher resolution (T106, ∼1°) than in previous studies. The changes are compared with other parameters such as albedo, CO2, sea surface temperature (SST) and insolation. Consistent with previous studies, the results are parameterized in terms of surface temperature change, which can be estimated from the ice-sheet topography based on an assumed lapse rate.
Another consideration is the influence of precipitation on the response of the ice sheet through the effect of surface mass balance. Reference RoeRoe (2002) studied the change in the Greenland ice sheet with a range of parameterizations of precipitation using a three-dimensional (3-D) ice-sheet model. Reference Fabre, Ramstein, Ritz, Pinot and FournierFabre and others (1998), Reference PollardPollard and others (2000), Reference Charbit, Ritz and RamsteinCharbit and others (2002), Reference Marshall, James and ClarkeMarshall and others (2002) and Reference Zweck and HuybrechtsZweck and Huybrechts (2003) evaluated the response of the Northern Hemisphere ice sheets to the precipitation modeled by AGCMs. That parameterization is re-evaluated in this study through AGCM sensitivity experiments with high horizontal resolution using a 3-D thermomechanical ice-sheet model (Reference SaitoSaito, 2002; Reference Saito and Abe-OuchiSaito and Abe-Ouchi, 2004). The influence of the change in precipitation estimated from the AGCM on the steady-state topography of the Laurentide ice sheet is also examined.
Experiments
In the present study, separate models are used for the atmospheric experiment and the ice-sheet experiment. A CCSR/NIES AGCM (Reference Numaguti, Takahashi, Nakajima and SumiNumaguti and others, 1997) is used to evaluate the change in precipitation in response to ice-sheet topography. To resolve precipitation on a regional scale, the resolution of the AGCM is set to T106 horizontally (∼1˚ latitude and longitude) and 20 levels are defined vertically.
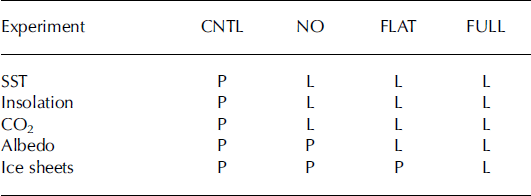
Four numerical experiments were carried out assuming different boundary conditions (CNTL, NO, FLAT and FULL), as listed in Table 1. CNTL and FULL are based on the Paleoclimate Modelling Intercomparison Project (PMIP; Reference Joussaume and TaylorJoussaume and Taylor, 1995), where CNTL represents a present-day control simulation and FULL is the LGM experiment. CLIMAP (CLIMAP Project Members, 1981) is used for the SST, Reference PeltierPeltier (1994) is employed for ice-sheet topography, insolation parameters are set at the LGM values, and CO2 concentration is set at 200 ppm. FLAT is a sensitivity experiment conducted for orography of the Northern Hemisphere ice sheet, where the ice sheet covers the same area as in FULL but the thickness is set to 0 m except for Greenland (present). The distribution of surface albedo and other parameters is set the same as in FULL. The ice sheet and SST in the NO experiment are the same as in CNTL, while CO2 and insolation parameters are set the same as in FULL. Each experiment runs for 11 or 13 model years, and the results for the last 10 years are analyzed. Computation speed for experiments was about 40 days per 10 model years on an NEC SX-5 with a single processor. The difference between the FULL and FLAT experiments therefore represents the effect of ice-sheet topography, the difference between the FLAT and NO experiments represents the effect of the albedo of the ice sheets, and the difference between NO and CNTL represents the effect of CO2, SST and insolation.
Boundary conditions for AGCM experiments. P: present, L: Last Glacial Maximum
The Laurentide ice sheet at the LGM is also simulated using a 3-D thermomechanical ice-sheet model in order to estimate the influence of the change in precipitation on the ice-sheet distribution. The ice-sheet model used in the present paper is a standard 3-D shallow-ice approximation model (Reference SaitoSaito, 2002; Reference Saito and Abe-OuchiSaito and Abe-Ouchi, 2004) reprojected on a spherical grid system. The ice-sheet model assumes ice as a non-Newtonian viscous fluid with Glen’s flow-law exponent of 3. The thickness, velocity and temperature distribution of the ice sheet are calculated under a prescribed climate condition defined in terms of surface mass balance and temperature. The dynamics of the ice shelf and the grounding line are not included in the model; instead, Hudson Bay is treated as land toward which the ice sheet is allowed to advance. The ice enhancement factor is set at 3, and a constant value of 42 mW m–2 is set for the geothermal heat flux. For basal sliding, the linear parameterization presented in Reference Marshall, James and ClarkeMarshall and others (2002) is applied with a coefficient of 0.01 ma–1 Pa–1. The bedrock boundary condition is derived from the ETOPO5 dataset (NGDC, 1988). A positive-degree-day method is applied for parameterization of surface mass balance, with melt factors for snow and ice of 3.0 and 8.0 mmw.e. ˚C–1 d–1 and a snow refreezing fraction of 0.6 (Jóhannesson and others, 1995). The horizontal resolution of the model is 0.5˚, and the vertical resolution is 26 levels. The time-step for solving the evolution of thickness and thermodynamics is 1 year, and all experiments were run for 80 kyr to reach a steady state. Although the Laurentide ice sheet at the LGM is unlikely to have reached such a steady state, the present experiments were designed to reveal the fundamental character of the influence of precipitation on the Laurentide ice sheet.
Analysis of Precipitation in Agcm Experiments
Figure 1a shows the change in precipitation between CNTL and FULL. The high-resolution AGCM successfully simulates the increase in precipitation from the southeastern margin of the Laurentide ice sheet to western Europe due to the concentration of storm tracks (Reference Hall, Valdes and DongHall and others, 1996; Reference Kageyama and ValdesKageyama and Valdes, 2000; Reference Vettoretti, Peltier and McFarlaneVettoretti and others, 2000). The difference also successfully reproduces the decrease in precipitation over the Greenland ice sheet at the LGM (a two-thirds reduction on present levels based on ice-core data; Reference DansgaardDansgaard and others, 1993). Figure 1b shows the cumulative effect of SST, CO2 and insolation change at the LGM (difference between CNTL and NO). At mid-latitudes, the effect of SST cooling results in a zonal asymmetric change in surface temperature and a change in the pattern of stationary waves and transient eddies, leading to a change in precipitation. Figure 1c shows the albedo effect (difference between NO and FLAT). Again, the reduction in albedo gives rise to a change in the pattern of stationary waves, leading to a strengthening of the wet westerly wind from the Pacific to the southwestern area of the Laurentide ice sheet, and increased precipitation. Precipitation decreases over the rest of the ice sheets due to the decrease in the water-holding capacity of the atmosphere as a result of surface cooling. Figure 1 d shows the effect of ice-sheet topography (difference between FLAT and FULL). On the windward side of the ice sheets, precipitation increases due to the effect of up-slope rise, which in combination with overall cooling results in desertification of the interior of the Laurentide ice sheet. Precipitation increases in the southeast of the Laurentide ice sheet due to the concentration of transient eddies associated with the change in the stationary waves due to ice-sheet topography.
Fractional change in precipitation from (a) CNTL to FULL, (b) CNTL to NO, (c) NO to FLAT, and (d) FLAT to FULL. The first of the compared experiments is used as the denominator for calculating the ratio (e.g. (a) denotes (PREFULL – PRECNTL)/PRECNTL). Contour interval is 0.2. Negative values are shaded, and positive values are dotted.
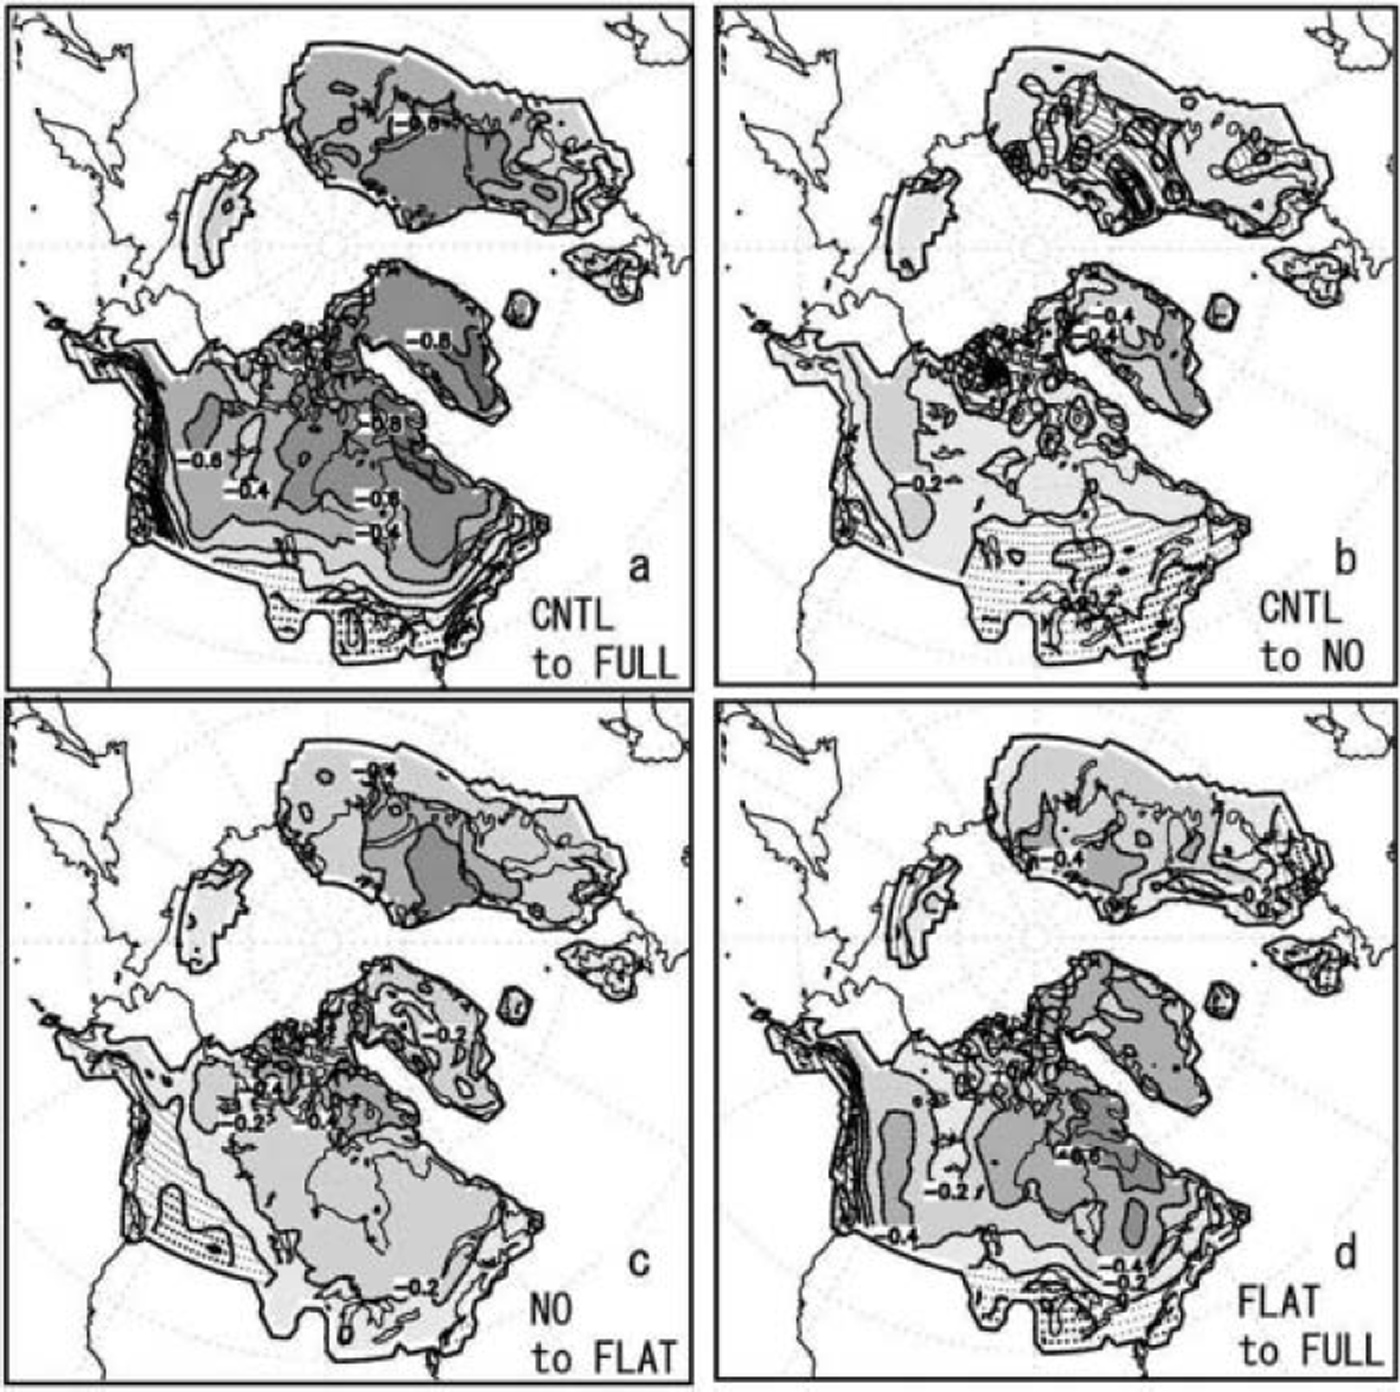
Figure 2 shows a comparison of each effect on each ice sheet at the LGM. The largest decrease in precipitation (CNTL – FULL) occurs over Greenland, with a decrease of about 75%. This decrease is not typical of the Northern Hemisphere, and the use of ice-core data for Greenland to estimate the precipitation change over the entire region of the Northern Hemisphere in the ice-age cycles may therefore result in an underestimation of precipitation for other ice sheets. The precipitation change estimated by the Clausius–Clapeyron (C-C) equation, assuming saturated air and proportionality between precipitation and the change in the saturated air mass, is also shown in the figure. The total LGM effect estimated by the C-C equation indicates a larger decrease than that by the AGCM, and the dependence on the location of the ice sheet is not as strong as in the AGCM.
Ratio between the change in area-averaged precipitation and the precipitation obtained by the CNTL experiment. The changes in precipitation are estimated by the AGCM or the C-C equation. Results are shown for the Laurentide, Scandinavian and Greenland ice sheets and the total. Total LGM (C-C): change from CNTL to FULL estimated by the C-C equation. Total LGM: change from CNTL to FULL. Other: change from CNTL to NO. Flat ice: change from CNTL to FLAT. Topographic: change from FLAT to FULL.
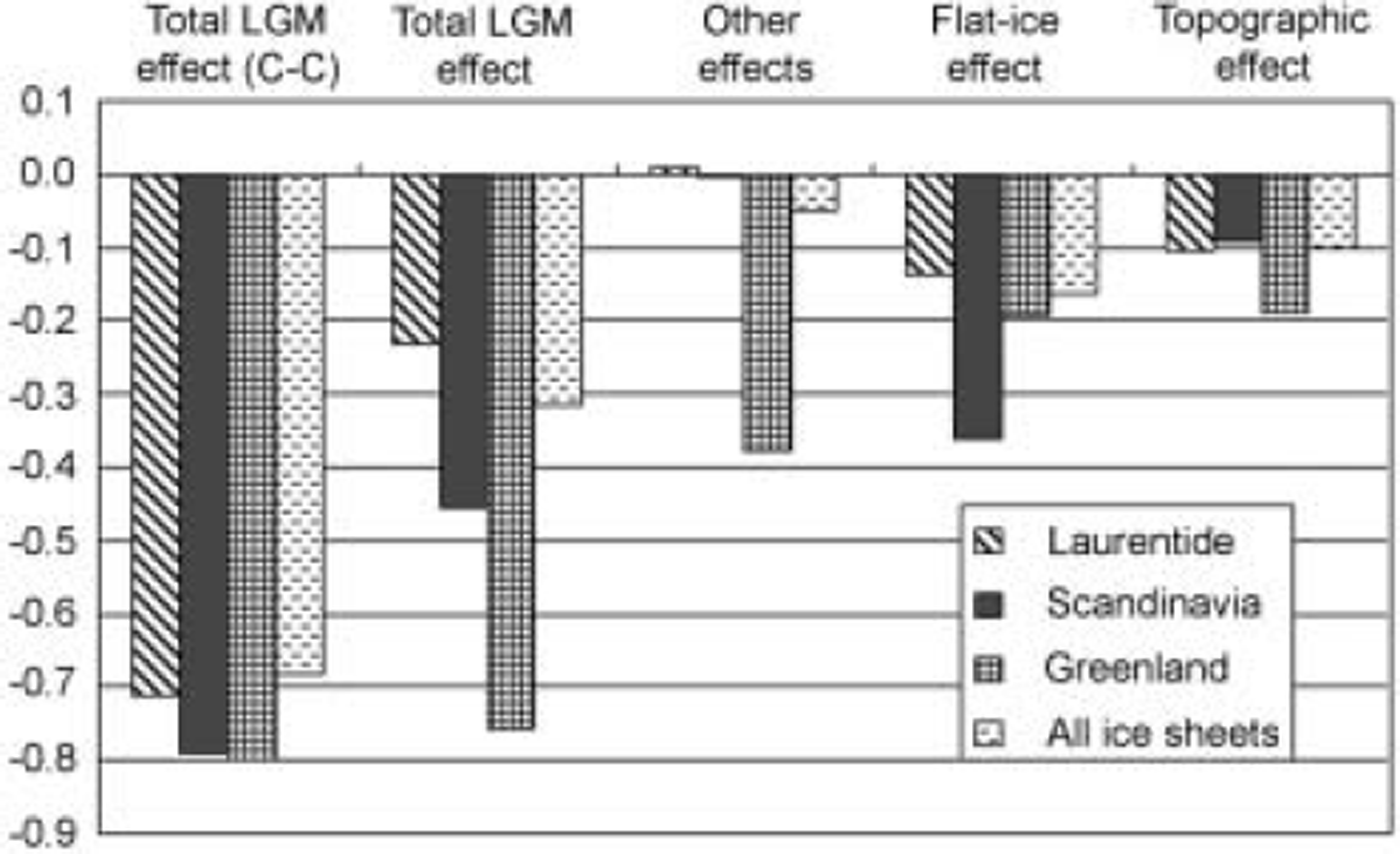
Figure 3a shows the relationship between the ratio of annual mean precipitation change between CNTL and FULL and the annual mean surface temperature change between CNTL and FULL on the Laurentide ice sheet. Two clusters of positive ratio can be seen, where the right cluster corresponds to the increase in precipitation on the windward side of the Rockies due to topographic effects, and the left cluster corresponds to the increase in precipitation in the southeast of the Laurentide ice sheet due to the concentration of storm tracks. For comparison with previous studies, the ratio of precipitation change was parameterized against the annual mean surface temperature. The effect of seasonal change is discussed later. The least-squares regression coefficient for the present model is 2.5% K–1 (black line in Fig. 3a), lower than that by the conventional parameterizations (e.g. 3% K–1 by Reference Tarasov and PeltierTarasov and Peltier (1997) and 4%K–1 by Reference Huybrechts and T’siobbelHuybrechts and T’siobbel (1995)), which are based on ice-core data for other ice sheets (e.g. Greenland and Antarctica). The 2.5% K–1 rate reflects the smaller precipitation change on the Laurentide ice sheet compared to other ice sheets (Fig. 2), as revealed by the AGCM experiments. The relationship between the surface temperature change and the precipitation change estimated by the C-C equation assuming a saturated air mass is also shown in the figure. A large decrease in precipitation and strong dependence on surface temperature can be seen, with a regression coefficient of 8.0% K–1 (green line in Fig. 3a). This result is much higher than the rate indicated by the difference between CNTL and FULL, and may therefore lead to an underestimation of precipitation.
Scatter diagrams of the change in annual mean surface temperature difference vs the change in annual mean precipitation rate on the Laurentide ice sheet for change from (a) CNTL to FULL (open square and solid regression line) and CNTL to FULL by C-C (cross and dashed regression line); (b) CNTL to NO (open square and solid regression line) and NO to FLAT (cross and dashed regression line); and (c) FLAT to FULL (open square and solid regression line).
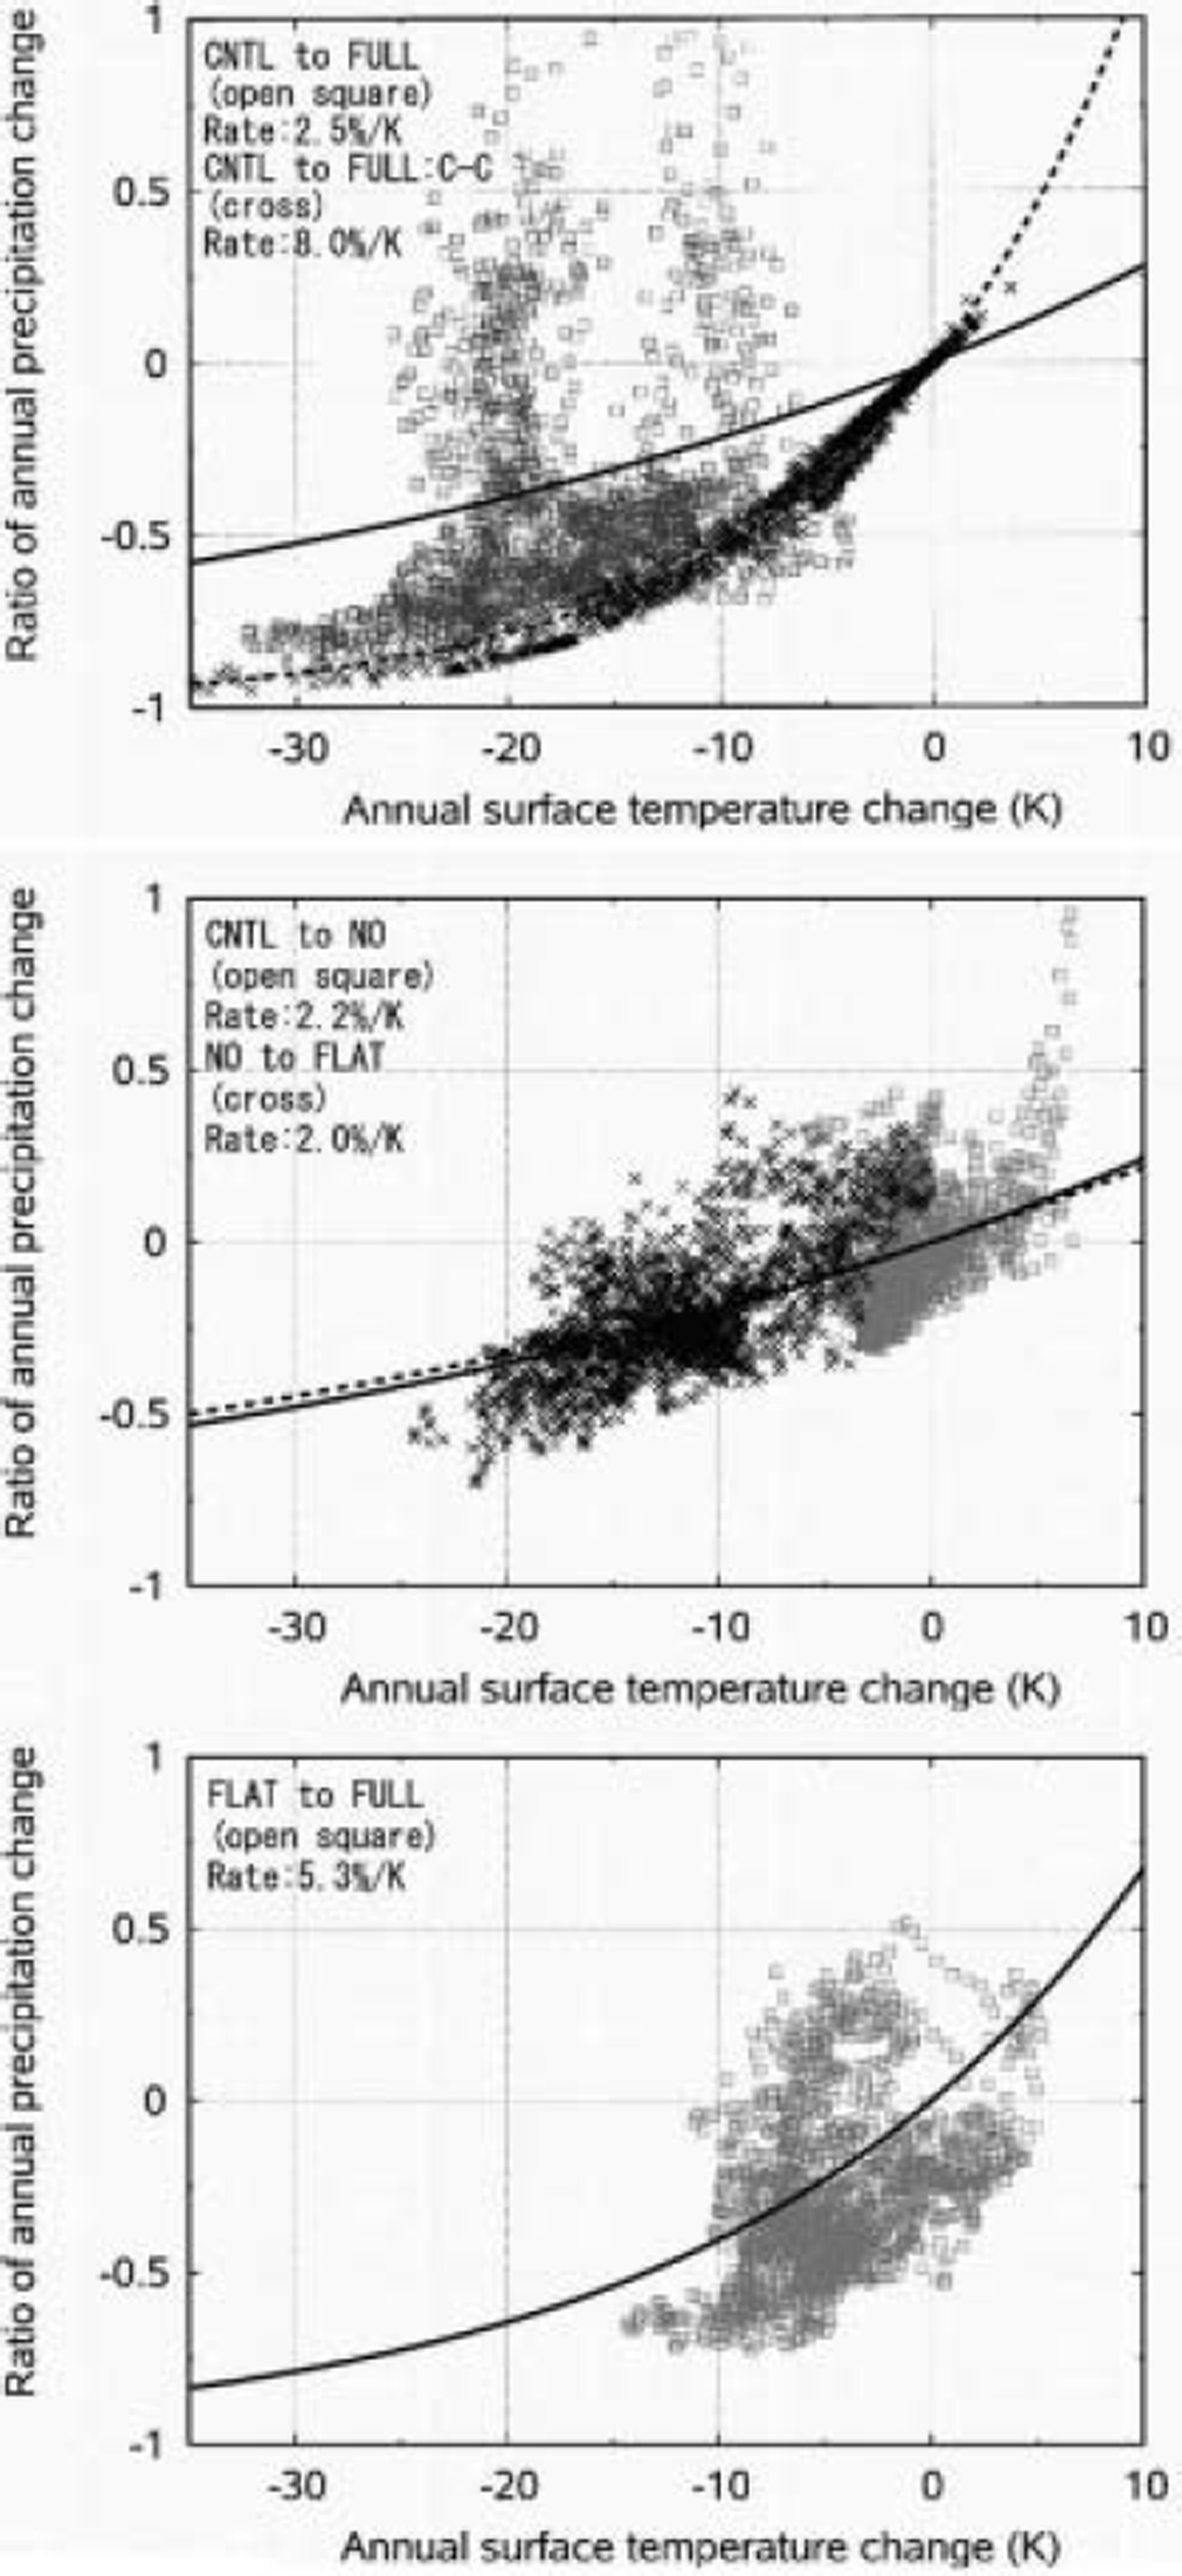
Figure 3b and c show the relationship between the ratio of annual mean precipitation change and the annual mean surface temperature change on the Laurentide ice sheets (CNTL–NO, NO–FLAT, FLAT–FULL). Table 2 shows the regression coefficient for the parameterization of the ratio of precipitation change against the annual mean surface temperature and the variance of the residuals from a least-squares regression curve. The coefficient for the effect of ice-sheet topography (Fig. 3c; 5.3% K–1) is larger than the other two effects (Fig. 3b; 2.2% K–1 and 2.0% K–1), attributable to the effect of interior desertification. In the present parameterization, the effect of ice-sheet topography is separated from other effects, as it imparts a larger influence on atmospheric circulation change (e.g. interior desertification, concentration of storm tracks). The regression coefficient for the combination of the two other effects (CNTL–FLAT) is estimated by the same method to be 1.7% K–1, which again is lower than that determined in previous studies (e.g. 3%K–1 by Reference Tarasov and PeltierTarasov and Peltier (1997) and 4% K–1 by Reference Huybrechts and T’siobbelHuybrechts and T’siobbel (1995)). However, the ratios of change derived in previous studies are based on ice-core data obtained from interior sites and are therefore confounded by the effect of interior desertification. Table 2 shows the variance of residuals from the regression curve, and the effects of the scatter of the CNTL to FLAT and FLAT to FULL are discussed later.
The rate of annual precipitation change by each effect, estimated by a method of least squares, and the variance of residuals from the regression curve

Effect of Precipitation on the Steady-State Laurentide Ice Sheet
The effect of precipitation on the steady-state Laurentide ice sheet was determined by integrating the 3-D ice-sheet model until the ice sheet reached an equilibrium state. The initial condition was defined as the absence of an ice sheet. The surface air temperature (SAT) was set according to

The perturbation calculated by the AGCM was then added to the present climatology (re-analyzed European Centre for Medium-Range Weather Forecasts data), and modified by the growth of the ice sheet (dh) by setting a lapse rate (lap) of -5.0 K km–1.
The parameterization of precipitation (PRE), modifying the present precipitation, was expressed in terms of the two effects (topography and general climatic cooling) as follows:
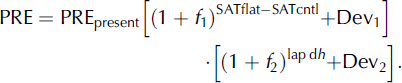
In this experiment, CMAP (Reference Xie and ArkinXie and Arkin, 1996) was used as the present reference precipitation. The factors f 1 and f 2 are the rate of precipitation change due to surface temperature between CNTL and FLAT, and between FLAT and FULL, respectively (Table 2). The terms Dev1 and Dev2 represent the deviation from the regression curve for the change from CNTL to FLAT and from FLAT to FULL, respectively.
If the snapshot result of an AGCM is available, it is modified by the effect of ice-sheet topography as follows.

In the present experiments, dh represents the deviation of the surface height from the reference topography (Reference PeltierPeltier, 1994) of the FULL experiment. Dev1 and Dev2 are included in Equation (3) because the deviational component is expressed by an AGCM . By distinguishing the two rates (f 1 and f2), the modeled precipitation can be modified in consideration of the effect of ice-sheet topography.
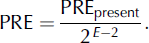
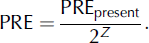
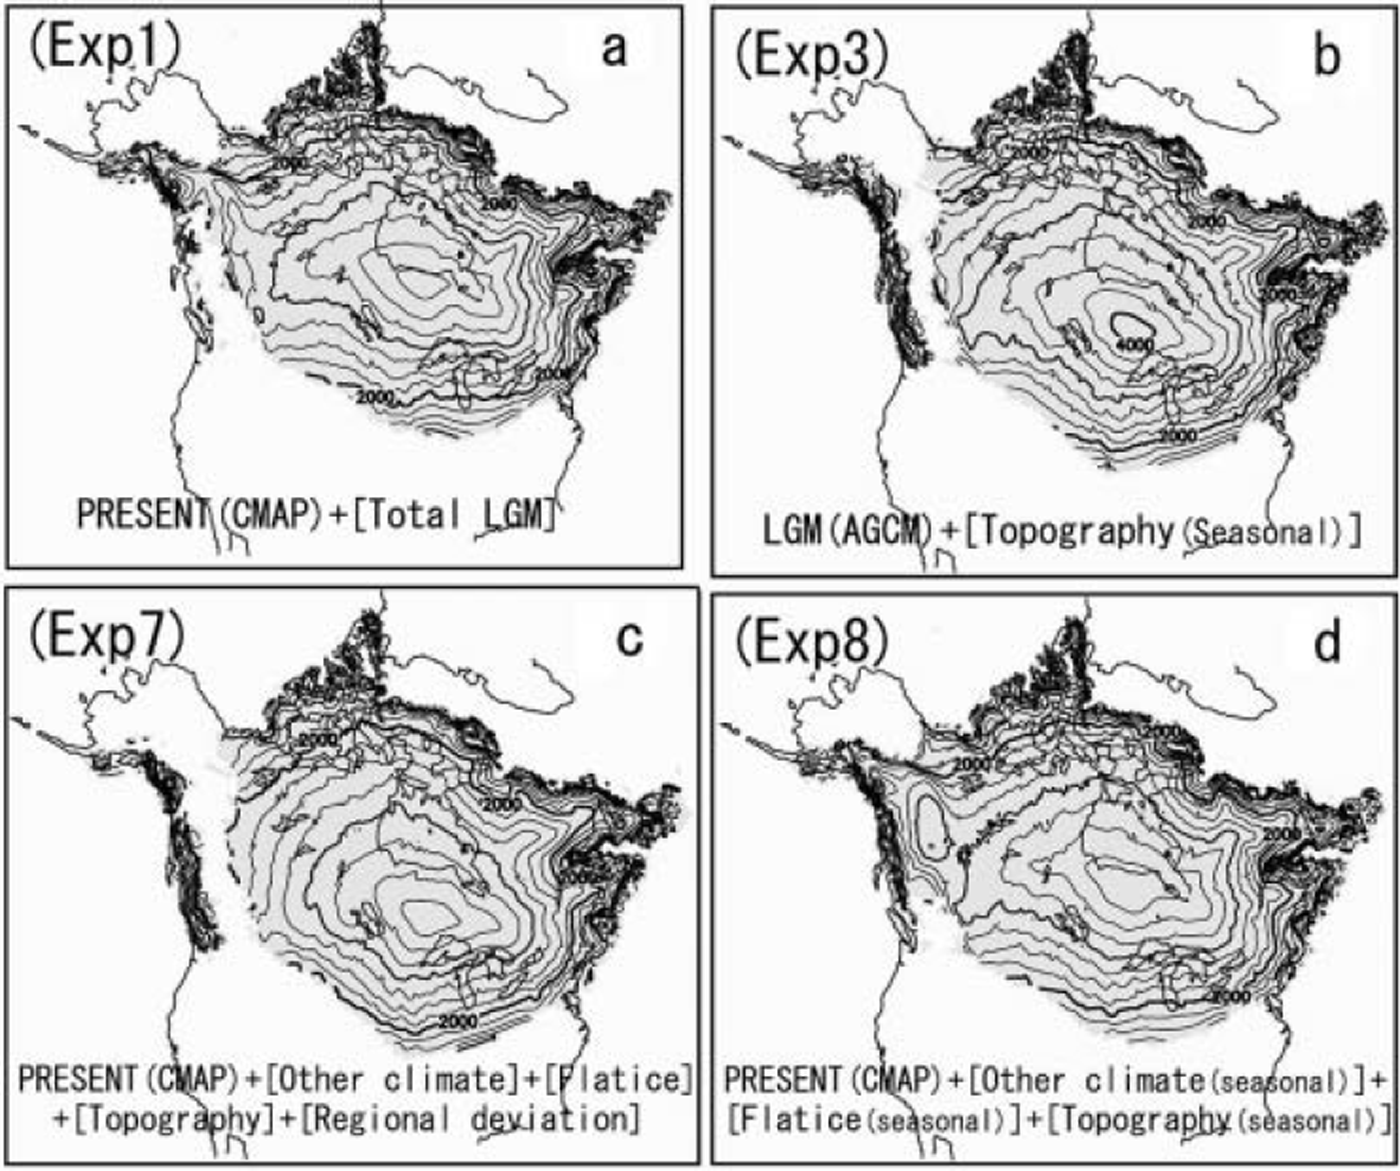
Three simulations of the steady-state Laurentide ice sheet were carried out (Exp1-Exp3 in Table 3). Exp1 modifies the reference present precipitation by Equation (2), adopting the 2.5% K–1 rate for both f 1 and f2 without deviational components (Dev1 and Dev2). Exp2 adopts the ‘elevation-desert’ effect proposed by Reference Budd and SmithBudd and Smith (1981), whereby the precipitation decreases from a reference value by a factor of 2 for each kilometer of ice thickness (Z) above the 2 km elevation (E), as given by
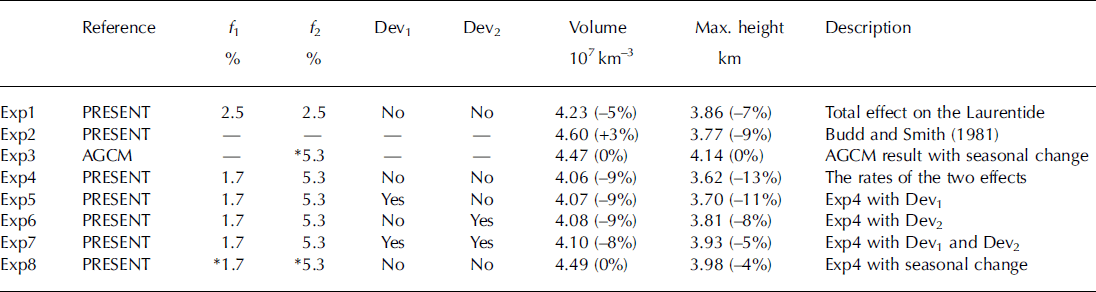
Experiment design together with the result of ice-sheet model experiment (Exp 1–8). Exp 1–8 except Exp3 adopt Equation (1) and set the present precipitation (CMAP) as the reference. Exp 3 adopts Equation (2) and sets the precipitation of the AGCM experiment. The terms f 1, f 2, Dev1 and Dev2 correspond to Equation (1). Exp3 and Exp8 consider the seasonal change (*; see Fig. 8) of f 1 and f 2. Volume and maximum surface height of the simulated Laurentide ice sheet for each experiment are shown. The values in parentheses denote the percentage differences from Exp3, which is based on the AGCM experiment
If the bed is already above 2 km, PRE is given by
Exp3 uses the precipitation given by the AGCM experiment, which is a modification of the monthly rate due to the topographic effect (Figs 4 and 8). The maximum surface height in Exp2 is 2% lower than that in Exp1 due to the strong desertification effect (>2.5% K–1). However, the steady-state volume of Exp2 is 8% higher than that of Exp1, as the desertification effect does not act on the lower surface. Figure 1d shows that the precipitation decreases in most of the area where the change in surface elevation is <2 km, suggesting that the desertification effect should also apply to lower surfaces. The steady-state volume of the Laurentide ice sheet in Exp1 is 5% lower than in Exp3, and the maximum surface height is 7% lower. From Figure 5, which shows the simulated annual precipitation averaged over the Laurentide ice sheet, the precipitation in Exp1 is about 30% lower than in Exp3, leading to the underestimation of volume and maximum surface height for the steady-state Laurentide ice sheet. The factors causing these differences in precipitation, ice-sheet volume and maximum surface height are discussed in the next section.
Steady-state Laurentide ice sheet surface topography by (a) Exp1, (b) Exp3, (c) Exp7 and (d) Exp8 (contour interval 250 m).
Factors Contributing to the Difference Between the Agcm and the Conventional Parameterization
Three factors can be identified as contributing to the difference between the AGCM and the conventional parameterization. The first is the effect of interior desertification. From the present AGCM experiments, the rate of precipitation change due to surface elevation change is 5.3% K–1, which is much larger than the rate determined unrelated to surface elevation change (1.7% K–1). In Exp4, the present precipitation is modified by Equation (2), which adopts both rates (1.7% K–1 and 5.3% K–1). However, the difference between the AGCM and the conventional parameterization is even larger in the case of Exp4. The ice volume and maximum surface height in Exp4 are lower than those in Exp1 because of the stronger interior desertification effect in Exp4. Furthermore, even taking the two rates based on the AGCM sensitivity experiments, the annual precipitation averaged over the Laurentide ice sheet is much lower than that of the AGCM FULL experiment (Fig. 5).
Simulated and present observed annual precipitation (mm month–1) (CMAP; Reference Xie and ArkinXie and Arkin, 1996) averaged over the Laurentide ice sheet, showing parameterization and AGCM results (surface temperature calculated using ice-sheet surface at the LGM; Reference PeltierPeltier, 1994).
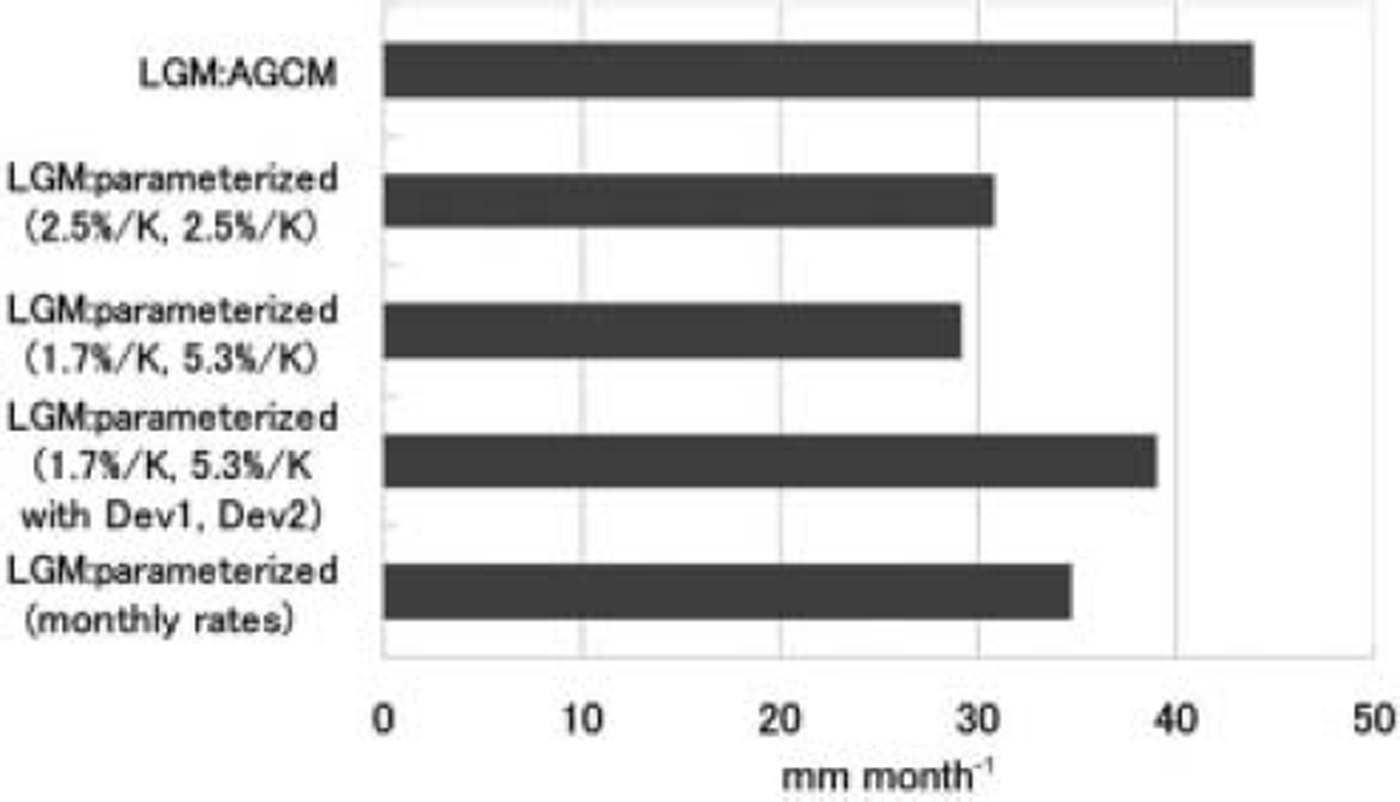
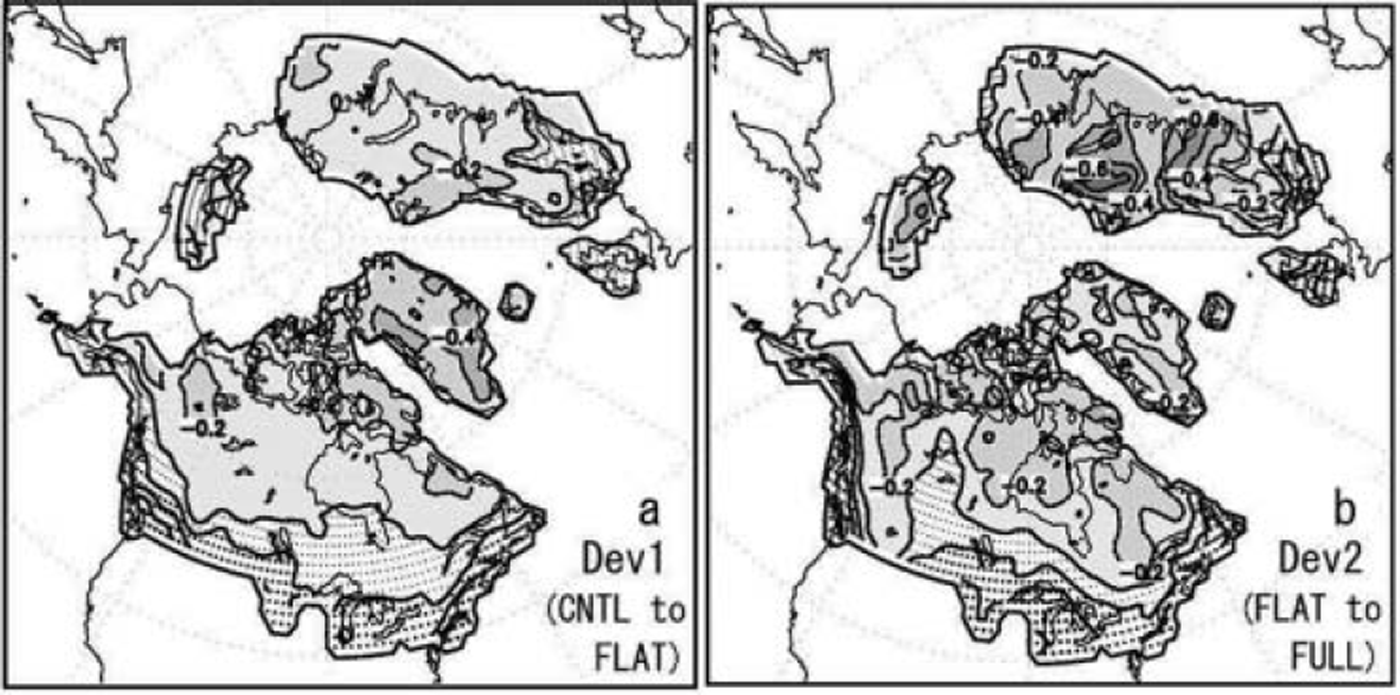
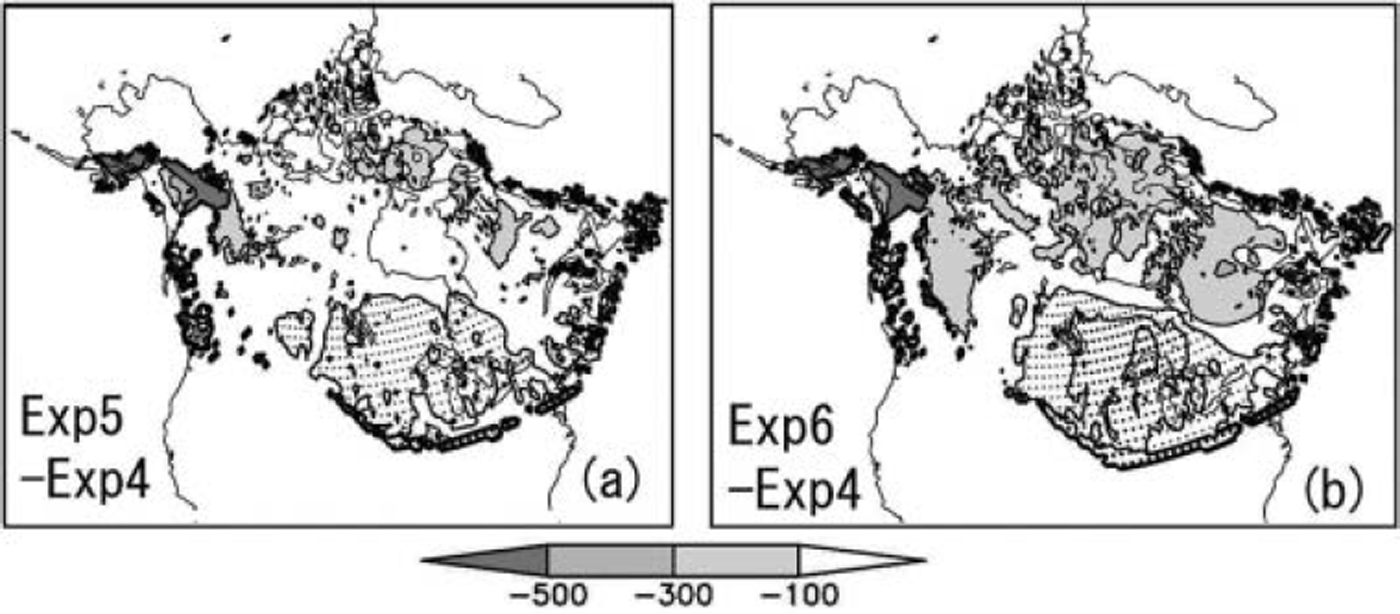
The second factor is the regional variation in the rate of precipitation change (e.g. in areas of interior desertification or concentration of storm tracks) over the Laurentide ice sheet. Figure 6a and b show the deviation from the regression curve of the change between CNTL and FLAT (i.e. 1.7% K–1) and between FLAT and FULL (i.e. 5.3% K–1). The variance of the residuals for the topographic effect (FLAT/FULL) is larger than that for the other effects (CNTL/ FLAT) (Table 2), due to the effects of interior desertification and the concentration of storm tracks on the Laurentide ice sheet. Thus, without considering the regional variation in the rate of precipitation change, the rate becomes smaller in the south of the Laurentide ice sheet where precipitation is higher than in the northern area. Figure 5 shows that the area-averaged precipitation increases when the regional variation is considered (Dev1 and Dev2). In terms of simulated volume, the experiments considering the deviational component (Exp5–7) do not differ appreciably from Exp4. However, differences can be seen between the experiments in terms of surface topography. Figure 7a and b show the variation in the steady-state surface topography of the Laurentide ice sheet due to these deviational components. The effect of the deviational component due to ice-sheet topography (Dev2) is stronger than that due to other effects (Dev1), reflecting the difference seen in the variance of residuals (Table 2). The effects of regional variation become significant when the advancement and maintenance of the Laurentide ice sheet are discussed.
(a, b) Deviation of the ratio of the precipitation change from CNTL to FLAT and from FLAT to FULL, from the regression curve of the change from CNTL to FLAT and the change from FLAT to FULL, respectively. Contour interval is 0.2. Negative values are shaded, and positive values are dotted.
Difference in topography of the ice surface (m) (a) between Exp5 and Exp4, and (b) between Exp6 and Exp4. Contour interval is 200 m. Shaded values are <-100 m, and dotted values are >100m. Positive values denote smaller results for Exp4.
The last factor contributing to the difference between these simulations is the seasonality of the rate of precipitation change. The AGCM results indicate that the rate changes seasonally by about 3%K–1 (Fig. 8), with lower values in summer. Both the seasonal changes show two peaks in spring and late autumn. Considering the yellow and red curves in Figure 8 which show the effect of the seasonal change of precipitation, the two peaks of CNTL to FLAT are mainly due to the seasonal change of precipitation, and those of FLAT to FULL are due to the effect of surface air temperature and precipitation change. Since the seasonality of the rate is derived from the combined effect of surface temperature and precipitation, more prudent and detailed argument is required.
Seasonal variation in the rate of change from: CNTL to FLAT (solid curve with closed diamond); FLAT to FULL (dashed curve with open square); CNTL to FLAT with annual mean surface temperature (dashed curve with open triangle); and FLAT to FULL with annual mean surface temperature (solid curve with closed circle).
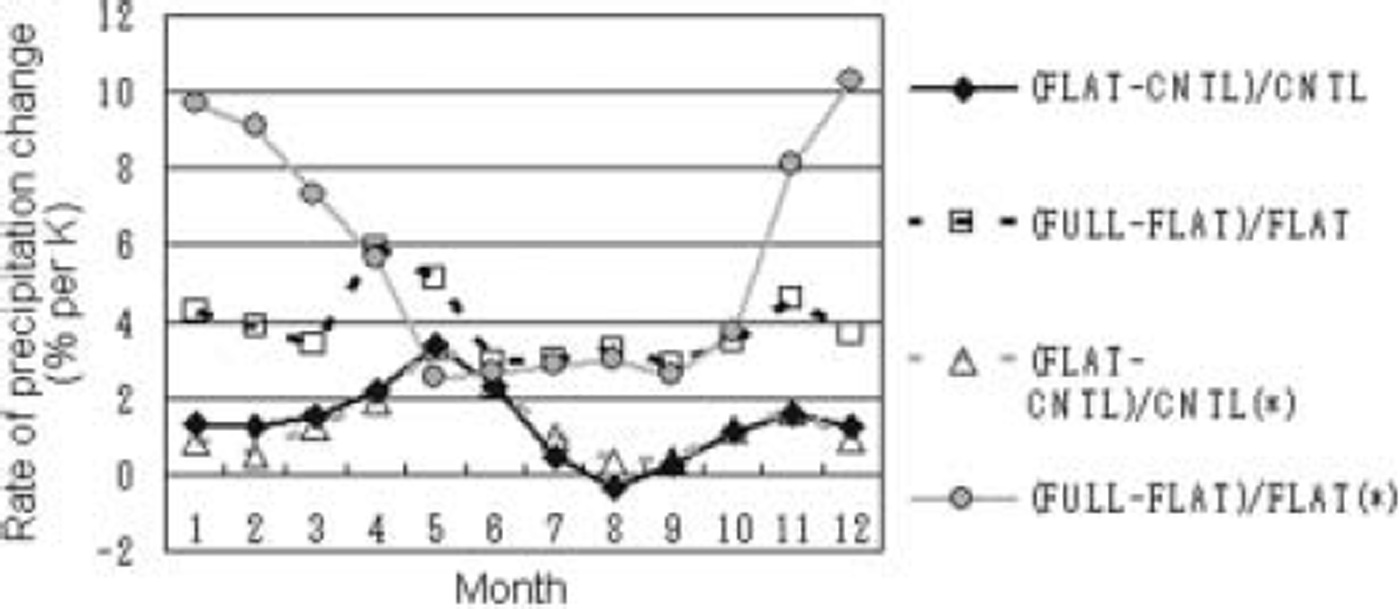
As the parameterization uses the annual mean rate for every month, the large summer precipitation is underestimated. As a result, the parameterized annual precipitation becomes smaller than the AGCM result, and the volume of the steady-state Laurentide ice sheet is underestimated compared to the AGCM result (Exp4). Figure 5 shows that the annual precipitation is higher than the annual mean rate (1.7%K–1 and 5.3% K–1) when the monthly rates are adopted. This increase compensates for the difference between the precipitation of the AGCM and that parameterized using the annual mean rate (1.7%K–1 and 5.3%K–1) when the regional variation is taken into account (Dev1 and Dev2). The ice-sheet volume in Exp8, which employs the seasonally varying rate, is close to that of Exp3.
Summary and Discussion
In the present work, the change in precipitation due to the effects of ice sheets and other factors at the LGM were simulated through AGCM experiments using different boundary conditions. As in previous studies, the coefficients of a parameterization with respect to surface temperature were estimated. The steady-state Laurentide ice sheet was also simulated using a 3-D ice-sheet model, and the precipitation was estimated from different parameterizations and the AGCM result. It was found that the annual precipitation averaged over the Laurentide ice sheet, estimated by a parameterization using the rate determined by the AGCM, is much smaller than that predicted by the AGCM FULL experiment, leading to an underestimation of the volume of the steady-state Laurentide ice sheet. Furthermore, the ratio of precipitation change was found to depend on the location of the ice sheets, indicating that ice-core data such as those of Vostok, Antarctica, and GRIP and GISP, Greenland, cannot be applied to other ice sheets such as the Laurentide and Scandinavian ice sheets. By separating the influences on precipitation over the Laurentide ice sheet into two parts, the ratio of precipitation change unrelated to surface elevation change was found to be 1.7% K–1, while the rate due directly to elevation change is 5.3% K–1. This difference can be attributed to interior desertification as a result of ice-sheet topography.
The regionality of the rate of precipitation change, due to factors such as interior desertification and the concentration of storm tracks and which is not considered in the conventional parameterization, was found to increase the annual precipitation. Although this result does not affect the estimated steady-state volume of the Laurentide ice sheet, it does have a larger influence on the ice-sheet topography compared to the other effects. This regionality promotes the southward advance of the Laurentide ice sheet at the LGM, and is therefore important when discussing the growth and maintenance of the Laurentide ice sheet. The rate was also shown to change seasonally by about 3%K–1 based on the AGCM experiments. This seasonal variation is not considered in the conventional parameterizations, which adopt the annual mean rate for every month, resulting in an underestimation of summer precipitation and hence underestimation of the annual precipitation and ice-sheet volume. As it is difficult to express such seasonal and regional variations in the rate of precipitation change by a conventional parameterization defined in reference to surface temperature, the authors suggest, based on the present results, that an AGCM should be asynchronously coupled with the ice-sheet model (Reference Charbit, Ritz and RamsteinCharbit and others, 2002), or that a range of uncertainty should be assumed for the rate of precipitation change.
Acknowledgements
We thank D. Dahl-Jensen (Scientific Editor) and two reviewers for their useful and thoughtful comments.



