INTRODUCTION
Plant architecture is the three-dimensional organization of the aboveground plant parts. It encompasses, for example, branching pattern, plant height (PH) and the arrangement of leaves and fruit branches. Plant architecture is of major agronomic importance as it determines the adaptability of a plant to cultivation, its harvest index and potential yield (Reinhardt & Kuhlemeier Reference Reinhardt and Kuhlemeier2002; Yang & Hwa Reference Yang and Hwa2008). Plant breeders have paid special attention to plant architecture for centuries in varietal improvement. For example, the global production of cereal grains has doubled owing to the great success of the Green Revolution, which created high-yielding cultivars with shorter and sturdier stems in rice and wheat by the modification of plant architecture (Peng et al. Reference Peng, Richards, Hartley, Murphy, Devos, Flintham, Beales, Fish, Worland, Pelica, Sudhakar, Christou, Snape, Gale and Harberd1999). However, plant architecture traits are known as quantitative traits, controlled by many genes, and it is difficult to attain ideal plant architecture through conventional artificial selection (Reinhardt & Kuhlemeier Reference Reinhardt and Kuhlemeier2002). Elucidation of the genetic mechanisms underlying plant architecture will provide a solid basis for its modification. Quantitative trait locus/loci (QTL) mapping based on molecular marker technology is a powerful tool for elucidating the genetic basis of quantitatively inherited traits. To date, QTL mapping analysis has been successfully used to study plant architecture in many crop species such as rice (Kanbe et al. Reference Kanbe, Sasaki, Aoki, Yanagishi, Ebitani, Yano and Ohsugi2008; Jiao et al. Reference Jiao, Wang, Xue, Wang, Yan, Liu, Dong, Zeng, Lu, Zhu, Qian and Li2010; Wang et al. Reference Wang, Zhou, Yu and Yu2011), maize (Tang et al. Reference Tang, Teng, Yan, MA, Meng, Dai and Li2007; Xu et al. Reference Xu, Cai, Lv, Dai, Wang, Wang, Sun and Tan2009; Ku et al. Reference Ku, Zhao, Zhang, Wu, Wang, Wang, Zhang and Chen2010) and wheat (Wang et al. Reference Wang, Wu, Ren, Chang, Li and Jing2010; Liu et al. Reference Liu, Xu, Ni, Xie, Qin, Li, Lu, Zhang, Peng and Sun2011).
Improvement in the yield and quality of cotton fibre has been extremely important in recent years because of the demands of cotton producers as well as the textile industry (Shen et al. Reference Shen, Guo, Zhu, Yuan, Yu, Kohel and Zhang2005). Plant architecture breeding programmes are an effective way to improve cotton fibre yield and quality (Wang et al. Reference Wang, Wu, Huang, Zhu, Guo and Zhang2006; Song & Zhang Reference Song and Zhang2009). Cotton plant architecture is determined by a combination of factors including PH, stem node length (SNL), stem internode length (SIL), total fruit branches (TFB), effective fruit branches (EFB), fruit branch length (FBL), fruit branch nodes (FBN), fruit branch internode length (FBIL), total fruit branch nodes (TFN) and fruit branch angle (FBA), etc. A few QTL have been reported for several cotton plant architecture traits in different studies. Zhang et al. (Reference Zhang, Zhu, Guo, Yu and Zhang2006) detected three QTL for PH, two for FBL and three for ratio of PH to FBL in a recombinant inbred lines (RILs) population of Gossypium hirsutum. Wang et al. (Reference Wang, Wu, Huang, Zhu, Guo and Zhang2006) identified three QTL for FBL and one for ratio of PH to FBL in another RIL population of G. hirsutum. Song & Zhang (Reference Song and Zhang2009) detected 26 QTL dispersed over 15 chromosomes in an interspecific population between G. hirsutum and G. barbadense for six plant architecture traits: first fruiting branch position, stem leaf size, PH, SIL, FBA and FBIL. However, comparison of QTL for the same plant architecture trait from different studies revealed that few common QTL have been reported due to a lack of common markers among populations.
In the present study, two new F2:3 mapping populations in G. hirsutum were developed and QTL mapping was conducted for the 10 cotton plant architectural traits – PH, SNL, SIL, TFB, EFB, FBL, FBN, FBIL, TFN and FBA – to (i) identify novel QTL for cotton plant architectural traits and (ii) screen the common QTL affecting plant architecture traits across different populations. The research provides valuable information for the genetic basis analysis and marker-assisted selection (MAS) of cotton plant architecture traits.
MATERIALS AND METHODS
Plant materials
Three cultivated varieties of G. hirsutum, Baimian2, TM-1 and CIR12, were chosen for molecular tagging of QTL for 10 plant architectural traits. Baimian2 is an early-maturing variety bred by the Henan Institute of Science and Technology using the pedigree method (Zhu et al. Reference Zhu, Wang, Guo, Gao and Gan2008), TM-1 is a genetic standard line of upland cotton and exhibits a late-maturing phenotype in the Yangtze River basin, the Yellow River basin and the north-western inland of China (Kohel et al. Reference Kohel, Richmond and Lewis1970; Ai et al. Reference Ai, Zhu, Guan, Zhao and Zhang2010; Li et al. Reference Li, Li, Wang, Dong and Zhang2011) and CIR12 is a middle-maturing variety bred by the Cotton Research Institute at the Chinese Academy of Agricultural Sciences (Tan & Liu Reference Tan and Liu1990). The early-maturing variety exhibits generally compact plant architecture with decreased PH, shortened internodes and fruit branches and so on. The middle-maturing and late-maturing varieties, however, exhibit generally expanded plant architecture with increased PH, internodes and fruit branches (Yu & Huang Reference Yu and Huang1990). TM-1 and CIR12 were used as male parents in crosses with Baimian2, during the summer of 2008 at the Breeding Station of Henan Institute of Science and Technology (BS-HIST) (113°52′E, 35°18′N, 95 m asl), Xinxiang, Henan, China. During the winter of 2008, the F1 plants were self-pollinated to produce the F2 in Hainan Island (109°30′E, 18°15′N, 7 m asl), China. In the summer of 2009, F2 individual plants from a single F1 hybrid were self-pollinated to develop F2:3 families at BS-HIST. Then two F2:3 families derived from (Baimian2 × TM-1) F2 and (Baimian2 × CIR12) F2 – which consisted of 220 and 208 plants, respectively – along with their parents, were grown in two fully randomized block replications and 15 plants in each row (0·8 × 5 m) in the summer of 2010 at BS-HIST. Field management was carried out following standard commercial practices. For ease of description, the two F2:3 families derived from Baimian2/TM-1 and Baimian2/CIR12 were designated POP I and POP II, respectively.
Field experiment and phenotypic evaluation
To reduce environmental error, 10 strains per F2:3 family lines were evaluated for the corresponding F2 individual and the average value of two replications was used in statistical analysis and QTL mapping. Ten plant architecture traits of both F2:3 families along with their parents were measured, which included the following: PH, SNL, SIL, TFB, EFB, FBL, FBN, FBIL, TFN and FBA. Statistical analysis of the phenotypic data was performed using SPSS 17.0 software (SPSS, Chicago, USA).
Marker analysis
The DNA was extracted as described by Paterson et al. (Reference Paterson, Brubaker and Wendel1993). A total of 4083 simple sequence repeat (SSR) primers, including BNL, CER, CGR, CIR, CM, COT, DPL, DC, GH, HAU, JESPR, MUCS, MUSB, MUSS, MGHES, NAU, SHIN, STV and TMB series, were selected to screen polymorphisms between parents. These primers were selected mainly from the published cotton interspecific and intraspecific maps (Nguyen et al. Reference Nguyen, Giband, Brottier, Risterucci and Lacape2004; Guo et al. Reference Guo, Cai, Wang, Han, Song, Wang, Niu, Wang, Lu, Shi and Zhang2007; Qin et al. Reference Qin, Guo, Zhang and Zhang2008), as well as the reported SSR markers linked to QTL contributing to important traits in cotton (Zhang et al. Reference Zhang, Yuan, Yu, Guo and Kohel2003; Mei et al. Reference Mei, Syed, Gao, Thaxton, Smith, Stelly and Chen2004; Li et al. Reference Li, Guo, Ma and Zhang2008). The primer sequences were mostly downloaded from the Cotton Marker Database (CMD; http://www.cottonmarker.org) and synthesized by Nanjing Jinsirui Biology Engineering Co. Ltd. The polymorphic primers screened from parents were used to analyse the genotype of F2 individuals. The protocol for polymerase chain reaction (PCR) amplification and examination followed that of Zhang et al. (Reference Zhang, Guo and Zhang2002).
Linkage map construction and QTL analysis
A chi-square test was performed to determine if the allele frequency at each individual marker locus segregated normally. JoinMap 3.0 (Van Ooijen & Voorrips Reference Van Ooijen and Voorrips2001) was employed to construct the linkage map. A logarithm of odds (LODs) threshold of 3·0 and a 50 centimorgan (cM) maximal distance were used to determine all linkage groups. The QTL mapping and their effects were carried out using the composite interval mapping method (Zeng Reference Zeng1994) of Windows QTL cartographer version 2.5 software (Basten et al. Reference Basten, Weir and Zeng2001). A stringent likelihood ratio (LR) threshold of ⩾13·8 (equal to LOD score 3·0) was used to declare significant QTL in order to keep the likelihood of even one false positive below 5% in the large genome of cotton (Jiang et al. Reference Jiang, Wright, El-Zik and Paterson1998). Meanwhile, LR scores of 9·2–13·8 (equal to LOD score 2·0–3·0) were used to detect suggestive QTL, as suggested by Lander & Kruglyak (Reference Lander and Kruglyak1995). In addition, the QTL with a LOD value greater than or equal to the threshold value calculated by a permutation test with 1000 repetitions was also defined as a significant QTL (Churchill & Doerge Reference Churchill and Doerge1994). Maps were drawn using MapChart version 2.1 software (Voorrips Reference Voorrips2006).
Nomenclature of the QTL followed the protocol used in rice (McCouch et al. Reference McCouch, Cho, Yano, Paul, Blinstrub, Morishima and Kinoshita1997), starting with ‘q’, followed by an abbreviation of the trait name (e.g. PH for plant height and FBL for fruit branch length) and the name of chromosome or linkage group, and distinguishing the different QTL detected for the same trait on the same linkage group using ‘a’, ‘b’, ‘c’, etc. Linkage groups were assigned to chromosomes based on anchored markers in the dense linkage map (Han et al. Reference Han, Guo, Song and Zhang2004; Guo et al. Reference Guo, Cai, Wang, Han, Song, Wang, Niu, Wang, Lu, Shi and Zhang2007). When no chromosome inference was available, the linkage group was designated LGX.
RESULTS
Trait performance
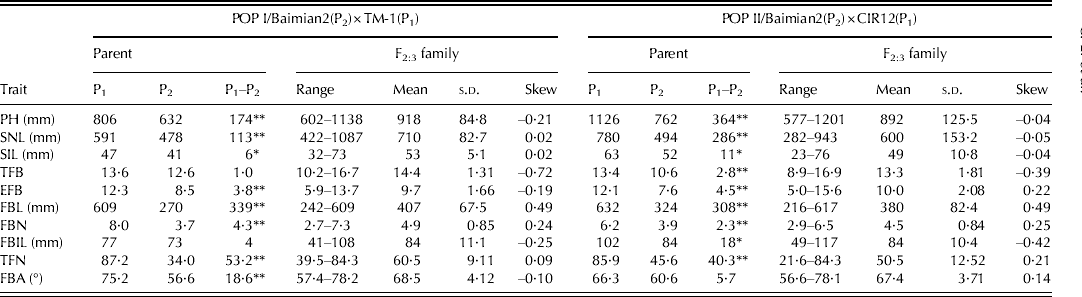
Performances of plant architecture traits of parents and F2:3 families are shown in Table 1. Values of all traits were higher in TM-1 and CIR12 than the same trait values in Baimian2. Among the 10 traits, there were significant or highly significant differences between TM-1 and Baimian2, except for TFB and FBIL, and between CIR12 and Baimian2 except for FBA – suggesting that the parents selected in the present study were ideal to search for the genes responsible for plant architecture traits. Statistical analysis of plant architecture traits for F2:3 families showed that all traits displayed transgressive segregation, and skewness of all traits was <1, which is consistent with the normal distribution characteristics of quantitative traits, indicating that these two populations were suitable for QTL mapping for the target traits.
Performances of plant architecture traits of parents and F2:3 families

PH = plant height; SNL = stem node length; SIL = stem internode length; TFB = total fruit branches; EFB = effective fruit branches; FBL = fruit branch length; FBN = fruit branch nodes; FBIL = fruit branch internode length; TFN = total fruit nodes; FBA = fruit branch angle.
*,** P = 0·05 and 0·01, respectively.
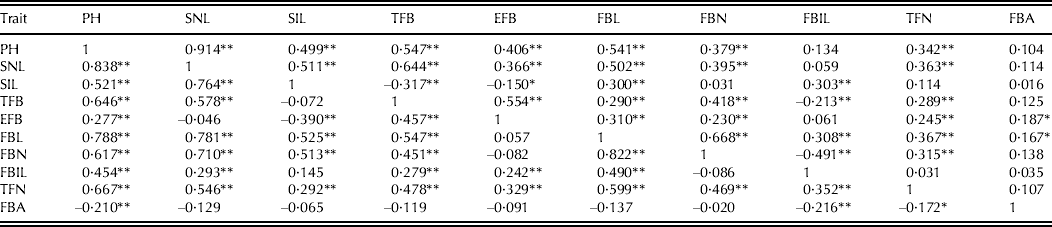
Correlations were calculated for all traits evaluated in the two F2:3 populations (Table 2). Most traits were significantly and positively correlated with other traits. Significant negative correlations were also detected between TFB and SIL, FBIL and TFB, and FBIL and FBN in POP I; PH and FBA, FBA and FBIL, and FBA and TFN in POP II; and EFB and SIL in both populations.
Correlation analysis among plant architecture traits in F2:3 families of the two populations
Correlation between traits in POP I (Baimian2 × TM-1) and POP II (Baimian2 × CIR12) are shown in the top right and bottom left, respectively; *, ** P = 0·05 and 0·01, respectively.
See Table 1 for abbreviations.
Simple sequence repeat data analysis and linkage map construction
Parents were screened for polymorphism using 4083 SSR primers. Loci with obvious segregation distortion were excluded to construct the linkage map (data not shown). Finally, the genetic map for POP I comprised 43 linkage groups with 269 loci covering 1837·8 cM, which was estimated as 36·76% of the total recombination length of the cotton genome, with an average marker interval of 6·9 cM. The genetic map for POP II comprised 33 linkage groups with 127 loci covering 1244·3 cM, which was estimated as 24·89% of the total recombination length of the cotton genome, with an average marker interval of 9·8 cM. Some linkage groups failed to be assigned to any chromosome. Taking into account the objective of the present study, only those linkage groups associated with the detected QTL are presented.
Quantitative trait loci mapping of plant architecture traits
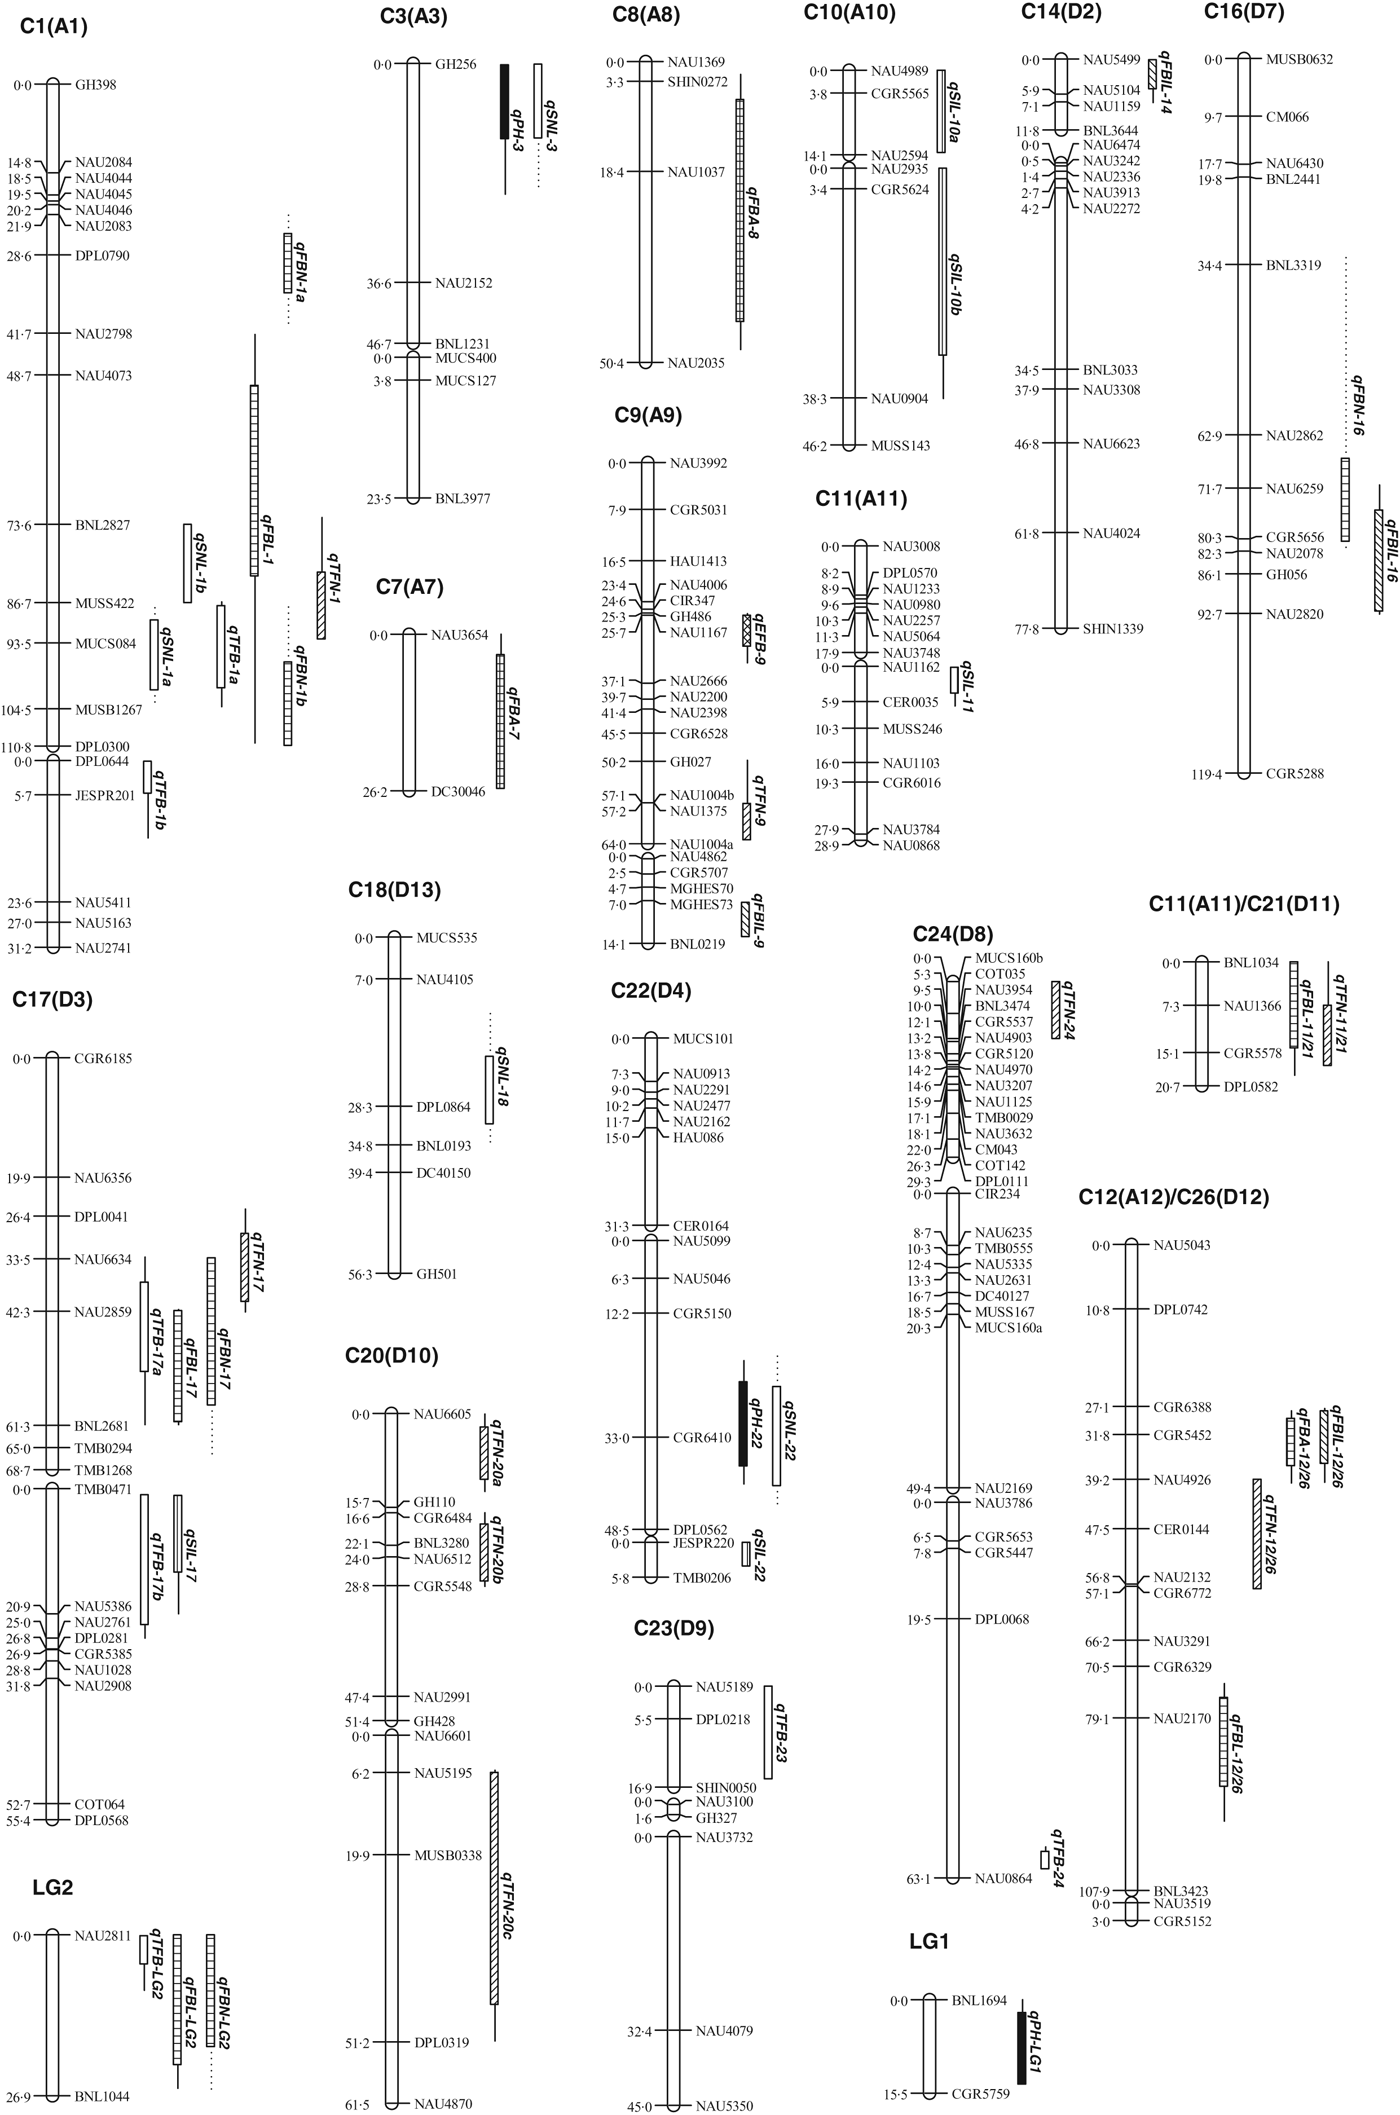
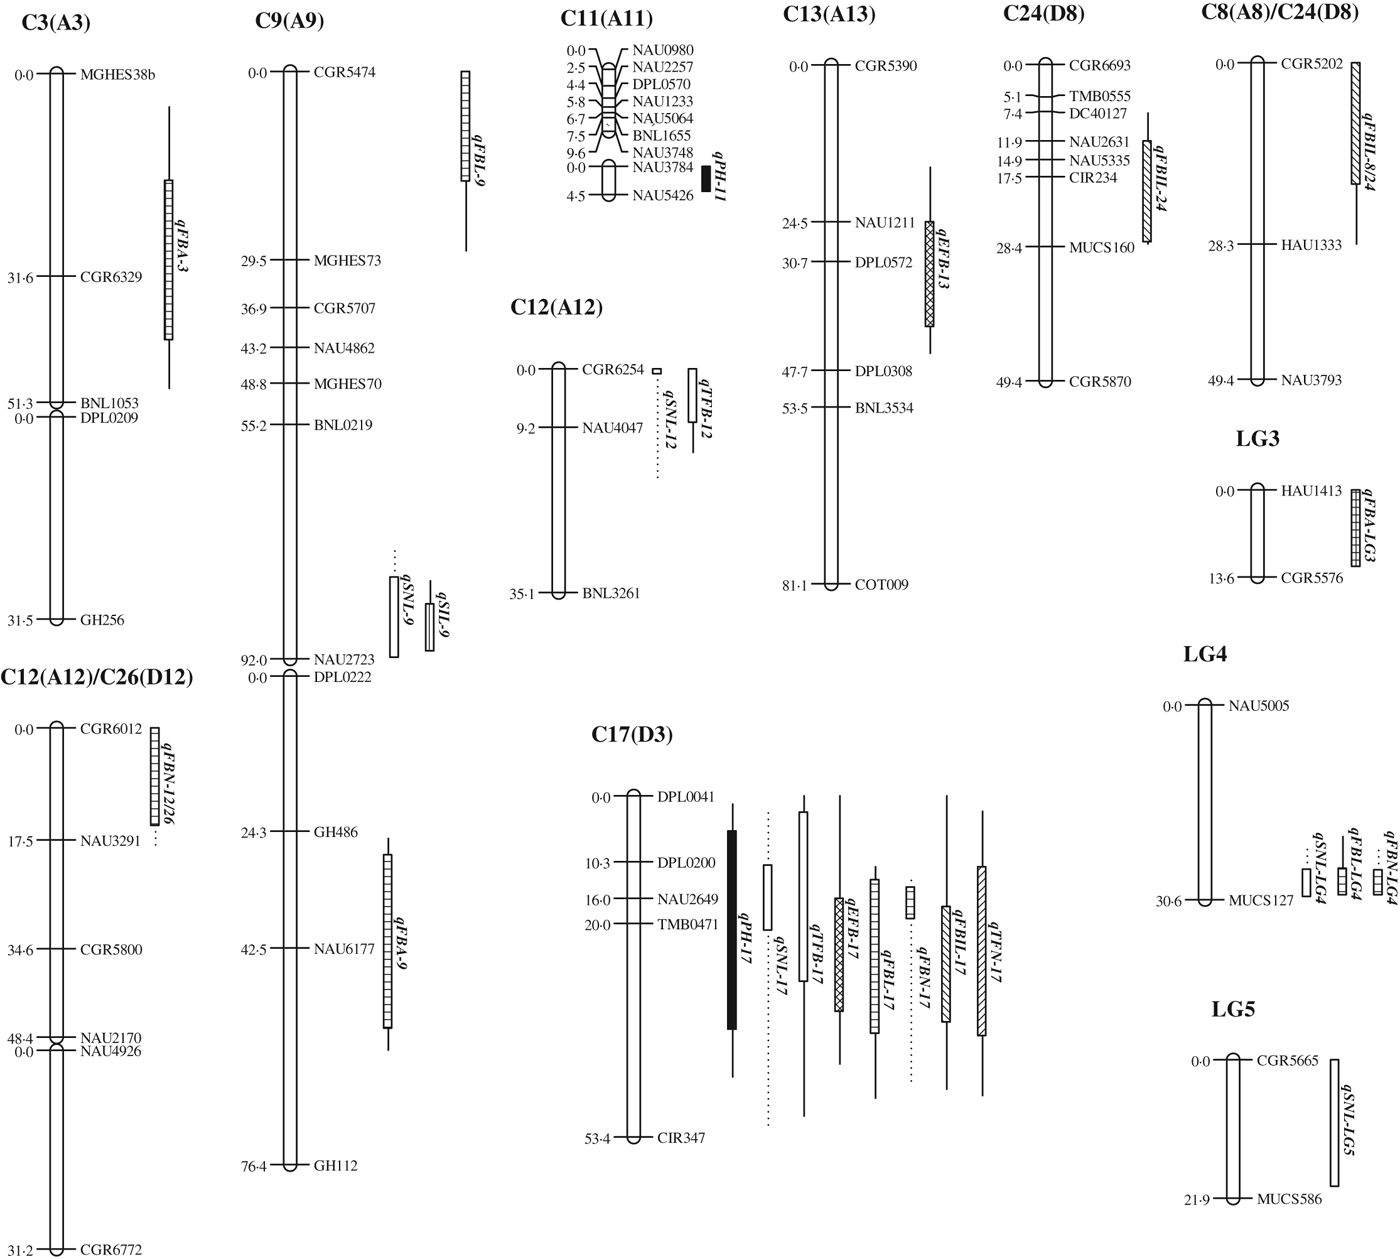
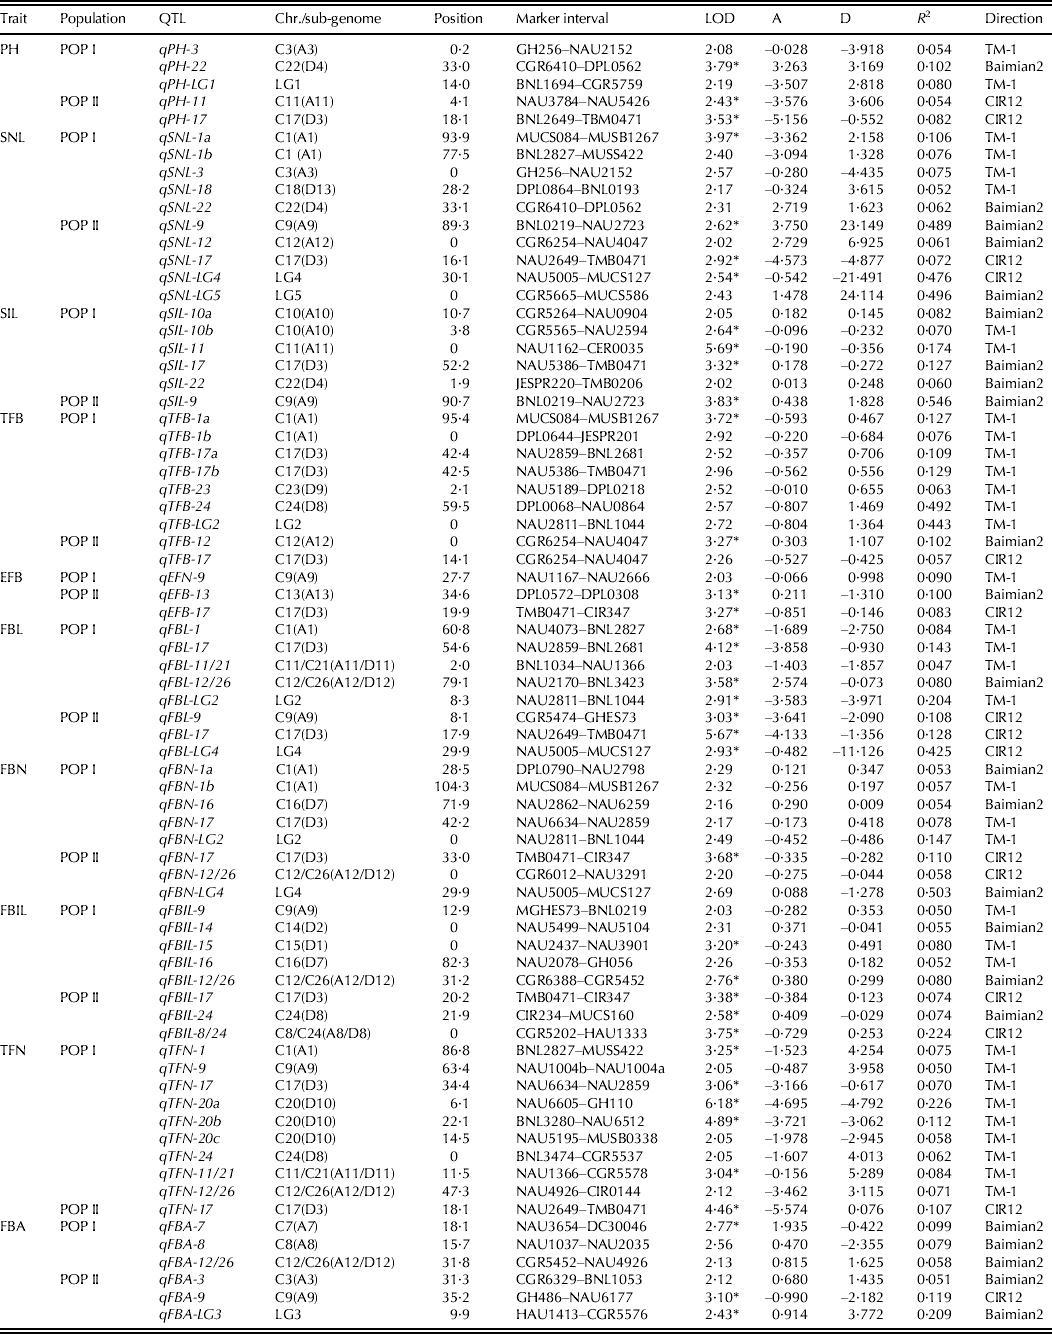
A summary of all QTL detected in both populations is shown in Table 3. Their locations on the linkage map and confidence intervals are shown in Figs 1 and 2.
Location of QTL for plant architecture traits on part linkage groups from POP I (Baimian2 × TM-1). Bars and whiskers indicate 1-LOD and 2-LOD QTL likelihood intervals, respectively.
Location of QTL for plant architecture traits on part linkage groups from POP II (Baimian2 × CIR12). Bars and whiskers indicate 1-LOD and 2-LOD QTL likelihood intervals, respectively.
Characteristics of QTL for plant architecture traits detected in the two populations
* LOD score is higher than 3 and/or the threshold calculated by permutation test; A = additive effect; D = dominant effect; R 2 = phenotypic variation explained by a single QTL; direction means the parent provides gene facilitating plant architecture traits.
See Table 1 for abbreviations.
Plant height
Five QTL for PH were identified, each explaining 0·054–0·102 of the phenotypic variation (PV), with LOD scores in the range 2·08–3·79. Among these five QTL, one significant QTL, qPH-22, explaining 0·102 of the PV, conferred by Baimian2 allele was detected on C22 (D4) in POP I, and two significant QTL, qPH-11 on C11 (A11) and qPH-17 on C17 (D3), explaining 0·054 and 0·082 of the PV, respectively, conferred by CIR12 alleles were detected in POP II. In addition, two suggestive QTL originating from TM-1 on C3 (A3) and LG1 were identified in POP I.
Stem node length
Ten QTL for SNL were detected, with five detected in POP I and five in POP II. These 10 QTL were distributed on nine chromosomes, which had LOD scores of 2·02–3·97. In POP I, one significant QTL, qSNL-1a, was detected on C1 (A1), which explained 0·106 of the PV, and four suggestive QTL were also identified. At these five QTL, four alleles leading to an increase in SNL were contributed by TM-1. In POP II, three significant QTL, qSNL-9, qSNL-17 and qSNL-LG4, and two suggestive QTL, qSNL-12 and qSNL-LG5, were identified, and they explained 0·489, 0·072, 0·476, 0·061 and 0·496 of the PV, respectively. At these five QTL, increased SNL value was conferred by Baimian2 or CIR12 alleles.
Stem internode length
Six QTL were detected for SIL with LOD scores in the range 2·02–5·69. Among them, in POP I, three significant QTL, qSIL-10b, qSIL-11 and qSIL-17, and two suggestive QTL, qSIL-10a and qSIL-22, were detected on C10 (A10), C11 (A11), C17 (D3), C10 (A10) and C22 (D4), respectively, with 0·060–0·174 of the PV explained. At these five QTL, Baimian2 and TM-1 contributed three and two alleles that led to an increase, respectively. In POP II, one significant QTL conferred by Baimian2 allele, qSIL-9, was detected on C9 (A9) with 0·546 of the PV.
Total fruit branches
Nine QTL for TFB were detected in the two populations, and explained 0·057–0·492 of the PV, with LOD scores in the range 2·26–3·72. Among these QTL, one significant QTL on C1 (A1) and six suggestive QTL on C1 (A1), C17 (D3), C17 (D3), C23 (D9), C24 (D8) and LG2 were identified in POP I; and one significant QTL on C12 (A12) and one suggestive QTL on C17 (D3) were detected in POP II. Increased TFB were conferred by TM-1 alleles at all these seven loci in POP I, and by Baimian2 or CIR12 in POP II.
Effective fruit branches
Three QTL were detected for EFB on three chromosomes with LOD scores in the range 2·03–3·27. In POP I, only one suggestive QTL contributed by TM-1 was detected, with 0·090 of the PV. In POP II, two significant QTL, qEFB-13 and qEFB-17, were detected which explained 0·100 and 0·083 of the PV, respectively. The direction of additive effect at qEFB-13 originated from Baimian2, and qEFB-17 from CIR12.
Fruit branch length
Eight QTL were detected for FBL with LOD scores in the range 2·03–5·67. Four significant QTL, qFBL-1 on C1 (A1), qFBL-17 on C17 (D3), qFBL-12/26 on C12A/C26 (12/D12) and qFBL-LG2 on LG2, and one suggestive QTL, qFBL-11/21 on C11/C21 (A11/D11), were identified in POP I, with 0·084, 0·143, 0·080, 0·204 and 0·047 of the PV, respectively. Among these five QTL, four QTL had the same direction of additive effect originating from TM-1. In POP II, three significant QTL, qFBL-9 on C9 (A9), qFBL-17 on C17 (D3), and qFBL-LG4 on LG4 were identified, which explained 0·108, 0·128 and 0·425 of the PV, respectively. These three QTL had the same direction of additive effect originating from CIR12.
Fruit branch nodes
Eight QTL for FBN were detected in the two populations, and explained 0·053–0·503 of the PV, with LOD scores in the range 2·16–3·68. In POP I, five suggestive QTL were identified on C1 (A1), C1 (A1), C16 (D7), C17 (D3) and LG2, respectively. In POP II, one significant QTL, qFBN-17 on C17 (D3), explaining 0·110 of the PV, was detected, and two suggestive QTL, qFBN-12/26 on C12/C26 (A12/D12) and qFBN-LG4 on LG4 were also detected. At all these eight loci, increased FBN were not always conferred by the high-valued parents, TM-1 or CIR12.
Fruit branch internode length
Eight QTL for FBIL were detected. In POP I, two significant QTL, qFBIL-12/26 on C12/C26 (A12/D12) and qFBIL-15 on C15 (D1) were detected with 0·080 of the PV. Increased FBIL was conferred by Baimian2 allele at qFBIL-12/26 and TM-1 allele at qFBIL-15. Three suggestive QTL were also detected in POP I on C9 (A9), C14 (D2) and C16 (D7), respectively. In POP II, three significant QTL, qFBIL-24 on C24 (D8), qFBIL-17 on C17 (D3) and qFBIL-8/24 on C8/C24 (A8/D8), were identified, and explained 0·074, 0·074 and 0·224 of the PV, respectively. The additive effect of these three QTL had opposite directions.
Total fruit nodes
Ten QTL for TFN were identified on seven chromosomes, each explaining 0·050–0·226 of the PV, with LOD scores in the range 2·05–6·18. Among them, five significant QTL, qTFN-1, qTFN-17, qTFN-20a, qTFN-20b and qTFN-11/21, were anchored on C1 (A1), C17 (D3), C20 (D10), C20 (D10) and C11/C21 (A11/D11) in POP I and explained 0·075, 0·070, 0·226, 0·112 and 0·084 of the PV, respectively. Four suggestive QTL were also detected in POP I. In POP II, one significant QTL qTFN-17 on C17 (D3) was detected, which explained 0·107 of the PV. These 10 QTL had the same direction of additive effect originating from high-valued parents TM-1 in POP I and CIR12 in POP II.
Fruit branch angle
Six QTL for FBA were detected. Among them, one significant QTL on C7 (A7) with 0·099 of the PV and two suggestive QTL on C12/C26 (A12/D12) and C8 (A8) with 0·058 and 0·079 of the PV were detected in POP I, respectively. Baimian2 contributed alleles leading to an increase in FBA at these three loci. A total of three QTL were detected in POP II, of which qFBA-9 on C9 (A8) and qFBA-LG3 on LG3 were significant QTL with 0·119 and 0·209 of the PV, respectively, and increased FBA was conferred by CIR12 allele at qFBA-9, and Baimian2 allele at qFBA-LG3.
DISCUSSION
Cotton plant architecture is an important agronomic trait that affects yield and quality. Breeders have paid special attention to plant architecture in cotton breeding programmes. For example, the successful breeding of high-yielding cotton varieties Simian 3 and Baimian 1 was based on the modification of plant architecture with moderate PH and leaf size, sturdy main-stem, narrower FBA and optimum FBIL (Zhang et al. Reference Zhang, Zhu, Guo, Yu and Zhang2006; Li et al. Reference Li, Wang, Dong, Fu, Zhang and Lian2010). The results of previous research have demonstrated that cotton lint yield was increased by pursuing cotton plant architectural breeding. However, complex multigenic relationships and substantial genotype × environment interactions underlying plant architecture will hinder an efficient improvement of these traits in conventional breeding programmes. Quantitative trait loci mapping analysis provides an efficient tool for identifying the genetic basis of plant architectural traits and can aid in the modification of agronomically relevant traits. Many parameters, such as PH, SNL, SIL, TFB, EFB, FBL, FBN, FBIL, TFN and FBA, can be used to evaluate the efficiency of cotton plant architecture. In the present study, two F2:3 populations of upland cotton were developed to map QTL for plant architecture traits. A total of 73 QTL (37 significant and 36 suggestive) were detected in both F2:3 populations. Among them, five QTL were for PH, 10 for SNL, six for SIL, nine for TFB, three for EFB, eight for FBL, eight for FBN, eight for FBIL, 10 for TFN and six for FBA. These QTL data will be helpful in determining the genetic basis of cotton plant architecture.
The phenomenon of QTL cluster has previously been reported in cotton (Mei et al. Reference Mei, Syed, Gao, Thaxton, Smith, Stelly and Chen2004; Wang et al. Reference Wang, Wu, Huang, Zhu, Guo and Zhang2006; Song & Zhang Reference Song and Zhang2009) and this also occurred in the present study. A total of 12 intervals were found to be involved in the control of two or more traits, and eight intervals located on C1 (A1), C3 (A3), C11/C21 (A11/D11), C12/C26 (A12/D12), C17 (D3), C22 (D4), C16 (D7) and LG2 in POP I and four intervals on C9 (A9), C12 (A12), C17 (D3) and LG4 in POP II. The universal existence of QTL clusters explains why so many traits are highly correlated with each other. Generally, the cluster of overlapped QTL for different target traits could be explained by pleiotropic effects of single genes or by close physical linkage of genes controlling different traits (Yamamoto et al. Reference Yamamoto, Yonemaru and Yano2009; Thumma et al. Reference Thumma, Southerton, Bell, Owen, Henery and Moran2010). In-depth evidence for this requires QTL analysis based on a more saturated genetic map.
Common QTL, which can be detected through multiple generations or different populations, has high reliability and can enhance the efficiency and accuracy in MAS. In cotton, Shen et al. (Reference Shen, Guo, Zhu, Yuan, Yu, Kohel and Zhang2005) carried out QTL mapping for fibre quality traits across three diverse lines, and the results indicated at least three common QTL in two populations. Qin et al. (Reference Qin, Liu, Mei, Zhang and Guo2009) detected eight common QTL for four fibre quality traits in two populations. Sun et al. (Reference Sun, Zhang, Wang, Gong, Shi, Liu, Li, Gong, Shang and Yuan2012) detected two common QTL for fibre strength that could be expressed simultaneously in three generations and four environments. A few common QTL have been successfully used for MAS (Guo et al. Reference Guo, Zhang, Ding, Zhu, Shen and Zhu2005). Some QTL have been reported for cotton plant architecture traits to date (Wang et al. Reference Wang, Wu, Huang, Zhu, Guo and Zhang2006; Zhang et al. Reference Zhang, Zhu, Guo, Yu and Zhang2006; Song & Zhang Reference Song and Zhang2009). However, few of them have been confirmed through multiple generations or different populations. In the present study, the comparison of QTL across the two populations showed that four QTL (significant or suggestive), qTFN-17, qFBN-17, qFBL-17 and qTFB-17a/qTFB-17b (qTFB-17), were common QTL. They were all located close to the common markers DPL0041 and/or TMB0471 on C17 (D3) in the two populations. Moreover, the direction of additive effect for all these QTL originated from the high-valued parents, TM-1 or CIR12. Therefore, these four QTL should have high reliability and could be utilized for MAS to facilitate cotton plant architecture. Although only four common QTL were detected in the present study, a strong genetic correlation existed among plant architecture traits, indicating that utilizing the markers linked to four common QTL for individual traits can simultaneously improve several related traits. It was encouraging to note that two common QTL, qTFN-17 and qFBL-17, were both significant QTL in both populations, and moreover, they explained >0·100 of the PV in at least one population. These two QTL should be considered preferentially in MAS. In comparison with the results of other studies, a total of four QTL, qFBIL-16 for FBIL on C16 (D7) and qSIL-11 for SIL on C11 (A11) in POP I, and qFBIL-17 for FBIL on C17 (D3) and qFBA-3 for FBA on C11 (A11) in POP II, were respectively on the same chromosomes as that of Song & Zhang (Reference Song and Zhang2009). It is difficult to determine whether these QTL are common due to the lack of common markers and they need to be verified in subsequent research.
Previous research on QTL mapping in cotton has reported that the direction of additive effect did not always originate from the high-valued parent (De Vicente & Tanksley Reference De Vicente and Tanksley1993; Shen et al. Reference Shen, Guo, Lu, Zhu, Yuan and Zhang2007). This phenomenon also occurred in the two populations in the present study. Among the 73 QTL detected in the two populations, the additive effects of 50 QTL originated from the high-valued parents, TM-1 or CIR12, while the other 23 QTL were from the low-valued parent, Baimian2. This indicates that even low-valued parents may harbour some alleles that increase plant architecture trait values, which might explain the occurrence of individuals with transgressive phenotypes (De Vicente & Tanksley Reference De Vicente and Tanksley1993). Thus, the synergistic alleles from high-valued and from low-valued parents can all be utilized when increasing plant architecture trait values in cotton breeding. It should be emphasized that desirable cotton plant architecture can vary with environmental conditions and cultivation practices in different regions. For instance, the expanded cotton plant architecture with increased PH and long fruit branch is ideal in dry regions with adequate light, whereas the compact cotton plant architecture is ideal in rainy areas with low light levels. Therefore, the synergistic alleles and the negative alleles can be utilized in cotton plant architecture breeding programmes according to specific breeding objectives.
Identification of the related genes for plant architecture will not only facilitate plant architecture breeding programmes but also ultimately clarify the molecular mechanisms underlying plant architecture. Quantitative trait loci mapping is an initial step towards cloning and identifying the related genes. In rice, recent advances in the cloning and characterization of related genes, such as LA1, TAC1, PROG1 and OsSPL14, by a map-based cloning approach have shed some light on the molecular mechanisms underlying plant architecture in rice (Li et al. Reference Li, Wang, Qian, Fu, Wang, Zeng, Li, Wang and LI2007; Chen et al. Reference Chen, Jiang, Yu, Zhang, Wang and Wan2008; Jin et al. Reference Jin, Huang, Gao, Yang, Shi, Zhu, Luo and LIN2008; Jiao et al. Reference Jiao, Wang, Xue, Wang, Yan, Liu, Dong, Zeng, Lu, Zhu, Qian and Li2010). This may indicate the direction for future research aiming to understand the molecular regulatory mechanisms of cotton plant architecture traits. The results of the present study may provide valuable information for further cloning and identification of related genes responsible for cotton plant architecture.
This work was supported by grants from High-tech Program 863 (2012AA101108), Achievements Transformation Project of National Agricultural Science and Technology (2010276), Research and Establishment of Modern Industrial Technology System for National Cotton (nycytx-06–09) and Key Scientific Research Project of Henan Province (092102110025, 112102110105).