



1 Introduction
The brain and the spinal cord are submerged in cerebrospinal fluid (CSF), a water-like substance that occupies the subarachnoid space and the brain’s ventricles. Magnetic resonance imaging (MRI) scans show evidence of oscillatory flows along the spinal subarachnoid space (SSS), the annular CSF-filled region that surrounds the spinal cord. These flows are driven by the time-periodic systolic expansion of the intracranial extracerebral arteries which displaces CSF from the brain into the SSS. The SSS accommodates the fluid by increasing its volume via the compression of the spinal cord and the expansion of the dura, the tissue forming the outer boundary of the SSS; see figure 1 below for a schematic showing the geometry. Typical amplitudes of the resulting pulsatile fluid velocities are in the region of 5–
 $10~\text{cm}~\text{s}^{-1}$
; see, e.g. Hentschel et al. (Reference Hentschel, Mardal, Lovgren, Linge and Haughton2010) or Bunck et al. (Reference Bunck, Kroger, Juttner, Brentrup, Fiedler, Schaarschmidt, Crelier, Schwindt, Heindel, Niederstadt and Maintz2011). The ability to alleviate pressure fluctuations in the brain via the expansion of the SSS can be severely compromised by conditions such as Chiari malformation which form an obstruction between the cranial and spinal subarachnoid spaces.
Sketch of the axisymmetric model. Cerebrospinal fluid (CSF; cyan) occupies the annular spinal subarachnoid space (SSS) which is partly occluded by a blockage. The syrinx is the fluid-filled cavity inside the spinal cord. In the top figure different colours identify the different tissues; see text for details. The fluid occupying the SSS is subject to an oscillatory pressure at the cranial end of the SSS. Note the large aspect ratio,
 $L/{\mathcal{D}}=30$
, where
 ${\mathcal{D}}=20~\text{mm}$
is the maximum outer diameter of the SSS (at its cranial end). The dashed line indicates the position of the radial slice across which we compute the volume fluxes that are documented in figure 2.

The pressure fluctuations associated with the pulsatile flow of CSF along the elastically deforming SSS have long been suspected of playing a possible role in the pathogenesis of syringomyelia – a medical condition in which one or more fluid-filled cavities (so-called syrinxes) form in the spinal cord. These syrinxes often grow over time and ultimately cause serious medical problems; see Elliott et al. (Reference Elliott, Bertram, Martin and Brodbelt2013) for a detailed recent review. Syrinxes often form near regions where the SSS is partially obstructed, for instance by Chiari malformations (see, e.g. Shaffer, Martin & Loth Reference Shaffer, Martin and Loth2011) or as a result of injuries arising from spinal trauma. This raises the question of whether such obstructions affect the flow of CSF in such a way that the formation of syrinxes is facilitated. This question motivated early theoretical studies by Carpenter and co-workers (Berkouk, Carpenter & Lucey Reference Berkouk, Carpenter and Lucey2003; Carpenter, Berkouk & Lucey Reference Carpenter, Berkouk and Lucey2003; also Cirovic Reference Cirovic2009 and Cirovic & Kim Reference Cirovic and Kim2012) who employed spatially one-dimensional models to analyse the propagation of large-amplitude pressure waves along the elastic-walled SSS. These studies were based on extensions of the classical theory of pulse wave propagation in the arteries (see van de Vosse & Stergiopulos (Reference van de Vosse and Stergiopulos2011) for a review), combining one-dimensional inviscid fluid models with so-called tube laws which describe the change in the SSS’s local cross-sectional area as a function of the local fluid pressure. One early conjecture was that the large pressures associated with the formation of ‘elastic jumps’ generated by the presence of partial obstructions in the SSS could cause damage to the cord tissue. This hypothesis was later discredited by Bertram, Brodbelt & Stoodley (Reference Bertram, Brodbelt and Stoodley2005) who were the first to analyse the system via the coupled solution of the axisymmetric Navier–Stokes equations and the equations of elasticity; Elliott, Lockerby & Brodbelt (Reference Elliott, Lockerby and Brodbelt2009) later reached the same conclusions on the basis of a one-dimensional model.
Bertram et al.’s (Reference Bertram, Brodbelt and Stoodley2005) model was subsequently refined by including a representation of (i) a syrinx (Bertram Reference Bertram2009) and (ii) an obstruction of the SSS (Bertram Reference Bertram2010), resulting in the model shown in figure 1 below. Bertram’s (Reference Bertram2010) numerical simulations of this system and Martin et al.’s (Reference Martin, Labuda, Royston, Oshinski, Iskandar and Loth2010) experimental study of a related benchtop model showed that when this system is subjected to time-periodic pressure fluctuations at its cranial end, nonlinear effects arising from fluid–structure interaction (FSI) lead to an increase in the CSF pressure in the caudal part of the SSS via what Martin et al. (Reference Martin, Labuda, Royston, Oshinski, Iskandar and Loth2010) termed the ‘valve mechanism’. Bertram (Reference Bertram2010) observed that the resulting CSF pressure distribution was such that it would tend to drive fluid from the SSS into the syrinx if the cord tissue was porous. This provides a possible explanation for why the presence of an obstruction in the SSS may induce the growth of an adjacent syrinx: the inflation of the syrinx may provide a stimulus for the subsequent remodelling of the tissue to relieve the induced mechanical stresses.
It is the aim of the present paper to assess whether the incorporation of poroelasticity into Bertram’s (Reference Bertram2010) fluid–structure interaction model does indeed result in an increase in the syrinx volume via Martin et al.’s (Reference Martin, Labuda, Royston, Oshinski, Iskandar and Loth2010) ‘valve mechanism’. The outline of the paper is as follows. In § 2 we discuss our theoretical model which is based on the coupled solution of the axisymmetric Navier–Stokes equations and the equations of isotropic poroelasticity. Following a brief discussion of the numerical solution in § 3 we present our results in § 4. We show that the ‘valve mechanism’ observed in the impermeable system persists in the presence of poroelasticity and that the resulting seepage flows do indeed result in an increase (albeit relatively small) in syrinx volume. We analyse the seepage flows and show that their structure can be captured by an analytical model which also explains how the system evolves towards its ultimate time-periodic steady state and why the increase in syrinx volume is very small. Finally, in § 5 we provide a brief summary of our results and assess the limitations of our analysis by discussing various features that are not represented in our model.
2 The model
Figure 1 shows a sketch of Bertram’s (Reference Bertram2010) axisymmetric model which forms the basis of the current study. CSF (cyan) is contained in the annular SSS the outer boundary of which is formed by the stiff dura (black). The spinal cord (grey) is a relatively soft tissue that is surrounded by a thin outer layer of increased stiffness, the pia (yellow). The cord ends in the filum (green). The syrinx is the fluid-filled cavity (cyan) inside the cord. A ‘block’ (brown) forms a partial occlusion of the SSS near the syrinx. We refer to the thin layer of tissue that separates the SSS from the syrinx as the syrinx cover. The system is subject to a time-periodic pressure,
 $P_{cranial}(t)$
, that is imposed at the cranial end of the SSS (at
 $z=0$
) and we neglect the effect of gravity.
We assume that the fluid occupying the SSS and the syrinx is incompressible, and that its velocity
 $\boldsymbol{v}$
and pressure
 $p$
are governed by the Navier–Stokes equations,
 $$\begin{eqnarray}\unicode[STIX]{x1D70C}_{fluid}\left(\frac{\unicode[STIX]{x2202}\boldsymbol{v}}{\unicode[STIX]{x2202}t}+\boldsymbol{v}\boldsymbol{\cdot }\unicode[STIX]{x1D735}\boldsymbol{v}\right)=\unicode[STIX]{x1D735}\boldsymbol{\cdot }\pmb{\unicode[STIX]{x1D70F}}\quad \text{and}\quad \unicode[STIX]{x1D735}\boldsymbol{\cdot }\boldsymbol{v}=0,\end{eqnarray}$$
where
 $\unicode[STIX]{x1D70C}_{fluid}$
is the fluid density. Assuming Newtonian behaviour, the fluid stress tensor
 $\pmb{\unicode[STIX]{x1D70F}}$
is given by
 $$\begin{eqnarray}\pmb{\unicode[STIX]{x1D70F}}=-p\boldsymbol{I}+\unicode[STIX]{x1D707}_{fluid}(\unicode[STIX]{x1D735}\boldsymbol{v}+(\unicode[STIX]{x1D735}\boldsymbol{v})^{\text{T}}),\end{eqnarray}$$
where
 $\unicode[STIX]{x1D707}_{fluid}$
is the fluid’s dynamic viscosity.
We describe the deformation of the various elastic and poroelastic tissues and the seepage flow within the latter in terms of the displacement
 $\boldsymbol{u}$
of their solid matrix, the seepage flow
 $\boldsymbol{q}$
(relative to the deforming solid matrix), and the pore pressure,
 $p_{pore}$
. The poroelastic tissues are assumed to be fully saturated with pore fluid. Using Biot’s classical isotropic linear theory of poroelasticity (see, e.g. Simon (Reference Simon1992) or Cowin (Reference Cowin1999)), these fields are governed by the momentum equation for the compound poroelastic material,
 $$\begin{eqnarray}\unicode[STIX]{x1D735}\boldsymbol{\cdot }\pmb{\unicode[STIX]{x1D70E}}=\unicode[STIX]{x1D70C}_{p.e.}~\frac{\unicode[STIX]{x2202}^{2}\boldsymbol{u}}{\unicode[STIX]{x2202}t^{2}}+\unicode[STIX]{x1D70C}_{fluid}~\frac{\unicode[STIX]{x2202}\boldsymbol{q}}{\unicode[STIX]{x2202}t},\end{eqnarray}$$
and the momentum equation for the pore fluid (Darcy’s law),
 $$\begin{eqnarray}-\unicode[STIX]{x1D735}p_{pore}-\frac{\unicode[STIX]{x1D707}_{fluid}}{k}~\boldsymbol{q}=\unicode[STIX]{x1D70C}_{fluid}~\frac{\unicode[STIX]{x2202}^{2}\boldsymbol{u}}{\unicode[STIX]{x2202}t^{2}}+\frac{\unicode[STIX]{x1D70C}_{fluid}}{\unicode[STIX]{x1D719}}\frac{\unicode[STIX]{x2202}\boldsymbol{q}}{\unicode[STIX]{x2202}t}.\end{eqnarray}$$
Here
 $k$
is the permeability,
 $\unicode[STIX]{x1D719}$
the porosity (the volume fraction occupied by the pore space), and
 $$\begin{eqnarray}\unicode[STIX]{x1D70C}_{p.e.}=(1-\unicode[STIX]{x1D719})\unicode[STIX]{x1D70C}_{solid}+\unicode[STIX]{x1D719}\unicode[STIX]{x1D70C}_{fluid}\end{eqnarray}$$
is the density of the compound, poroelastic medium which comprises the solid matrix (which is made of material that has density
 $\unicode[STIX]{x1D70C}_{solid}$
) and the embedded pore fluid. The terms on the right-hand side of (2.3) and (2.4) represent inertial effects. These arise from the accelerations of the solid matrix and the CSF fluid that flows within (and relative to) that matrix. Neglecting these terms in (2.4) we recover the classical, quasi-steady Darcy model. The stress in the compound poroelastic material is given by the constitutive equation
 $$\begin{eqnarray}\pmb{\unicode[STIX]{x1D70E}}=\pmb{\unicode[STIX]{x1D70E}}_{elast}-\unicode[STIX]{x1D6FC}~p_{pore}\boldsymbol{I},\end{eqnarray}$$
where
 $$\begin{eqnarray}\pmb{\unicode[STIX]{x1D70E}}_{elast}=\frac{E_{drained}}{(1+\unicode[STIX]{x1D708}_{drained})}\left(\frac{\unicode[STIX]{x1D708}_{drained}}{(1-2\unicode[STIX]{x1D708}_{drained})}(\unicode[STIX]{x1D735}\boldsymbol{\cdot }\boldsymbol{u})\boldsymbol{I}+\frac{1}{2}(\unicode[STIX]{x1D735}\boldsymbol{u}+(\unicode[STIX]{x1D735}\boldsymbol{u})^{\text{T}})\right)\end{eqnarray}$$
is the stress tensor for the drained solid matrix in terms of its Young’s modulus,
 $E_{drained}$
, Poisson’s ratio,
 $\unicode[STIX]{x1D708}_{drained}$
and the Biot–Willis parameter,
 $\unicode[STIX]{x1D6FC}$
.
Mass conservation requires that
 $$\begin{eqnarray}\unicode[STIX]{x1D6FC}\unicode[STIX]{x1D735}\boldsymbol{\cdot }\left(\frac{\unicode[STIX]{x2202}\boldsymbol{u}}{\unicode[STIX]{x2202}t}\right)+\unicode[STIX]{x1D735}\boldsymbol{\cdot }\boldsymbol{q}=0,\end{eqnarray}$$
so the dynamic compression/dilation of the solid matrix acts as source/sink term in the continuity equation for the pore fluid. The Biot–Willis parameter
 $\unicode[STIX]{x1D6FC}$
‘represents the ratio of the fluid volume gained (or lost) in a material element to the volume change of that element, when the pore pressure is allowed to return to its initial state’ (Detournay & Cheng Reference Detournay, Cheng and Fairhurst1993).
 $\unicode[STIX]{x1D6FC}$
is equal to one if the pore fluid and the material making up the solid matrix are both incompressible. Purely elastic (impermeable) behaviour can be recovered by setting the Biot–Willis parameter to
 $\unicode[STIX]{x1D6FC}=0$
, and by imposing
 $\boldsymbol{q}=\mathbf{0}$
and
 $p_{pore}=0$
.
2.1 Boundary conditions
Equations (2.3)–(2.8) apply throughout the various tissues (cord, pia, etc.) which have different mechanical properties as reflected in the values of their constitutive parameters, discussed in § 2.2 below. At the material interfaces between the tissues we impose continuity of traction, displacement, pore pressure and the normal component of the seepage velocity.
We set the normal component of the traction acting on the fluid at the cranial end of the SSS to the imposed oscillatory pressure,
 $P_{cranial}(t)$
, so that
 $$\begin{eqnarray}-\boldsymbol{e}_{z}\boldsymbol{\cdot }\pmb{\unicode[STIX]{x1D70F}}\boldsymbol{\cdot }\boldsymbol{e}_{z}=P_{cranial}(t)\quad \text{at }z=0,\end{eqnarray}$$
and enforce parallel inflow/outflow,
 $$\begin{eqnarray}\boldsymbol{v}\boldsymbol{\cdot }\boldsymbol{e}_{r}=0\quad \text{at }z=0.\end{eqnarray}$$
At the caudal end of the SSS we suppress any inflow/outflow by setting
 $$\begin{eqnarray}\boldsymbol{v}\boldsymbol{\cdot }\boldsymbol{e}_{z}=0\quad \text{at }z=-L.\end{eqnarray}$$
We constrain the axial motion of the dura and the cord at the cranial and caudal ends of the domain (so that
 $\boldsymbol{u}\boldsymbol{\cdot }\boldsymbol{e}_{z}=0$
at
 $z=0$
and
 $z=-L$
) but allow the tissues to expand freely in the radial direction.
At the FSI interfaces, fluid and solid interact via the continuity of traction and velocity/displacements; see, e.g. Badia, Quaini & Quarteroni (Reference Badia, Quaini and Quarteroni2009). The compound poroelastic solids are subject to the fluid traction, implying that
 $$\begin{eqnarray}\pmb{\unicode[STIX]{x1D70F}}\boldsymbol{\cdot }\boldsymbol{n}=\pmb{\unicode[STIX]{x1D70E}}\boldsymbol{\cdot }\boldsymbol{n},\end{eqnarray}$$
where
 $\boldsymbol{n}$
is the outer unit normal on the poroelastic solid, pointing into the fluid. Furthermore, the pore pressure is given by the normal component of the fluid traction,
 $$\begin{eqnarray}p_{pore}=-\boldsymbol{n}\boldsymbol{\cdot }\pmb{\unicode[STIX]{x1D70E}}\boldsymbol{\cdot }\boldsymbol{n}.\end{eqnarray}$$
The normal component of the fluid velocity at the FSI interfaces has to match the normal component of the velocity of the poroelastic solid plus the seepage flow,
 $$\begin{eqnarray}\boldsymbol{v}\boldsymbol{\cdot }\boldsymbol{n}=\left(\frac{\unicode[STIX]{x2202}\boldsymbol{u}}{\unicode[STIX]{x2202}t}+\boldsymbol{q}\right)\boldsymbol{\cdot }\boldsymbol{n}.\end{eqnarray}$$
Finally, the Beavers–Joseph–Saffman (BJS) boundary condition (Beavers & Joseph Reference Beavers and Joseph1967, Saffman Reference Saffman1971; see also Carraro et al. Reference Carraro, Goll, Marciniak-Czochra and Mikelic2013) requires that the tangential component of the fluid velocity be equal to the tangential component of the velocity of the poroelastic solid plus a slip component,
 $$\begin{eqnarray}\boldsymbol{v}\boldsymbol{\cdot }\boldsymbol{t}=\frac{\unicode[STIX]{x2202}\boldsymbol{u}}{\unicode[STIX]{x2202}t}\boldsymbol{\cdot }\boldsymbol{t}-\frac{\sqrt{k}}{\unicode[STIX]{x1D6FE}}\boldsymbol{t}\boldsymbol{\cdot }\pmb{\unicode[STIX]{x1D70F}}\boldsymbol{\cdot }\boldsymbol{n},\end{eqnarray}$$
where
 $\boldsymbol{t}$
is a unit tangent vector to the fluid–solid interface. Thus the slip velocity is proportional to the tangential shear stress exerted by the fluid onto the poroelastic solid; the slip vanishes as the inverse slip rate coefficient,
 $\unicode[STIX]{x1D6FE}^{-1}$
, goes to zero.
2.2 Parameter values
The spatial dimensions of the model were chosen to be identical to those of Bertram (Reference Bertram2010), with an overall length of
 $L=60~\text{cm}$
and a maximum outer diameter of the SSS (at the cranial end) of
 ${\mathcal{D}}=20~\text{mm}$
; see figure 1(b) for a plot of the system using a 1:1 aspect ratio. We refer to Bertram (Reference Bertram2010) for full details of the geometry. As in Bertram (Reference Bertram2010) we set the fluid and solid densities to
 $\unicode[STIX]{x1D70C}_{fluid}=\unicode[STIX]{x1D70C}_{solid}=1000\,\text{kg}~\text{m}^{-3}$
, and assumed the dynamic viscosity of the CSF to be close to that of water,
 $\unicode[STIX]{x1D707}_{fluid}=10^{-3}~\text{Pa}~\text{s}$
. The dura and pia are much stiffer than the other tissues and, again following Bertram (Reference Bertram2010), we set their (drained) Young’s moduli to
 $E_{drained}^{[dura]}=E_{drained}^{[pia]}=1.25\times 10^{6}~\text{Pa}$
while using
 $E_{drained}^{[cord]}=5\times 10^{3}~\text{Pa}$
and
 $E_{drained}^{[filum]}=E_{drained}^{[block]}=6.25\times 10^{4}~\text{Pa}$
for the other tissues.
Since we are mainly interested in the fluid transport between the SSS and the syrinx, we only considered the cord tissue (including the pia and the filum) to be porous. For simplicity we assumed that the poroelastic parameters were the same throughout the pia, filum and cord. We used a porosity of
 $\unicode[STIX]{x1D719}=0.3$
(Linninger et al.
Reference Linninger, Xenos, Zhu, Somayaji, Srinivasa Kondapalli and Penn2007), a default permeability of
 $k=10^{-13}~\text{m}^{2}$
, set the Biot–Willis parameter to
 $\unicode[STIX]{x1D6FC}=1$
and the drained Poisson’s ratio to
 $\unicode[STIX]{x1D708}_{drained}=0.35$
(Smillie, Sobey & Molnar Reference Smillie, Sobey and Molnar2005, Tully & Ventikos Reference Tully and Ventikos2011). Extensive parameter studies were performed to assess the effect of variations in the permeability; see § 4. The porosity
 $\unicode[STIX]{x1D719}$
only affects one of the inertial terms in (2.4) which, for the permeabilities and forcing frequencies considered in the present study were found to be negligible; see § 4.2. The block and the dura were modelled as impermeable, near-incompressible solids, as in Bertram (Reference Bertram2010), by setting the Biot–Willis parameter to
 $\unicode[STIX]{x1D6FC}=0$
, the Poisson’s ratio to
 $\unicode[STIX]{x1D708}_{[drained]}=0.49$
and by imposing
 $\boldsymbol{q}=\mathbf{0}$
and
 $p_{pore}=0$
throughout these tissues. The inverse slip coefficient,
 $\unicode[STIX]{x1D6FE}^{-1}$
, in the BJS boundary condition (2.15) was set to zero after confirming that it had no effect on the results; see figure 13(b) in § 4.2.
Simulations were performed using the same protocol employed in Bertram’s (Reference Bertram2010) study of the impermeable system. Starting from an initial condition in which the fluid and the solids were at rest (and the solids in their stress-free, undeformed configuration), we imposed an oscillatory pressure at the cranial end of the SSS,
 $$\begin{eqnarray}P_{cranial}(t)=\left\{\begin{array}{@{}l@{}}\widehat{{\mathcal{P}}}\sin ^{2}(2\unicode[STIX]{x03C0}t/{\mathcal{T}})\text{ for }t<{\mathcal{T}}/4\\ \widehat{{\mathcal{P}}}\sin (2\unicode[STIX]{x03C0}t/{\mathcal{T}})\text{ for }t\geqslant {\mathcal{T}}/4,\end{array}\right.\end{eqnarray}$$
and simulated the system’s behaviour for at least ten periods of the oscillation,
 $0<t<10\,{\mathcal{T}}$
. Following Bertram (Reference Bertram2010), we set the peak pressure to
 $\widehat{P}=500~\text{Pa}$
and chose the period of the oscillation as
 ${\mathcal{T}}=0.4~\text{s}$
.
When presenting results we generally non-dimensionalise all quantities on problem-specific reference values: time on the period of the oscillations,
 ${\mathcal{T}}$
; lengths on the maximum outer diameter of the SSS,
 ${\mathcal{D}}$
(as in figure 1); time-varying volumes on their initial values at
 $t=0$
; pressures on the peak forcing pressure,
 $\widehat{P}$
; velocities on the associated inertial velocity scale,
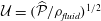
 ${\mathcal{U}}=(\widehat{P}/\unicode[STIX]{x1D70C}_{fluid})^{1/2}$
; and volume fluxes on
 ${\mathcal{U}}/{\mathcal{D}}^{2}$
. It is important to note that the large nominal Reynolds number
 $Re_{nominal}=\unicode[STIX]{x1D70C}_{fluid}{\mathcal{U}}{\mathcal{D}}/\unicode[STIX]{x1D707}_{fluid}=14,142$
formed from these quantities does not adequately describe the character of the flow. This is because the CSF only flows in the thin annular SSS (or in the even narrower gap under the block), and/or with peak velocities that are significantly smaller than
 ${\mathcal{U}}$
. The effective local Reynolds number, formed from the actual velocities and length scales (as illustrated in figure 4 below, for instance), tends to reach peak values of approximately 170, consistent with estimates obtained by Loth, Yardimci & Alperin (Reference Loth, Yardimci and Alperin2001) based on MRI images of the CSF flow in actual spinal cavities.
3 Numerical solution
The governing equations were discretised by finite elements and implemented in a fully coupled manner in oomph-lib (Heil & Hazel Reference Heil, Hazel, Schäfer and Bungartz2006). We discretised the arbitrary Lagrangian–Eulerian form of the Navier–Stokes equations using six-noded triangular Taylor–Hood elements on a moving unstructured mesh. Nodal positions in the fluid mesh were updated by the method of spines (Kistler & Scriven Reference Kistler, Scriven, Pearson and Richardson1983) by displacing fluid nodes such that they were always located at fixed fractions along straight lines that connected predetermined material reference points on the moving FSI boundaries. The traction boundary condition (2.9) was incorporated into the boundary term that arises when integrating the weak form of the axial momentum equation by parts. The equations of poroelasticity were also discretised on six-noded triangles, using an isoparametric interpolation for the solid displacements,
 $\boldsymbol{u}$
; second-order Raviart–Thomas basis functions for the seepage flux,
 $\boldsymbol{q}$
; and piecewise linear, discontinuous basis functions for the pore pressure
 $p_{pore}$
. See, e.g. Ervin (Reference Ervin2012, Reference Ervin2013) for details. The FSI traction boundary conditions (2.12) and (2.13) were incorporated into the weak form of (2.3) and (2.4), respectively, while the coupling conditions (2.14) and (2.15) were imposed on the fluid velocities by Lagrange multipliers. First- and second-order time derivatives were discretised using the implicit, second-order-accurate backward differencing (BDF2) and Newmark schemes, respectively. The resulting large system of nonlinear algebraic equations arising at each time step was solved by Newton’s method using the multifrontal direct solver MUMPS (Amestoy et al.
Reference Amestoy, Duff, Koster and L’Excellent2001) to solve the associated linear systems. All meshes were generated with Shewchuk’s (Reference Shewchuk, Lin and Manocha1996) Triangle code, with element sizes carefully adjusted to resolve the various boundary layers in the fluid and solid domains. The standard spatial discretisation involved 1.5 million degrees of freedom and time stepping was performed with a fixed time step corresponding to 80 time steps per period of the imposed oscillation in
 $P_{cranial}(t)$
. Results of spatial and temporal convergence tests and details of the code validation are presented in appendix A.
4 Results
Figure 2 shows a plot of the imposed pressure,
 $P_{cranial}(t)=p(z=0,t)$
, and illustrates the resulting redistribution of cerebrospinal fluid along the SSS and within the syrinx, using time traces of the volume fluxes through (i) the cranial end of the SSS (at
 $z=0$
); (ii) the narrow gap between the block and the cord (at
 $z/{\mathcal{D}}=-7.5$
); (iii) a radial slice through the syrinx at the same
 $z$
-position. (The location of the radial slice is indicated by the dashed line in figure 1.) The volume flux is counted as positive when it is directed into the SSS, i.e. away from its cranial end. The plot shows that, following the decay of brief initial transients, the system settles into an approximately time-periodic response, with the inflow at the cranial end of the SSS being approximately
 $46^{\circ }$
out of phase with the driving pressure, suggesting that the system’s input impedance arises through a combination of inertial, viscous and elastic effects. Approximately 50 % of the incoming volume flux passes through the narrow gap under the block into the caudal part of the SSS (dashed line in figure 2
b) while the majority of the remaining volume flux is accommodated by the expansion of the cranial part of the SSS (the seepage flow into the porous cord is too small to be observable in these plots). Bertram’s (Reference Bertram2010) simulations of the impermeable system showed the presence of a noticeable time-periodic axial ‘sloshing flow’ along the syrinx. This flow is also present in the permeable system; its magnitude is indicated by the plot of the volume flux across the radial slice through the syrinx (dash-dotted line in figure 2
b).
(a) Time trace of the non-dimensional forcing pressure,
 $P_{cranial}(t)/\widehat{{\mathcal{P}}}$
. (b) The resulting volume flux into the SSS at
 $z=0$
(black solid); through the narrow gap under the block at
 $z/{\mathcal{D}}=-7.5$
(blue dashed); through a radial slice across the syrinx at the same axial position (red dash–dotted). The location of the radial slice is indicated by the dashed line in figure 1. Time is non-dimensionalised on the period of the oscillation,
 ${\mathcal{T}}$
. The volume fluxes are scaled on
 ${\mathcal{U}}{\mathcal{D}}^{2}$
where
 ${\mathcal{U}}=(\widehat{{\mathcal{P}}}/\unicode[STIX]{x1D70C}_{fluid})^{1/2}$
is the inertial velocity scale. The volume flux is positive when it is directed into the SSS, i.e. away from its cranial end.

Four snapshots of the fluid pressure distribution (colour contours) and the tissue deformation at (a)
 $t/{\mathcal{T}}=9$
, (b)
 $t/{\mathcal{T}}=9.25$
(c)
 $t/{\mathcal{T}}=9.5$
, (d)
 $t/{\mathcal{T}}=9.75$
. For each snapshot we show the system in its actual 1:1 aspect ratio (bottom) and with the radial dimensions stretched by a factor of 10 (middle and top). In the top panel the tissue displacements are exaggerated by a factor of 20. The pressure is non-dimensionalised on the amplitude of the forcing pressure,
 $\widehat{P}$
.

The four panels in figure 3 provide a more detailed picture of the fluid–structure interaction when the system has settled into its steady state oscillation. In each of the panels, the bottom-most figure shows the fluid pressure distribution (represented by the colour contours) and the resulting solid deformation, using the system’s actual aspect ratio. The middle and top figures show the same data but with all radial dimensions increased by a factor of 10. Finally, in the top figure the solid displacements are magnified by a factor of 20 to illustrate the deformation more clearly. The periodic expansion and contraction of the cranial part of the SSS which, as discussed above, accommodates a large fraction of the incoming flow, is clearly visible. The flow through the narrow gap between the block and the cord creates a large viscous pressure drop, the magnitude of which depends on the instantaneous width of the gap.
(a,b) Contour plots of the axial (top) and radial (middle) fluid velocities, and the fluid pressure (bottom) in the SSS in the vicinity of the block, plotted using the actual aspect ratio and the same orientation as in figure 1. (a)
 $t/{\mathcal{T}}=9.25$
, (b)
 $t/{\mathcal{T}}=9.75$
. Bottom: profiles of the axial velocity in radial slices across the deforming SSS,
 $u_{z}(r,t)$
, at (c)
 $z/{\mathcal{D}}=-7.5$
(in the gap between block and cord), (d)
 $z/{\mathcal{D}}=-3$
(in the cranial part of the SSS) at eight uniformly spaced instants over the forcing period, starting at
 $t/{\mathcal{T}}=9$
. Velocities are scaled on the inertial velocity scale,
 ${\mathcal{U}}=(\widehat{{\mathcal{P}}}/\unicode[STIX]{x1D70C}_{fluid})^{1/2}$
, and the pressure on the amplitude of the forcing pressure,
 $\widehat{{\mathcal{P}}}$
.

The contour plots in figure 4(a,b) show the fluid velocity field in the SSS in the vicinity of the block at two instants when the flow is driven most rapidly towards the cranial/caudal ends of the SSS, respectively. Within the narrow gap between the block and the cord, the flow is approximately unidirectional, with a parabolic profile (see figure 4
c) and with the pressure decreasing linearly in the direction of the flow (see also figure 5 below). This indicates that, despite the large velocities, the flow in this region is of lubrication type and is therefore dominated by viscous effects. As the flow emerges from the narrow gap and decelerates, it separates off the solid boundaries. This results in the formation of strong transient vortices which are advected with the flow. Since the flow changes direction periodically, the vortices remain located in the vicinity of the block; their remnants remain visible even after the flow has reversed direction (see, e.g. the velocity perturbations at the cranial [or caudal] end of the block in figure 4(a) [or (b)], respectively. Away from the block, the velocity becomes approximately unidirectional again, but now with a Womersley profile (i.e. an inviscid plug flow profile in the centre of the SSS, with Stokes layers near the walls; see figure 4
d), indicating that the flow in these regions is inertially dominated. In dimensional terms, the maximum oscillatory velocity in the profiles shown in figure 4(d) corresponds to 4.24 cm s
 $^{-1}$
, consistent with the range of pulsatile CSF velocities typically observed in MRI scans.
(a–d) Four snapshots of the instantaneous fluid pressure distribution in the SSS (along the FSI interface with the outer boundary of the cord; dashed line ranging over the entire length of the domain) and on the centreline of the syrinx (at
 $r=0$
; dashed line ranging from
 $z/{\mathcal{D}}=-11$
to
 $-4$
). (a)
 $t/{\mathcal{T}}=9$
, (b)
 $t/{\mathcal{T}}=9.25$
(c)
 $t/{\mathcal{T}}=9.5$
, (d)
 $t/{\mathcal{T}}=9.75$
. The solid lines in (a)–(d) show the corresponding cycle-averaged pressures. These are shown more clearly in (e) where we also show (using a thick dash–dotted line) the pressure distributions in the corresponding impermeable system. All pressures are non-dimensionalised on the amplitude of forcing pressure,
 $\widehat{P}$
, and the axial coordinate is scaled on the maximum diameter of the dura,
 ${\mathcal{D}}$
.

Apart from the regions where transient vortex shedding occurs, the fluid pressure is approximately constant across any cross-sections through the SSS and the syrinx. The axial variation of the fluid pressure is illustrated in figure 5(a–d) which shows four snapshots of the instantaneous (dashed lines) and cycle-averaged (solid lines) fluid pressure distribution along the FSI boundary between the SSS and the cord, and on the centreline of the syrinx (at
 $r=0$
). The instantaneous pressure distribution in the cranial part of the SSS is dominated by the time-harmonic pressure,
 $P_{cranial}(t)$
, that we impose at
 $z=0$
. Since
 $P_{cranial}(t)$
has zero mean, the cycle-averaged pressure in this region is close to zero. Conversely, the pressure in the caudal part of the SSS is strongly influenced by the viscous pressure drop across the narrow gap under the block. Since the width of this gap (and therefore the viscous flow resistance) varies considerably over the period of the oscillation (see figure 4
c), nonlinear effects create a net pressure difference across the block, leading to an elevated cycle-averaged fluid pressure in the caudal part of the SSS – the ‘valve mechanism’ (Martin et al.
Reference Martin, Labuda, Royston, Oshinski, Iskandar and Loth2010, Bertram Reference Bertram2010). The cycle-averaged pressures are shown in more detail in figure 5(e) where the arrows indicate the direction of the associated steady seepage flow that we expect to be generated by the transmural pressure difference across the porous syrinx cover.
For reference, the dashed–dotted line in this figure shows the cycle-averaged pressure distribution obtained in a simulation with an impermeable cord. As observed by Bertram (Reference Bertram2010), in this case the pressure distribution is such that one would expect that, overall, fluid is driven from the SSS into the syrinx because the integral of the cycle-averaged transmural pressure,
 $\overline{p|_{SSS}}-\overline{p|_{syrinx}}$
, over the length of the syrinx is positive. Here and elsewhere in this paper we denote the moving average of a quantity
 $f(t)$
as
 $$\begin{eqnarray}\overline{f}(t)=\frac{1}{{\mathcal{T}}}\int _{t}^{t+{\mathcal{T}}}\hspace{-8.5359pt}f(\unicode[STIX]{x1D70F})\,\text{d}\unicode[STIX]{x1D70F},\end{eqnarray}$$
and we omit the argument when we refer to the cycle average over the ultimate time-periodic steady state that is reached as
 $t\rightarrow \infty$
, i.e.
 $\overline{f}=\lim _{t\rightarrow \infty }\overline{f}(t)$
.
(a) Evolution of the relative change in syrinx volume,
 $\unicode[STIX]{x0394}V_{syrinx}(t)/V_{syrinx}(t=0)$
(black dashed line) and its cycle average (blue solid line) for a permeability of
 $k=10^{-13}~\text{m}^{2}$
. (b) Plot of the cycle average (black solid line), the fit to the exponential (4.2) (thick dashed line), and its asymptotic limit (thin dash–dotted line). Time is scaled on the period of the oscillation,
 ${\mathcal{T}}$
.

To assess if the permeability of the cord tissue does indeed result in a net increase in syrinx volume, figure 6(a) shows the evolution of the relative change in the syrinx volume,
 $\unicode[STIX]{x0394}V_{syrinx}(t)/V_{syrinx}(t=0)$
. The syrinx volume fluctuates and, following the initial transients, settles into a periodic oscillation about a slowly evolving mean. To characterise the evolution of the latter, figure 6(b) shows a plot of the moving average,
 $\overline{\unicode[STIX]{x0394}V_{syrinx}}(t)$
, again normalised by the initial syrinx volume. We observe that, following the decay of the initial transients, the moving average tends to an asymptotic limit,
 $\unicode[STIX]{x0394}V_{syrinx}^{[\infty ]}$
, the approach to which is well described by a damped exponential, i.e.
 $$\begin{eqnarray}\overline{\unicode[STIX]{x0394}V_{syrinx}}(t)\approx \unicode[STIX]{x0394}V_{syrinx}^{[\infty ]}+A\exp (-\unicode[STIX]{x1D706}t)\quad \text{as }t\rightarrow \infty .\end{eqnarray}$$
This is illustrated by the broken lines in figure 6(b) which show the damped exponential (4.2) and its asymptotic limit, respectively, using parameter values for
 $\unicode[STIX]{x0394}V_{syrinx}^{[\infty ]},A$
and
 $\unicode[STIX]{x1D706}$
that were obtained by fitting (4.2) to the computational data for
 $t>5\,{\mathcal{T}}$
.
(a) Evolution of the relative change in syrinx volume,
 $\unicode[STIX]{x0394}V_{syrinx}(t)/V_{syrinx}(t=0)$
for three different values of the permeability. (b) Plot of the cycle averages (black solid lines), the fits to the exponential (4.2) (thick dashed line) and their asymptotic limits (thin dash–dotted line).
 $k=10^{-14}\,\text{m}^{2},10^{-13}\,\text{m}^{2},10^{-12}\,\text{m}^{2}$
increasing in the direction of the arrow. Time is scaled on the period of the oscillation,
 ${\mathcal{T}}$
.

Figure 7 shows that the general trends observed in figure 6 for the default permeability of
 $k=10^{-13}~\text{m}^{2}$
are robust when the permeability is changed over two orders of magnitude. The main effect of an increase in permeability is an increase in (i) the amplitude of the fluctuations in the syrinx volume; (ii) the asymptotic limit of its moving average; (iii) the rate at which this asymptotic limit is approached. In all cases, the poroelastic fluid–structure interaction results in a net increase (albeit relatively small) in the syrinx volume,
 $\unicode[STIX]{x0394}V_{syrinx}^{[\infty ]}>0$
.
(a) Cycle-averaged seepage velocity,
 $(\overline{\boldsymbol{q}}\boldsymbol{\cdot }\boldsymbol{n})\boldsymbol{n}$
, crossing the FSI interfaces between the cord and the SSS (top) and the syrinx (bottom). The FSI interfaces (black lines) have been separated vertically for clarity but are otherwise drawn using the actual aspect ratio. The closed loop indicates the direction of the circular seepage flow. (b) Cycle-averaged normal traction
 $-\overline{p_{pore}}\boldsymbol{n}$
, acting onto the cord. All for
 $k=10^{-13}~\text{m}^{2}$
. The axial coordinate is scaled on the maximum diameter of the dura,
 ${\mathcal{D}}$
.

The fact that the cycle-averaged syrinx volume approaches a constant value,
 $\unicode[STIX]{x0394}V_{syrinx}^{[\infty ]}$
, implies that the net porous seepage flow into the syrinx (integrated over one period of the oscillation) must tend to zero as
 $t\rightarrow \infty$
. The plots in figure 8 illustrate how this is achieved: figure 8(b) shows the cycle-averaged traction,
 $-\overline{p_{pore}}~\boldsymbol{n}$
, that is exerted onto the pore fluid at the cord’s FSI interfaces (see (2.13)), while figure 8(a) shows the normal component of the resulting cycle-averaged seepage flow, represented by the vector
 $(\overline{\boldsymbol{q}}\boldsymbol{\cdot }\boldsymbol{n})\boldsymbol{n}$
. The cycle-averaged fluid pressure in the syrinx is approximately constant (see also figure 5), therefore the cycle-averaged transmural pressure,
 $\overline{p}_{syrinx}-\overline{p}_{SSS}$
, that drives the seepage flow through the syrinx cover closely follows the variations of the fluid pressure in the SSS. This results in the generation of a mean flow in a closed loop, circulating as indicated by the oval in figure 8(a). This circular flow transports fluid from the cranial to the caudal end of the SSS where it seeps into the syrinx before re-emerging near the cranial end of the SSS. The reduction in the cycle-averaged pressure in the caudal part of the SSS (compared to the impermeable case), shown in figure 5(e), can therefore be seen to be a consequence of the need to maintain overall mass conservation. Since the seepage flow is relatively weak, the overall pressure distribution in the SSS (in particular, the elevated pressure in the caudal part of the SSS) remains very similar to that observed in the impermeable case. As a result, the ‘valve mechanism’ remains active and generates an overall fluid pressure distribution that tends to drive fluid into [out of] the syrinx at its caudal [cranial] end. The initial imbalance between in- and outflow leads to a small increase in syrinx volume, but over sufficiently long times the fluid pressures adjust such that the net inflow into the syrinx exactly balances the net outflow. Figure 5(e) shows that this is achieved predominantly by a reduction in the fluid pressure in the caudal part of the SSS (via small changes to the width of the gap under block and thus the associated flow resistance) rather than an increase in the fluid pressure in the (slightly inflated) syrinx.
Returning now to figure 8(a), we note that the majority of the seepage flow passes through the thin syrinx cover, while only a relatively small fraction of the overall flow leaves/enters the syrinx through its conical ends. The seepage flow has (integrable) singularities at the ‘corners’ of the syrinx boundary (on the centreline and where the conical ends meet the syrinx cover). These singularities are clearly artefacts of the overly simplistic syrinx geometry assumed in our model. We refer to § 4.1.2 for a more detailed discussion of these features and an assessment of the sensitivity of our results to changes in the syrinx geometry. A detailed inspection of the seepage velocity field within the syrinx cover shows that the seepage flow is approximately unidirectional and directed radially inwards/outwards. The variation of the radial seepage velocity,
 $q_{r}$
, and the pore pressure,
 $p_{pore}$
, in a radial slice through the syrinx cover at
 $z=-7.5$
are illustrated in figure 9; these profiles are qualitatively similar to those in other cross-sections. The temporal fluctuations in both quantities are much larger than their cycle averages, but they are several orders of magnitude smaller than the fluid velocities in the SSS and the syrinx. (Compare, e.g. the magnitudes of the seepage velocities, figure 9(a), to the fluid velocities in the SSS, figure 4; both are scaled on the inertial velocity scale,
 ${\mathcal{U}}=(\widehat{P}/\unicode[STIX]{x1D70C}_{fluid})^{1/2}$
.) The strong spatial variations in
 $q_{r}$
and, in particular, its deviation from a divergence-free profile,
 $q_{r}\sim 1/r$
, indicate that much of the seepage flow is generated by the dynamic compression/expansion of the solid matrix – as discussed in § 2, the divergence of the solid velocity acts as a source term in the continuity equation for the seepage flow; see (2.8). The majority of the fluid that instantaneously enters the syrinx cover at the interface with the SSS is absorbed internally, with very little fluid emerging into the syrinx. In fact, over most of the period of the oscillation fluid tends to be ingested into (or ejected from) the porous syrinx cover simultaneously at both FSI interfaces, indicating that the Darcy-like through flow that is driven by the instantaneous transmural pressure across the syrinx cover only makes a small contribution to the instantaneous seepage flow.
Profiles of (a) the radial component of the seepage velocity,
 $q_{r}(r,t)$
, (b) the pore pressure,
 $p_{pore}(r,t)$
, in a radial slice through the syrinx cover (at
 $z/{\mathcal{D}}=-7.5$
) at eight uniformly spaced instants over the forcing period, starting at
 $t/{\mathcal{T}}=9$
. The blue solid line shows the results from the full FSI model; the black dashed lines show the predictions from the analytical model discussed in § 4.1, where we approximated the forcing due to the fluid pressure and the axial strain by their first two Fourier components. The seepage velocity is scaled on the inertial velocity scale,
 ${\mathcal{U}}=(\widehat{{\mathcal{P}}}/\unicode[STIX]{x1D70C}_{fluid})^{1/2}$
, the pore pressure on the amplitude of the forcing pressure,
 $\widehat{{\mathcal{P}}}$
and the radial coordinate on the maximum diameter of the dura,
 ${\mathcal{D}}$
.

4.1 A model for the seepage flows in the syrinx cover
To elucidate the mechanism responsible for the structure of the seepage flows within the syrinx cover, we will now develop a simple analytical model that exploits the following observations: (i) over most of the syrinx cover (away from its cranial and caudal ends) the seepage velocity and the displacement of the solid matrix are dominated by their radial components; (ii) all quantities vary slowly with the axial coordinate, so that generally
 $\unicode[STIX]{x2202}/\unicode[STIX]{x2202}z\ll \unicode[STIX]{x2202}/\unicode[STIX]{x2202}r$
; (iii) the traction exerted onto the poroelastic solid (and the embedded pore fluid) by the fluid in the SSS and the syrinx is dominated by the fluid pressure the temporal variation of which is well described by the first two Fourier components (comprising a constant part and a time harmonic with period
 ${\mathcal{T}}$
); (iv) the axial strain
 $\unicode[STIX]{x2202}u_{z}/\unicode[STIX]{x2202}z$
is approximately constant across the thickness of the syrinx cover and its temporal variation is again well described by the first two Fourier components. Combining these observations with the fact that the internal and external radii of the syrinx cover only vary slowly with
 $z$
suggests the use of a long-wavelength model in which each axial ‘slice’ of the syrinx cover (treated as a thick-walled ring of inner and outer radius
 $a$
and
 $b$
, respectively) is assumed to deform independently of its neighbours, and purely in response to the local traction acting on it. In the interest of brevity we present our derivation only for the case of a homogeneous syrinx cover, i.e. we do not distinguish between the pia and the cord (which have different constitutive properties; see § 2.2). The extension to the multi-layer case (for which we show results below) is straightforward. We assume that within a slice through the syrinx cover (i.e. at a fixed
 $z$
-coordinate), the pore pressure and the radial components of the solid displacement and the seepage flow are given by
 $$\begin{eqnarray}\{p_{pore}(r,t),u_{r}(r,t),q_{r}(r,t)\}=\text{Re}\left(\mathop{\sum }_{j}\{P_{pore}^{[j]}(r),U^{[j]}(r),Q^{[j]}(r)\}\exp \left(j~2\unicode[STIX]{x03C0}\text{i}~\frac{t}{{\mathcal{T}}}\right)\right),\end{eqnarray}$$
and that the boundary conditions (2.12) and (2.13) can be approximated by
 $$\begin{eqnarray}p_{pore}|_{r=a}=P_{syrinx}(t)\quad \text{and}\quad p_{pore}|_{r=b}=P_{SSS}(t)\end{eqnarray}$$
and
 $$\begin{eqnarray}-\boldsymbol{n}\boldsymbol{\cdot }(\pmb{\unicode[STIX]{x1D70E}}\boldsymbol{\cdot }\boldsymbol{n})|_{r=a}=P_{syrinx}(t)\quad \text{and}\quad -\boldsymbol{n}\boldsymbol{\cdot }(\pmb{\unicode[STIX]{x1D70E}}\boldsymbol{\cdot }\boldsymbol{n})|_{r=b}=P_{SSS}(t).\end{eqnarray}$$
We consider the system’s response to imposed time-periodic variations in the fluid pressures and the axial strain,
 $$\begin{eqnarray}\left\{P_{syrinx}(t),P_{SSS}(t),\frac{\unicode[STIX]{x2202}u_{z}}{\unicode[STIX]{x2202}z}(r,t)\right\}=\text{Re}\mathop{\sum }_{j}\{\mathbb{P}_{syrinx}^{[j]},\mathbb{P}_{SSS}^{[j]},\mathbb{D}_{z}^{[j]}\}\exp \left(j~2\unicode[STIX]{x03C0}\text{i}\frac{t}{{\mathcal{T}}}\right),\end{eqnarray}$$
which are characterised by the Fourier coefficients
 $\mathbb{P}_{syrinx}^{[j]},\mathbb{P}_{SSS}^{[j]},\mathbb{D}_{z}^{[j]}$
, assumed to be given.
Since the poroelastic equations (2.3)–(2.7) are linear, the different Fourier modes in (4.3) remain uncoupled. Upon inserting the ansatz (4.3) into (2.3)–(2.7) and neglecting any
 $z$
-derivatives we therefore obtain one system of linear ordinary differential equations (ODEs) (for
 $U^{[j]}(r),Q^{[j]}(r),P_{pore}^{[j]}(r)$
) for each Fourier mode
 $j$
. While these systems are easily solved, further insight into the structure of the solution for
 $j>0$
can be obtained by observing that for the forcing frequencies considered here the inertial terms (on the right-hand side of (2.3) and (2.4)) have little direct effect on the deformation of the syrinx cover (but see § 4.2 for a more detailed discussion of the effects of solid inertia). Neglecting these terms allows us to combine equations (2.3)–(2.7) into a single equation for the solid displacement,
 $$\begin{eqnarray}\displaystyle & & \displaystyle \frac{\text{i}k{\mathcal{T}}}{2\unicode[STIX]{x03C0}j\unicode[STIX]{x1D6FC}^{2}\unicode[STIX]{x1D707}_{fluid}}\unicode[STIX]{x1D735}\boldsymbol{\cdot }\unicode[STIX]{x1D735}\boldsymbol{\cdot }\frac{E_{drained}}{(1+\unicode[STIX]{x1D708}_{drained})}\left(\frac{\unicode[STIX]{x1D708}_{drained}}{(1-2\unicode[STIX]{x1D708}_{drained})}(\unicode[STIX]{x1D735}\boldsymbol{\cdot }\boldsymbol{U}^{[j]})\boldsymbol{I}+\frac{1}{2}(\unicode[STIX]{x1D735}\boldsymbol{U}^{[j]}+(\boldsymbol{U}^{[j]})^{\text{T}})\right)\nonumber\\ \displaystyle & & \displaystyle \hspace{85.35826pt}+\,\unicode[STIX]{x1D735}\boldsymbol{\cdot }\boldsymbol{U}^{[j]}=0\quad (\text{for }j>0),\end{eqnarray}$$
where
 $\boldsymbol{U}^{[j]}=U^{[j]}(r)\boldsymbol{e}_{r}+\mathbb{D}_{z}^{[j]}z\boldsymbol{e}_{z}$
– written in symbolic, vector-based notation because it keeps the equation in its most compact form. Equation (4.7) shows that the limit
 $k\rightarrow 0$
is singular since it causes the highest derivatives to vanish. For small but finite values of the permeability
 $k$
we therefore expect the existence of an interior region inside the syrinx cover within which the system’s behaviour is well described by the equations for
 $k=0$
, with boundary layers required to satisfy the boundary conditions (4.4) and (4.5). Setting
 $k=0$
in (4.7) shows that the solid displacement in the interior region must be divergence-free,
 $\unicode[STIX]{x1D735}\boldsymbol{\cdot }\boldsymbol{U}^{[j]}=0$
, implying that
 $$\begin{eqnarray}U^{[j]}(r)=\frac{A}{r}-\frac{1}{2}\mathbb{D}_{z}r\end{eqnarray}$$
for some constant
 $A$
. It turns out that, for a displacement field of this form, the divergence of the stress associated with the drained solid matrix vanishes,
 $\unicode[STIX]{x1D735}\boldsymbol{\cdot }\pmb{\unicode[STIX]{x1D70E}}_{elast}^{[j]}=\mathbf{0}$
, therefore equations (2.3) (with the inertial terms neglected) and (2.6) imply that the pore pressure is spatially constant,
 $\unicode[STIX]{x1D735}p_{pore}^{[j]}=\mathbf{0}$
. Substituting this into equation (2.4) then shows that the seepage flow vanishes so that in the interior of the syrinx cover we have
 $$\begin{eqnarray}Q^{[j]}(r)=0\quad \text{and}\quad P_{pore}^{[j]}(r)=\text{const}.\end{eqnarray}$$
As expected, this solution does not allow us to satisfy all the boundary conditions and therefore requires the presence of boundary layers. These are indeed present in the full solution for the radial displacement which, in regions where the material properties are homogeneous, is given by
 $$\begin{eqnarray}U^{[j]}(r)=\underbrace{\frac{A}{r}-\frac{1}{2}\mathbb{D}_{z}~r}_{inner~solution}+\underbrace{BJ_{1}\left(\text{i}^{-1/2}\left(\frac{r}{\unicode[STIX]{x1D6FF}_{j}}\right)\right)+C~K_{1}\left(\text{i}^{-3/2}\left(\frac{r}{\unicode[STIX]{x1D6FF}_{j}}\right)\right),}_{boundary~layers}\end{eqnarray}$$
where
 $J_{1}$
and
 $K_{1}$
are the Bessel function of the first kind and the modified Bessel function of the second kind (both of first order), respectively. In this expression the boundary layer thickness for the
 $j$
th Fourier mode is
 $$\begin{eqnarray}\unicode[STIX]{x1D6FF}_{j}=\left(\frac{k~E_{drained}(1-\unicode[STIX]{x1D708}_{drained})~{\mathcal{T}}}{2\unicode[STIX]{x03C0}j~\unicode[STIX]{x1D6FC}^{2}~\unicode[STIX]{x1D707}_{fluid}(1+\unicode[STIX]{x1D708}_{drained})(1-2\unicode[STIX]{x1D708}_{drained})}\right)^{1/2}.\end{eqnarray}$$
This agrees with the estimate of the boundary layer thickness in a time-periodically forced planar poroelastic layer (see, e.g. Detournay & Cheng (Reference Detournay, Cheng and Fairhurst1993)). The constants
 $A,B$
and
 $C$
in (4.10) follow from the boundary conditions at
 $r=a,b$
. For the multi-layer case, where a solution of the form (4.10) describes the displacement field within each layer of the syrinx cover (i.e. within the pia and the cord itself) the imposition of the continuity of the radial displacement and stress, as well as the seepage flow and pore pressure at the interfaces between the two layers provides additional matching conditions. Similar expressions can be derived for
 $P_{core}^{[j]}$
and
 $Q^{[j]}$
by lengthy but straightforward algebra.
Profiles of the radial component of the seepage velocity,
 $q_{r}(r,t)$
, (a,c,e,g), and the pore pressure,
 $p_{pore}(r,t)$
, (b,d,f,h) in a radial slice through an axially uniform model of the syrinx cover at eight uniformly spaced instants over the forcing period. The blue solid line shows the results from the finite element-based solution of the poroelastic equations (2.3)–(2.7), time integrated until a time-periodic steady state was established; the black dashed lines show the predictions for the time-periodic state from the analytical model discussed in § 4.1. (a,b)
 $k=10^{-13}~\text{m}^{2}$
, (c,d)
 $k=10^{-14}~\text{m}^{2}$
, (e–h)
 $k=10^{-15}~\text{m}^{2}$
. In (a–f) we made the syrinx cover uniform by setting
 $E_{drained}^{[pia]}=E_{drained}^{[cord]}$
; in (g,h) we employed the actual stiffnesses, resulting in a much stiffer pia. The seepage velocity is scaled on the inertial velocity scale,
 ${\mathcal{U}}=(\widehat{{\mathcal{P}}}/\unicode[STIX]{x1D70C}_{fluid})^{1/2}$
, the pore pressure on the amplitude of the forcing pressure,
 $\widehat{{\mathcal{P}}}$
, and the radial coordinate on the maximum diameter of the dura,
 ${\mathcal{D}}$
.

4.1.1 Seepage flow in the syrinx cover
To assess how well the approximate model manages to capture the key features of the seepage flow in the syrinx cover, we determined the Fourier coefficients
 $\mathbb{P}_{syrinx}^{[j]},\mathbb{P}_{SSS}^{[j]}$
and
 $\mathbb{D}_{z}^{[j]}$
for the forcing that acts in the axial slice at
 $z=-7.5$
from the full FSI simulations. The dashed lines in figure 9 show the predictions for the seepage flow and the pore pressure obtained from the simplified analytical model with just two Fourier terms (
 $j=0,1$
). The predictions agree extremely well with the results from the fully coupled FSI simulation. Similar agreement was obtained in other cross-sections and for different values of the permeability. This indicates that our simplified model provides a good description of the poroelastic behaviour of the syrinx cover. We can therefore employ this model to study (at greatly reduced computational cost) the effect of variations in the tissue’s permeability and its multi-layer structure. To illustrate the effect of the former, figure 10(a–f) shows plots of the radial component of the seepage velocity,
 $q_{r}$
, (a,c,e) and the pore pressure,
 $p_{pore}$
, (b,d,f) for various values of the permeability, for the case of a homogeneous syrinx cover in which the drained Young’s modulus of the pia was set to the same value as that of the cord. All other parameters (the Fourier coefficients
 $\mathbb{P}_{syrinx}^{[j]},\mathbb{P}_{SSS}^{[j]}$
and
 $\mathbb{D}_{z}^{[j]}$
and the dimension of the slice) were kept as in figure 9. For
 $k=10^{-13}~\text{m}^{2}$
(figure 10
a,b) the (nominal) boundary layer thickness is close to 20 % of the thickness of the syrinx cover and as a result no pronounced boundary layers are visible in the various profiles; the combination of the driving pressure drop,
 $P_{syrinx}(t)-P_{SSS}(t)$
, and the kinematic redistribution of the pore fluid due to the compression/expansion of the solid matrix generates a seepage flow throughout the syrinx cover. As the permeability is reduced (to
 $k=10^{-14}~\text{m}^{2}$
and
 $k=10^{-15}~\text{m}^{2}$
in figures 10(c,d) and 10(e,f), respectively) the pore fluid becomes increasingly immobile. Since the pore fluid and the material that makes up the solid matrix are both assumed to be incompressible, the compound poroelastic medium becomes itself increasingly incompressible. The pore pressure in the interior becomes spatially constant and adopts a value that is, in general, inconsistent with the boundary conditions (4.4) and (4.5). The pore pressure therefore adjusts within the thin poroelastic boundary layers within which the pressure gradient becomes sufficiently large to generate significant seepage flows despite the tissue’s small permeability.
Equation (4.11) shows that the thickness of the poroelastic boundary layers depends on the material’s (drained) Young’s modulus,
 $E_{drained}$
. In the full multi-layer model the stiffness of the pia is much greater than that of the cord, and the (nominal) boundary layer thickness in the pia exceeds its thickness, even for the smallest permeability considered here. As a result, the pore pressure and the seepage flow vary considerably throughout the pia, even in cases where the small permeability has virtually suppressed the seepage flow in the central region of the cord (see figure 10(g,h) for
 $k=10^{-15}~\text{m}^{2}$
). Even though the pia is very thin, its stiffness is so much greater than that of the cord tissue that the pia contributes significantly to the overall stiffness of the syrinx cover. As a result, the amplitude of the syrinx displacements is reduced by a factor of
 ${\approx}23$
compared to the case when the entire syrinx cover is assumed to be spatially homogeneous (with the constitutive properties of the cord tissue, as in figure 10
a–f). The fact that the seepage flow within the syrinx is reduced by approximately the same factor (compare figures 10
e,f and 10
g,h) shows, yet again, that the seepage flow is dominated by the kinematic redistribution of the pore fluid due to the dynamic compression/expansion of the solid matrix.
We note that figure 10(a–h) contains a second set of (blue solid) lines. These were obtained numerically by time integrating the full equations of poroelasticity (2.3)–(2.7) (using oomph-lib) in a finite-size, axially uniform annular region of the same inner and outer radius as in the analytical model. The computations were performed using the forcing specified by (4.4) and (4.5). The annular region was allowed to expand freely in the radial direction at its axial ends where we suppressed any axial outflow and imposed the required value of
 $\unicode[STIX]{x2202}u_{z}/\unicode[STIX]{x2202}z$
by prescribing a suitable time-periodic axial displacement. The excellent agreement between the analytical and numerical results provides useful cross-validation between the two approaches. The direct numerical simulations also showed that for small permeabilities, it takes extremely long for the system to settle into its fully time-periodic state. For instance, the computations for
 $k=10^{-15}~\text{m}^{2}$
had to be continued to 100 periods of the oscillation to achieve the level of agreement with the time-periodic analytical solution shown in figure 10(e–h). Such computations would have been extremely time-consuming if they had been performed with the fully coupled FSI model.
4.1.2 Implications for the change in syrinx volume
The simplified analytical model also allows insight into the mechanism that is responsible for the change in syrinx volume – or, rather, it helps explain why the change is so small. For simplicity we only present the analysis for the case of a homogeneous syrinx cover; the results for the multi-layer case are algebraically significantly more complicated but the final outcome of the analysis is the same. We start by noting that only the steady components (
 $j=0$
) of all fields in (4.3) make a contribution to their cycle averages – the other components have zero temporal mean by construction. Setting the time derivative in (2.8) to zero shows that the steady seepage flow is divergence-free. Taking the divergence of the steady version of (2.4) therefore yields a second-order ODE for the pore pressure which is subject to the pressure boundary conditions
 $P_{pore}^{[0]}(r=a)=\mathbb{P}_{syrinx}^{[0]}$
and
 $P_{pore}^{[0]}(r=b)=\mathbb{P}_{SSS}^{[0]}$
. The solution is given by
 $$\begin{eqnarray}P^{[0]}(r;z)=\mathbb{P}_{SSS}^{[0]}(z)-(\mathbb{P}_{syrinx}^{[0]}(z)-\mathbb{P}_{SSS}^{[0]}(z))\frac{\ln (r/a(z))}{\ln (b(z)/a(z))}.\end{eqnarray}$$
Substituting this back into (2.4) shows that the steady part of the seepage velocity in a radial slice at an axial coordinate
 $z$
is given by the Darcy profile
 $$\begin{eqnarray}Q^{[0]}(r;z)=\frac{k(\mathbb{P}_{syrinx}^{[0]}(z)-\mathbb{P}_{SSS}^{[0]}(z))}{\unicode[STIX]{x1D707}_{fluid}\ln (b(z)/a(z))}\frac{1}{r},\end{eqnarray}$$
which depends linearly on the local transmural pressure
 $\mathbb{P}_{syrinx}^{[0]}(z)-\mathbb{P}_{SSS}^{[0]}(z)$
across the syrinx cover. Inserting (4.12) and (2.7) into (2.6) then yields the steady component of the stress tensor in the cord tissue which we substitute into the steady version of (2.3). The radial component of this equation provides a second-order ODE for the steady component of the radial displacement which is subject to the steady part of the two traction boundary conditions (4.5). Solving these equations yields
 $$\begin{eqnarray}\displaystyle & \hspace{-10.00002pt}\left.\right. & \displaystyle U^{[0]}(r;z)=\frac{1+\unicode[STIX]{x1D708}_{drained}}{E_{drained}(b^{2}(z)-a^{2}(z))}\left(\underbrace{\left(\mathbb{P}_{syrinx}^{[0]}(z)-\mathbb{P}_{SSS}^{[0]}(z)\right)\frac{a^{2}(z)b^{2}(z)}{r}}_{\text{I}}\right.\nonumber\\ \displaystyle & \hspace{-10.00002pt}\left.\right. & \displaystyle \quad \left.+\,\underbrace{(a^{2}(z)\mathbb{P}_{syrinx}^{[0]}(z)-b^{2}(z)\mathbb{P}_{SSS}^{[0]}(z))(1-2\unicode[STIX]{x1D708}_{drained})r}_{\text{II}}~\right)-\underbrace{\unicode[STIX]{x1D708}_{drained}~\mathbb{D}_{z}^{[0]}(z)~r}_{\text{ III}}\nonumber\\ \displaystyle & \hspace{-10.00002pt}\left.\right. & \displaystyle \quad +\,\frac{\unicode[STIX]{x1D6FC}(1+\unicode[STIX]{x1D708}_{drained})(1-2\unicode[STIX]{x1D708}_{drained})}{2E_{drained}(1-\unicode[STIX]{x1D708}_{drained})}\left\{\left(\frac{[(1-\unicode[STIX]{x1D708}_{drained})-\ln (r/a(z))](\mathbb{P}_{syrinx}^{[0]}(z)-\mathbb{P}_{SSS}^{[0]}(z))}{\ln (b(z)/a(z))}\right.\right.\nonumber\\ \displaystyle & \hspace{-10.00002pt}\left.\right. & \displaystyle \left.\left.\quad +\,\frac{(\mathbb{P}_{syrinx}^{[0]}(z)\,-\,\mathbb{P}_{SSS}^{[0]}(z))b^{2}(z)\,-\,\unicode[STIX]{x1D708}_{drained}(\mathbb{P}_{SSS}^{[0]}(z)b^{2}(z)+\mathbb{P}_{syrinx}^{[0]}(z)a^{2}(z))\,-\,(1\,-\,2\unicode[STIX]{x1D708}_{drained})\mathbb{P}_{syrinx}^{[0]}(z)a^{2}(z)}{b^{2}(z)-a^{2}(z)}\right)r\right.\nonumber\\ \displaystyle & \hspace{-10.00002pt}\left.\right. & \displaystyle \quad \left.-\,\frac{a^{2}(z)b^{2}(z)(\mathbb{P}_{syrinx}^{[0]}(z)-\mathbb{P}_{SSS}^{[0]}(z))}{b^{2}(z)-a^{2}(z)}\frac{1}{r}\right\}.\end{eqnarray}$$
Here term I represents the divergence-free expansion of the syrinx cover in response to the local transmural pressure,
 $\mathbb{P}_{syrinx}^{[0]}(z)-\mathbb{P}_{SSS}^{[0]}(z)$
; term II represents the pressure-induced compression of the syrinx cover (note that this term vanishes if the drained solid matrix is incompressible,
 $\unicode[STIX]{x1D708}_{drained}=1/2$
); term III arises from the fact that the axial compression of the syrinx cover (represented by
 $\mathbb{D}_{z}^{[0]}$
) changes its thickness in proportion to Poisson’s ratio. The remaining terms are premultiplied by the Biot–Willis parameter
 $\unicode[STIX]{x1D6FC}$
, indicating that they arise through the drag that the pore fluid exerts onto the solid matrix; interestingly, this effect again vanishes if the solid matrix is incompressible, i.e. if
 $\unicode[STIX]{x1D708}_{drained}=1/2$
.
In the full FSI model, the inner and outer boundaries of the syrinx cover are only slightly tapered in the axial direction, therefore the radii
 $a(z)$
and
 $b(z)$
are approximately constant and close to their average values,
 $a_{0}$
and
 $b_{0}$
, say. Assuming that the flow into/out of the syrinx is dominated by the flow across the syrinx cover (located between
 $z=z_{lower}$
and
 $z_{upper}$
, say), the condition that the cycle-averaged in/outflow over the surface of the syrinx,
 $\unicode[STIX]{x2202}V_{syrinx}$
,
 $$\begin{eqnarray}\displaystyle \oint _{\unicode[STIX]{x2202}V_{syrinx}}\boldsymbol{q}^{[0]}\boldsymbol{\cdot }\boldsymbol{n}\,\text{d}S & = & \displaystyle 2\unicode[STIX]{x03C0}\int _{z_{lower}}^{z_{upper}}Q^{[0]}(a(z);z)~a(z)\,\text{d}z\nonumber\\ \displaystyle & {\approx} & \displaystyle \frac{2\unicode[STIX]{x03C0}k}{\unicode[STIX]{x1D707}_{fluid}\ln (b_{0}/a_{0})}\int _{z_{lower}}^{z_{upper}}(\mathbb{P}_{syrinx}^{[0]}(z)-\mathbb{P}_{SSS}^{[0]}(z))\,\text{d}z\end{eqnarray}$$
is zero therefore requires that
 $$\begin{eqnarray}\int _{z_{lower}}^{z_{upper}}(\mathbb{P}_{syrinx}^{[0]}(z)-\mathbb{P}_{SSS}^{[0]}(z))\,\text{d}z=0.\end{eqnarray}$$
We now exploit that the typical thickness of the syrinx cover
 $h_{cover}=b_{0}-a_{0}$
is small. Evaluating (4.14) at
 $r=a(z)\approx a_{0}$
and expanding the result in
 $h_{cover}/a_{0}\ll 1$
allows us to approximate the cycle-averaged radial displacement at the inner boundary of the syrinx cover by
 $$\begin{eqnarray}U^{[0]}(a(z);z)\approx (\mathbb{P}_{syrinx}^{[0]}(z)-\mathbb{P}_{SSS}^{[0]}(z))\frac{a_{0}(1-\unicode[STIX]{x1D708}_{drained}^{2})}{(h_{cover}/a_{0})E_{drained}}.\end{eqnarray}$$
Unlike the full expression, equation (4.14), the approximate version (4.17) is linear in the local transmural pressure,
 $\mathbb{P}_{syrinx}^{[0]}(z)-\mathbb{P}_{SSS}^{[0]}(z)$
, across the syrinx cover. This implies that the change in syrinx volume induced by the radial deformation of the syrinx cover,
 $$\begin{eqnarray}\displaystyle \unicode[STIX]{x0394}V_{syrinx}^{[\infty ]} & = & \displaystyle \oint _{\unicode[STIX]{x2202}V_{syrinx}}\boldsymbol{u}^{[0]}\boldsymbol{\cdot }\boldsymbol{n}\,\text{d}S=2\unicode[STIX]{x03C0}\int _{z_{lower}}^{z_{upper}}U^{[0]}(r=a(z);z)~a(z)\,\text{d}z\nonumber\\ \displaystyle & {\approx} & \displaystyle \frac{2\unicode[STIX]{x03C0}a_{0}^{2}(1-\unicode[STIX]{x1D708}_{drained}^{2})}{(h_{cover}/a_{0})E_{drained}}\int _{z_{lower}}^{z_{upper}}(\mathbb{P}_{syrinx}^{[0]}(z)-\mathbb{P}_{SSS}^{[0]}(z))\,\text{d}z\end{eqnarray}$$
vanishes because mass conservation requires the integral in the final term to be zero; see (4.16).
Given that our model provides a good description of the behaviour of the syrinx cover, the small change in syrinx volume that is observed in the full FSI simulations must therefore arise predominantly through secondary features that are not captured by this model, such as the flow through and the deformation of the (conical) ends of the syrinx. To show that these do indeed have a (relatively large) effect on the (small) change in syrinx volume, we performed an additional FSI simulation using a different syrinx geometry. Rather than terminating the syrinx with conical ends (as in Bertram’s (Reference Bertram2010) original model), we used ellipsoidal ends which merged smoothly with the unchanged syrinx cover. Figure 11(a,b) shows that this has very little effect on the overall pressure distribution and the seepage flow along the syrinx cover. The main effect of the change in the geometry is the disappearance of the singularities in the seepage flow that developed at the sharp corners in the conical geometry (cf. figure 8).
Plots illustrating the effect of changing the geometry of the syrinx. (a) and (b) The cycle-averaged seepage velocity and normal traction acting onto the cord (as in figure 8; see caption to that figure for details) when the conical ends of the syrinx in the original model are changed to ellipsoids. (c) Cycle average of the relative change in syrinx volume,
 $\overline{\unicode[STIX]{x0394}V_{syrinx}}(t)/V_{syrinx}(t=0)$
(red solid line), the fit to the exponential (4.2) (thick dashed line), and its asymptotic limit (thin dash–dotted line) for the two syrinx geometries. Time is scaled on the period of the oscillation,
 ${\mathcal{T}}$
. (d–f) Comparison of the cycle-averaged syrinx deformation for the (d) original and (e) ellipsoidal syrinx shape. Broken lines: undeformed shape; solid lines: deformed shape. (f) Direct comparison between the deformed cycle-averaged syrinx shapes for the two geometries. All displacements are exaggerated by a factor of 40 and lengths are scaled on the maximum diameter of the dura,
 ${\mathcal{D}}$
.
 $k=10^{-13}~\text{m}^{2}$
.

Figure 11(d–f) compares the cycle-averaged deformation of the syrinx for the two geometries and shows that the deformation of the syrinx cover for the two cases is graphically indistinguishable. In fact, even the deformation of the syrinx ends is practically identical in the sense that for both geometries it is dominated by their axial displacements. It is difficult to identify the mechanism via which the change in the syrinx geometry leads to the further increase in the syrinx volume that is evident in the time trace in figure 11(c). This is because even though the change in the syrinx geometry increases the relative change in syrinx volume by approximately 25 %, the net change in syrinx volume of
 $O(10^{-3}\,\%)$
is far too small to be observable in the deformation shown in figure 11(d–f), despite the fact that the displacements are exaggerated by a factor of 40 in these plots.
To assess the robustness of our findings we also studied the effect of variations in the waveform of the imposed pressure at the cranial end,
 $P_{cranial}(t)$
, by replacing the sinusoidal signal (2.16) with a waveform that more closely resembles actual cardiac-induced pressure fluctuations. While this forcing generated higher-frequency components in the system’s response (results not shown in the interest of brevity), the overall behaviour (in terms of the tissue deformation, CSF flow and the character of the seepage flows) remained qualitatively unchanged. In particular, the forcing still generated only a very small increase in the cycle-averaged syrinx volume – even smaller, in fact, than that generated by the sinusoidal forcing (2.16)).
Finally, we considered the effect of variations in the initial syrinx volume which we illustrate in figure 12(a). The figure shows time traces of the relative change in syrinx volume, created by the sinusoidal forcing (2.16), for four different syrinx shapes. These were generated by displacing the conical syrinx ends symmetrically in the axial direction, as illustrated in figure 12(b) which shows plots of the syrinx shapes (in the
 $(r,z)$
plane) using a 1:1 aspect ratio. The system’s overall behaviour (again assessed in terms of the tissue deformation, CSF flow and the character of the seepage flows) was again found to be qualitatively similar in all cases and the change in the cycle-averaged syrinx volume was always very small. A reduction/increase in the length of the syrinx can be seen to lead to a systematic reduction/increase in the relative change in syrinx volumes, so that for sufficiently short syrinxes the volume change becomes negative. This implies that the presence of seepage flow does not always lead to an inflation of the syrinx. Because the actual change in syrinx volume remained very small, we were again unable identify a simple mechanism that would explain how the volume change depends on the length of the syrinx – the differences between the various cases are too small to be observable, and there may, of course, not even be a single mechanism that is responsible for the observed behaviour. Similar behaviour is found when the position of the syrinx is shifted relative to the block; see Bertram & Heil (Reference Bertram and Heil2016).
(a) Relative change in syrinx volume (instantaneous and cycle averaged, as in figure 6) for
 $k=10^{-13}\,\text{m}^{2}$
for syrinxes of different length, increasing in the direction of the arrow. (b) Plot of the four syrinxes (in the
 $(r,z)$
plane) using a 1:1 aspect ratio.

4.2 The effect of solid inertia and the slip boundary conditions
For the forcing frequencies and permeabilities considered here, inertial effects do not have a strong effect on the deformation of and the seepage flow within the syrinx cover: the results obtained from our analytical model (which excluded the terms on the right-hand side of (2.3) and (2.4)) agree perfectly with those from corresponding direct numerical simulations in which inertia was included. This is because the deformation of the syrinx cover is dominated by its (small) radial displacements. However, inertia does have a noticeable effect on the system’s overall behaviour because the cord tissue undergoes relatively large time-periodic axial displacements (and hence accelerations). These do affect the fluctuations in syrinx volume but appear to have little effect on the its ultimate cycle average; see figure 13(a). We also investigated the effect of variations in the porosity
 $\unicode[STIX]{x1D719}$
which, within our simple model for the behaviour of the poroelastic tissues, only features in the inertial terms for the pore fluid in (2.4). Repeating the simulations with a value of
 $\unicode[STIX]{x1D719}=0.03$
yielded results that were graphically indistinguishable from those obtained with the default value of
 $\unicode[STIX]{x1D719}=0.3$
– another indication that the seepage flow is far too weak to have a significant effect on the system’s overall behaviour.
Figure 13(b) demonstrates that the slip of the fluid along the porous FSI interfaces has little effect on the result. The slip coefficient
 $\unicode[STIX]{x1D6FE}$
in (2.15) is proportional to the fluid’s dynamic viscosity,
 $\unicode[STIX]{x1D6FE}=\unicode[STIX]{x1D6FC}_{BJS}~\unicode[STIX]{x1D707}_{fluid}$
, where
 $\unicode[STIX]{x1D6FC}_{BJS}$
is an
 $O(1)$
constant; see Beavers & Joseph (Reference Beavers and Joseph1967). Equation (2.15) shows that slip effects are most likely to play a significant role for large permeabilities. We therefore repeated the simulation for
 $k=10^{-12}\,\text{m}^{2}$
(the largest permeability considered in this study) with a non-zero value of the inverse slip coefficient,
 $\unicode[STIX]{x1D6FE}^{-1}=\unicode[STIX]{x1D707}_{fluid}^{-1}$
(the value for
 $\unicode[STIX]{x1D6FC}_{BJS}=1$
). Figure 13(b) shows that this has no visible effect on the results.
Relative change in syrinx volume (instantaneous and cycle averaged, as in figure 6) for
 $k=10^{-13}~\text{m}^{2}$
with (solid) and without (dashed) the inertial terms in (2.3) and (2.4). (b) Relative change in syrinx volume for
 $k=10^{-12}~\text{m}^{2}$
, allowing (
 $\unicode[STIX]{x1D6FE}^{-1}=\unicode[STIX]{x1D707}_{fluid}^{-1}$
; solid) and not allowing (
 $\unicode[STIX]{x1D6FE}^{-1}=0$
; dashed) for tangential slip at the FSI interfaces.

5 Summary and discussion
The results from the fully coupled FSI simulations and from our simple analytical model provide a clear picture of the mechanism by which poroelastic fluid–structure interaction controls the mass transfer between the SSS and the syrinx. For the relatively small permeabilities encountered in the spinal cord (see below for a more detailed discussion of the constitutive models and their parameters), the system’s overall behaviour is dominated by the interaction between the elastic deformation of the various tissues and the fluid flow in the SSS and the syrinx. This interaction remains very similar to that observed in Bertram’s (Reference Bertram2010) study of the corresponding impermeable system. In particular, nonlinear effects arising through the time-varying flow resistance across the narrow gap under the block create a cycle-averaged difference in fluid pressure between the cranial and caudal part of the SSS – the ‘valve mechanism’. In the impermeable system, the resulting transmural pressure across the syrinx cover is such that it has a tendency to drive fluid from the SSS into the syrinx. When the permeability of the tissue is accounted for, any initial imbalance in the cycle-averaged seepage flow into/out of the syrinx leads to a change in syrinx volume and an adjustment of the various fluid pressures until a new cycle-averaged steady state is established. Computations show that the adjustment in the fluid pressures is achieved primarily by a small reduction in fluid pressure in the caudal part of the SSS, with the pressure in the syrinx and in the cranial part of the SSS remaining virtually unchanged compared to the impermeable case. The direction of the transmural pressure differences that drive fluid across the porous syrinx cover remains unchanged too and in the poroelastic system they generate a cycle-averaged circular seepage flow which transports fluid into/out of the syrinx in its caudal/cranial part. Once the system has reached its cycle-averaged steady state, there is no net mass transfer into the syrinx – the inflow exactly balances the outflow. We developed a simple analytical model which shows that for elongated syrinx geometries in which most of the seepage flow into/out of the syrinx passes through a long, thin syrinx cover, the requirement of zero cycle-averaged in/outflow implies that the change in the cycle-averaged syrinx volume is close to zero. This is consistent with the results from the full FSI model which showed that the change in syrinx volume is indeed very small. We note that the analysis presented in § 4.1.2 relied on the fact that for sufficiently thin syrinx covers, both the radial seepage flux and the radial displacement of the syrinx cover depend linearly on the local transmural pressure difference across the syrinx cover. For thicker syrinx covers, all terms in (4.14) (including those that, like term II, do not depend on the transmural pressure difference alone) will affect the expansion (or compression) of the syrinx.
The steady circular seepage flow that develops after the decay of the initial transients results in a continuous mass transfer between the syrinx and the SSS. However, its magnitude is generally much smaller than that of the time-periodic fluctuations which are represented by the higher Fourier modes (
 $j>0$
) in the expansion (4.3). The unsteady flow is driven primarily by the kinematic redistribution of the fluid within the periodically expanding and contracting solid matrix. For sufficiently small permeabilities the oscillatory seepage flows and the pore pressures develop pronounced boundary layers at the FSI interfaces and at the material interfaces between the different tissue layers, e.g. between the pia and the cord. The thickness of the boundary layers at the FSI interfaces controls how far the oscillatory seepage flows penetrate the solid matrix.
The overall behaviour was found to be robust to changes in the waveform of the imposed pressure fluctuations,
 $P_{cranial}(t)$
, and to changes in the shape and the size of the syrinx: while the precise value of the change in the cycle-averaged syrinx volume was found to depend sensitively on these parameters (and, for sufficiently short syrinxes can even become negative), its value was always very small – possibly too small to regard it as a sufficiently strong stimulus for a subsequent remodelling of the cord tissue which would lead to a long-term growth of the syrinx. While, over sufficiently long time scales even a small stimulus may initiate/drive a remodelling process, our model neither permits us to explore this nor to pass judgement on the likelihood of other mechanisms (possibly non-mechanical in nature, such as inflammation) being at work. There is a considerable body of literature on mechanically induced remodelling in the cardiovascular system (see, e.g. Humphreys (Reference Humphreys2008) for a review of arterial remodelling), but we are not aware of any comparable studies in the context of syringomyelia.
The model used in this study incorporates a fair amount of anatomical detail such as the multi-layer structure of the spinal cord. However, in an attempt to facilitate the identification of the dominant mechanisms that control the mass transfer from the SSS to the syrinx, we deliberately applied many drastic simplifications: in vivo, neither the geometry nor the flow are perfectly axisymmetric; the SSS is traversed by nerve bundles and connective tissue filaments known as trabeculae; biological tissue is not perfectly poroelastic and its material properties are anisotropic and inhomogeneous; the dura is surrounded by other tissue which we omitted from our model (though we note that Bertram (Reference Bertram2010) deliberately set the thickness of the dura to a value that is somewhat larger than in vivo in an attempt to account for the stiffness of the backing).
Recent improvements in MRI-based imaging techniques have made it possible to visualise not only the geometry of the SSS but also the time-resolved three-dimensional flow of CSF within it; see, e.g. Bunck et al. (Reference Bunck, Kroger, Juttner, Brentrup, Fiedler, Schaarschmidt, Crelier, Schwindt, Heindel, Niederstadt and Maintz2011), Yiallourou et al. (Reference Yiallourou, Kröger, Stergiopulos, Maintz, Martin and Bunck2015), Heidari Pahlavian et al. (Reference Heidari Pahlavian, Yiallourou, Tubbs, Bunck, Loth, Goodin, Raisee and Martin2014), Heidari Pahlavian et al. (Reference Heidari Pahlavian, Loth, Luciano, Oshinski and Martin2015). These visualisations show that, as expected, deviations from an axisymmetric geometry tend to induce secondary non-axisymmetric flow features such as the formation of jets near localised constrictions, and recirculation regions downstream of anatomical features such as nerve roots or denticulate ligaments. However, these complex localised flow features appear to have little effect on the average CSF flow (Stockman Reference Stockman2006), and more importantly, on the CSF pressure distribution along the SSS (Heidari Pahlavian et al. Reference Heidari Pahlavian, Yiallourou, Tubbs, Bunck, Loth, Goodin, Raisee and Martin2014) which we showed to be the key feature that controls the seepage flow from the SSS to the syrinx. Note, however, that simulations by Gupta et al. (Reference Gupta, Soellinger, Boesiger, Poulikakos and Kurtcuoglu2009) and Gupta et al. (Reference Gupta, Soellinger, Grzybowski, Boesiger, Biddiscombe, Poulikakos and Kurtcuoglu2010) showed that in the cranial subarachnoid space the presence of the trabecular network has a significant effect on the CSF flow.
Our model assumed the system to be forced exclusively by the cranial pressure fluctuation,
 $P_{cranial}(t)$
, which we assumed to be correlated with the heart beat. CSF flow can also be affected by respiratory manoeuvres, with sneezing and coughing providing particularly powerful, transient pressure perturbations; see, e.g. Elliott et al. (Reference Elliott, Bertram, Martin and Brodbelt2013). While steady-state quiet breathing generates pressure variations of much smaller amplitude, it may still have an effect on the CSF flows (see, e.g. Dreha-Kulaczewski et al.
Reference Dreha-Kulaczewski, Joseph, Merboldt, Ludwig, Gärtner and Frahm2015).
Regarding the constitutive modelling we note that, even though the spinal cord is viscoelastic (see, e.g. Chang, Hung & Feng (Reference Chang, Hung and Feng1988)), for the forcing frequencies considered in the current study, viscoelastic effects only play a minor role. Furthermore, even though we did not include viscoelastic effects into the constitutive equation for the drained solid matrix, the dissipation associated with the seepage flows introduces viscous losses into the solid model; see, e.g. Elliott (Reference Elliott2012) for a study of the effects of poroelasticity on the propagation of pressure waves along the SSS. Estimates for the elastic constitutive parameters such as the tissues’ Young’s moduli vary considerably and most tissues display noticeable anisotropy. We refer to Elliott et al. (Reference Elliott, Bertram, Martin and Brodbelt2013) for a compilation of data from a variety of sources; in the current study we used the same (isotropic) values that were used by Bertram (Reference Bertram2010) to facilitate comparisons between the two studies. Similar comments apply to parameter values for the tissue permeability where estimates span several orders of magnitude, ranging from
 $O(10^{-14}~\text{m}^{2})$
for white matter to
 $O(10^{-16}~\text{m}^{2})$
for grey matter (see, e.g. Smillie et al.
Reference Smillie, Sobey and Molnar2005), with the permeability of the cord greater in the longitudinal than the transverse direction (Rossi et al.
Reference Rossi, Boss, Steidle, Martirosian, Klose, Capuani, Maraviglia, Claussen and Schick2008). While it is relatively straightforward to include such details in a computational model, the determination of the appropriate patient-specific parameters is difficult. As a result, even in studies that are based on anatomically realistic geometries, ‘parameters are usually obtained experimentally from animal cadavers’, to quote from Støverud et al. (Reference Støverud, Alnæs, Langtangen, Haughton and Mardal2015) who assessed the sensitivity of a poroelastic model of the spinal cord (with anatomically correct geometry determined from MRI scans) to variations in the constitutive parameters.
While our comparatively simple model clearly cannot (and is not intended to) capture all of these details, we believe that its relative simplicity helps to elucidate the fundamental mechanisms by which poroelastic fluid–structure interaction controls the mass transfer between the SSS and the syrinx.
Acknowledgements
We acknowledge support from the Chiari and Syringomyelia Foundation (grant to C.D.B.). Matthew J. Russell contributed to the implementation of the poroelastic FSI capabilities in oomph-lib. Draga Pihler-Puzovic provided many helpful comments on an earlier draft of this manuscript.
Appendix A. Validation and spatio-temporal convergence tests
oomph-lib’s axisymmetric Navier–Stokes equations and FSI capabilities are well validated and have, over the years, been used in a wide variety of studies (e.g. Hewitt et al. Reference Hewitt, Hazel, Clarke and Denier2011; Hazel et al. Reference Hazel, Heil, Waters and Oliver2012; Pihler-Puzovic et al. Reference Pihler-Puzovic, Juel, Peng, Lister and Heil2015). To validate the driver code developed for the problem considered in this paper we initially recomputed some of the cases from Bertram’s (Reference Bertram2010) study of the impermeable system. Bertram (Reference Bertram2010) performed these computations allowing for a realistic degree of liquid compressibility but the Mach number of the flows is so small that this had no practical effect on the results. The predictions for key quantities, such as the cycle-averaged fluid pressures shown in figure 14 in the present paper, agreed extremely well with Bertram’ (Reference Bertram2010) original results. The newly implemented equations of poroelasticity were validated by comparing the numerical results against a variety of analytical solutions such as those presented in figure 10 in this paper. Figure 14 shows the results of spatial and temporal convergence tests for the fully coupled FSI simulations. The red solid line shows the relative change in syrinx volume for the standard spatial resolution (80 time steps per period and a spatial discretisation with approximately 1.5 million degrees of freedom). This is compared to results from a simulation with twice the number of time steps per period (thick blue dashed line) and with an increased spatial resolution (9.4 million degrees of freedom). The figure indicates that the results obtained with the standard spatial/temporal resolution are fully converged.
Evolution of the relative change in syrinx volume,
 $\unicode[STIX]{x0394}V_{syrinx}(t)/V_{syrinx}(t=0)$
for the standard resolution (red solid line); an increased temporal (thick blue dashed line) and spatial (markers) resolution, respectively. Parameters as in figure 6.



