INTRODUCTION
Periodic large-scale natural disturbances are important in structuring ecological communities (Comita et al. Reference COMITA, URIARTE, THOMPSON, JONCKHEERE, CANHAM and ZIMMERMAN2009). The impact of these disturbances on the structure and function of these communities depends on the type and intensity of the disturbance, the area and the degree to which function and structure has recovered between episodes of disturbance (Beard et al. Reference BEARD, VOGT, VOGT, SCATENA, COVICH, SIGURDARDOTTIR, SICCAMA, TODD and CROWL2005). These periodic disturbances add to the heterogeneity of tropical forest environments as they alter biotic and abiotic conditions such as light, seedling density, water availability and nutrient resources (Comita et al. Reference COMITA, URIARTE, THOMPSON, JONCKHEERE, CANHAM and ZIMMERMAN2009, Engelbrecht et al. Reference ENGELBRECHT, COMITA, CONDIT, KURSAR, TYREE, TURNER and HUBBELL2007, Tanner & Bellingham Reference TANNER and BELLINGHAM2006). Climate change is expected to greatly influence the frequency and intensity of these events and as such, may have a serious impact on the structure, function and diversity of tropical forests (Dale et al. Reference DALE, JOYCE, MCNULTY, NEILSON, AYRES, FLANNIGAN, HANSON, IRLAND, LUGO, PETERSON, SIMBERLOFF, SWANSON, STOCKS and WOTTON2001).
In the Caribbean, disturbance events are mainly in the form of hurricanes; consequently, most studies have focused on their impact on tropical forest adult trees (Bellingham et al. Reference BELLINGHAM, TANNER and HEALEY1995, Boose et al. Reference BOOSE, FOSTER and FLUET1994, Tanner & Bellingham Reference TANNER and BELLINGHAM2006). Hurricanes affect forest structure through mortality of large trees and crown breakage (Dale et al. Reference DALE, JOYCE, MCNULTY, NEILSON, AYRES, FLANNIGAN, HANSON, IRLAND, LUGO, PETERSON, SIMBERLOFF, SWANSON, STOCKS and WOTTON2001, Tanner & Bellingham Reference TANNER and BELLINGHAM2006). Canopy damage can have severe impacts on plants living in the understorey directly, through increased leaf litter which may kill seedlings already present and inhibit seed germination, or indirectly through increased irradiance that desiccates existing seedlings (Comita et al. Reference COMITA, URIARTE, THOMPSON, JONCKHEERE, CANHAM and ZIMMERMAN2009). Positive effects may also accrue as increased irradiance promotes seedling germination and increases the growth of seedlings already present in the understorey (Uriarte et al. Reference URIARTE, CANHAM, THOMPSON, ZIMMERMAN and BROKAW2005). The increased mortality and survivorship of particular seedlings can result in a shift in the successional patterns and increased rates of species turnover and thus alter the future composition of forest communities (Dale et al. Reference DALE, JOYCE, MCNULTY, NEILSON, AYRES, FLANNIGAN, HANSON, IRLAND, LUGO, PETERSON, SIMBERLOFF, SWANSON, STOCKS and WOTTON2001).
Moreover, disturbance affects biotic interactions as increased recruitment in canopy gaps after hurricanes alters the density-dependent interactions among seedlings (Uriarte et al. Reference URIARTE, CANHAM, THOMPSON, ZIMMERMAN and BROKAW2005). Disturbances also affect both light and density on a large scale and are likely to be important drivers of seedling dynamics (Comita et al. Reference COMITA, URIARTE, THOMPSON, JONCKHEERE, CANHAM and ZIMMERMAN2009). This is supported by studies of mortality that show decreased mortality with increased irradiance, while mortality increases with increased density (Kobe & Vriensendorp Reference KOBE and VRIESENDORP2011, Webb & Peart Reference WEBB and PEART1999). This however, does not always hold true; Kobe (Reference KOBE1999) assessing seedling dynamics in a tropical rain forest in Costa Rica found that for some species, mortality decreased to a threshold above which mortality increased. Connell & Green (Reference CONNELL and GREEN2000) found evidence of reduced mortality with increased seedling density in a tropical rain forest in Queensland, Australia.
The seedling stage of tropical forest woody plants is likely to be sensitive to changes in environmental conditions and global climate change. The small size of seedlings and the limited development of root systems make them most vulnerable to environmental stresses (Boose et al. Reference BOOSE, FOSTER and FLUET1994, Engelbrecht et al. Reference ENGELBRECHT, KURSAR and TYREE2005). Understanding how the changes in environmental factors influence seedling dynamics is critical to understanding community dynamics. In this study, the dynamics of seedlings in a wet tropical forest in the John Crow Mountains (JCM), Jamaica was assessed following the passage of hurricane Dean in 2007. We hypothesized that the hurricane would alter the understorey light environment, which would in turn impact seedling interactions and dynamics; but responses to the hurricane will not be simple, predictable, or uniform and will vary over time and at the species level. Consequently, we examined the effects of the hurricane on understorey light conditions, seedling dynamics, and seedling and understorey light interactions, to determine how seedlings responded to changes in understorey conditions brought about by this natural disturbance event.
STUDY SITE
The JCM massif is located at the eastern tip of the Blue and John Crow Mountains National Park within the parishes of Portland and St. Thomas (18°4′60′′N, 76°24′0′′W), running parallel to the eastern coast of Jamaica (Kelly Reference KELLY, Thompson, Bretting and Humphreys1986). The JCM is subjected to high rainfall due to orographic uplift. Rainfall in the JCM ranges from 2814–2921 mm y−1 in coastal areas to 6150 mm y−1 in Millbank on the forest's western escarpment (Kelly Reference KELLY, Thompson, Bretting and Humphreys1986). Kelly (Reference KELLY, Thompson, Bretting and Humphreys1986) describes the JCM area as having karst terrain with outcroppings of white limestone, rising to an altitude of 1143 m asl. There is a transition along an altitudinal gradient from lower montane to upper montane forest with undisturbed broad-leaved forest found above 380 m asl. The island was impacted by several hurricanes and tropical storms during the mid-2000s, from Hurricane Ivan in 2004 (Category 4 Hurricane) to Hurricane Dean on 19 August 2007. Dean, a Category-4 hurricane, passed along the south of the island with its centre passing within 35 km of the coastline. Wind speeds of up to 101 km h−1 were recorded at the island's most eastern point, Morant Point, while speeds of 165 km h−1 were recorded at the south-west coast of Jamaica. This resulted in both canopy defoliation and tree fall in some plots. During the period 2009–2010, the island was affected by a drought, and the JCM experienced a 42% reduction in rainfall when compared with the previous years. Rainfall for the census periods totalled 5986 mm (June 2007–May 2008), 5800 mm (June 2008–May 2009) and 3381 mm (June 2009–June 2010). However monthly rainfall only fell below 100 mm for three months (May (89 mm), July (51 mm) and August 2009 (74 mm)); but despite the reduction in rainfall, there was no (calculated) soil water deficit.
METHODS
Research design
A total of 45 permanent sample plots (PSPs) were established within the wet forest of the JCM in 2004. The plots were established on both north-east- (NE; Ecclesdown: 27 PSPs) and south-west- (SW) facing slopes (Millbank: 18 PSPs) of the JCM. Plots were located along six ridges (three on either side) and arranged in blocks with three PSPs per block along an altitudinal gradient in a stratified randomized design. The blocks were established between 400–500 m, 600–700 m and 700–800 m asl. No blocks were established between 400–500 m on the south-facing Millbank ridges mainly due to an absence of undisturbed forest below 500 m. Within each block, the distance between plots was between 25 to 45 m. A total of 30 PSPs were randomly selected (two plots from each block) for seedling assessments. These plots were subdivided into 25 5 × 5-m subplots (25 m2) from which five subplots were randomly selected (comprising a total area 125 m2 per plot) for sampling seedlings and saplings. The selected subplots were further subdivided into 1 × 1-m quadrats for ease of measurement and locating seedlings within each subplot. A total sample area of 3750 m2 was used for this study.
Plot light environment
The light environment throughout all the PSPs was assessed using hemispherical photography. Photographs were taken using a Nikon coolpix 5400, 5.1 megapixel digital camera attached to a Delta T self-levelling mount (SLM5) with an 180° fish-eye lens. SLM5 keeps the camera and fish-eye lens aligned with the horizon with the aid of a compass and bubble level. Duplicate photographic images were taken at a height of 1 m in the centre of each 5 × 5-m subplot (25 in total) to quantify the light environment of a plot. Images were taken once per year at the beginning of the census period in June over a 2-wk period (light measurements were only taken on the Millbank side of the JCM in 2010). Images were analysed using Hemiview (Version 2.1. Delta-T Devices), which utilizes the solar track along with a hemispherical canopy photograph under uniform sky conditions (no direct sunlight) to determine direct site (direct solar radiation) and indirect site (diffuse solar radiation) factors. These are then used to calculate the global/total site (diffuse plus direct) factor under the canopy. Each pair of photographs was analysed until the difference in the GSF value calculated from both photographs was less than 2%, after which the two GSF values were averaged.
Seedling measurements
Seedlings were assessed annually over a 3-y period from June 2007 to June 2010. All tree seedlings in the randomly selected 5 × 5-m subplots were tagged (using numbered aluminium tags). Seedling height was measured twice from the substrate to the apical meristem along the seedling's stem and was averaged. Measurements were taken using a measuring tape (accuracy ± 0.1 cm), and were only recorded if the difference between two consecutive measurements was less than 0.2 cm. For this study, seedlings were considered to be plants up to 100 cm height and no greater than 20-mm root collar diameter (RCD). Seedlings identified in the field were recorded using vernacular names. Voucher specimens were later collected and their botanical names were determined using the University of the West Indies (UWI) herbarium specimens. Unidentified species comprised approximately 15% of total number of seedlings and saplings sampled.
Data analysis
The initial census was considered to consist of a mix of pre-existing seedlings of varied ages. New recruits were assigned to the cohort of the census in which they were collected: that is, Cohort 1 (June 2008), Cohort 2 (June 2009) and Cohort 3 (June 2010). The effect of density and light environment on recruitment, survivorship, mortality and height and RCD relative growth rates were assessed. Seedling and species recruitment, mortality, survivorship and growth were calculated annually as well as for each cohort over the entire duration of the study. Annual (dynamic) calculations were assigned to periods while static assessments (density and light) were assigned to the year the data were collected. For example growth between June 2008 and June 2009 was assigned to the period 2008–2009. Seedling recruitment was calculated as number of new seedlings per unit area. Mortality as a proportion/probability was calculated per plot as:
 \begin{equation*}
{\rm m} = 1 - (1 - ({\rm N}_0 - {\rm N}_1)/{\rm N}_0)^{1/{\rm t}},
\end{equation*}
where, N0 = number of seedlings at the beginning of a time period and N1 = number of survivors at end of time period and t is time between censuses in years (Tanner & Bellingham Reference TANNER and BELLINGHAM2006). Survivorship was considered as seedlings found alive in subsequent censuses and recorded as present. Seedling height relative growth rate (RGR) was calculated following Hoffmann & Poorter (Reference HOFFMANN and POORTER2002):
 \begin{equation*}
{\rm RGR} = (\ln \,{\rm M}_2 - \ln \,{\rm M}_1)/dt,
\end{equation*}
where M2 is measurement at end of period and M1 is measurement at beginning of period and dt the difference in time in years between measurements. Community diversity was examined using the Shannon Diversity Index. Statistical differences in sample diversity were calculated using the Hutcheson t-test method developed by Hutcheson (Reference HUTCHESON1970) and outlined in Zar (Reference ZAR1999):
 \begin{equation*}
T = ({\rm H}{\hbox{'}}1 - {\rm H}{\hbox{'}}2)/({\rm S}_{H{\hbox{'}}1 - H{\hbox{'}}2}),
\end{equation*}
where, SH’1 − H’2 = √ (S2H’1 + S2H’2). The variance is approximated by:
 \begin{equation*}
{\rm S}^2 _{{\rm H}{\hbox{'}}} = (\Sigma \,f_i \,\log ^2 f_i - (\Sigma \,f_i \,\log _{fi})^2 /n)/n^2,
\end{equation*}
where S2 is the variance of each H’, fi is the number of individuals of species i, and n is the sample size.
A generalized linear mixed model (GLMM) with a gamma distribution and a reciprocal link function was used to compare means among years (independent factor) for the light environment (GSF) and for all seedlings and 12 common species. For the latter two we used density, mortality, recruitment densities and RGR as dependent variables. Common species represents species with > 100 seedlings over all the censuses and were adequately distributed across all plots and sites. The GLMM allows for a statistical comparison using the Wald's Statistic. The output from this test was then compared using an F distribution for Wald's statistical test for fixed effects. The effects of density and light (independent variables) on the survivorship of seedling and the most common species (12 species) (dependent variables) were assessed using a maximum likelihood generalized linear model (GLM) with a binomial distribution and a logit link function. For this assessment, survivorship was considered as a binary outcome, that is, individual seedlings that were recorded during a survey and found in the subsequent survey were treated as alive and coded as 1. Conversely, a seedling that was not found was treated as dead and coded as 0. Community and species survivorship were assessed for each year (census period) separately as well as over the entire duration of the study regardless of time. Cohort analyses were only assessed over all, regardless of time. A GLM with a gamma distribution and a reciprocal link function was used to assess the effects of the independent variables light, heterospecific density and conspecific density (for mortality only) on recruitment for all seedlings, and seedling RGR and mortality (dependent variables) for all seedlings and 12 common species. We assessed annual differences by including year as an independent factor. Assessments were made over the entire duration of the study regardless of time or census period (or both). The output from the GLM analyses include the result of a post hoc t-test, where the parameter for the reference level (e.g. year) was constrained and all other factor levels were compared with the reference level. All statistical tests were performed using the Genstat Discovery Edition 3.0 (Version 7.03.0000, VSN International Ltd) statistical package. We did not include an assessment of the effects of elevation, because it was not found to significantly influence dynamics and biotic factors. Additionally, we compared mortality of common and uncommon species, which was calculated using all the individuals from both categories for each year.
RESULTS
Effects of the hurricane on understorey light and seedling dynamics
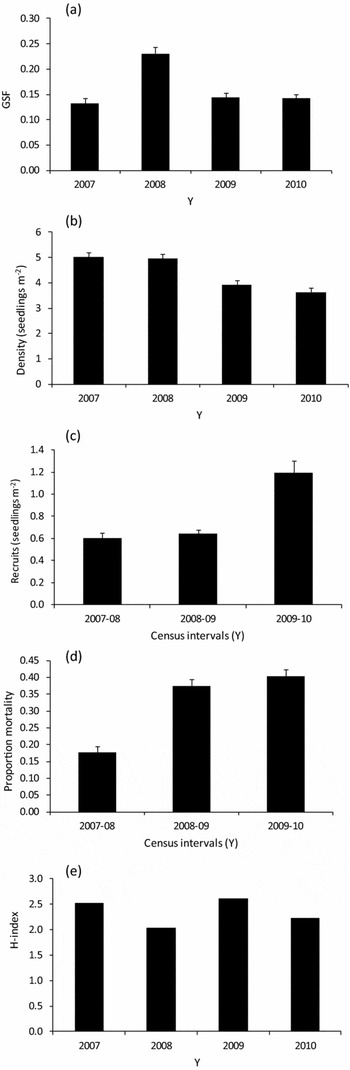
GSF increased significantly by approximately 60% between 2007 and 2008 (2007 vs. 2008, F1, 135 = 103, P < 0.001) following the passage of Hurricane Dean in August 2007 and returned to pre-hurricane levels in 2009 and 2010 (2007 vs. 2009, F1, 218 = 2.38, P = 0.125 and 2007 vs. 2010, F1, 158 = 1.83, P = 0.179, respectively; Figure 1a). GSF values ranged from 0.03–0.34 (average ± SE = 0.13 ± 0.006 in 2007, 0.22 ± 0.006 in 2008, 0.14 ± 0.005 in 2009 and 0.13 ± 0.004 in 2010; Figure 1a). Over the course of this study, a total of 26,809 seedlings of 62 species were sampled, of which 7924 were recruited, while 11,108 seedlings died. Seedling density declined significantly over time (F3, 232 = 22.5, P < 0.001) and did not vary significantly before (in 2007) and 1 y after hurricane (in 2008; F1, 114 = 1.38, P = 0.242); but declined in the two subsequent years (in 2009 and 2010; F1, 307 = 19.4, P < 0.001 and F1, 307 = 30.0, P < 0.001 respectively; Figure 1b). Seedling recruitment increased significantly over time between 2008 and 2010 (F2, 410 = 25.5, P < 0.001) with the significant increase (85%) occurring during the final period (2009 to 2010; F1, 266 = 32.7, P < 0.001; Figure 1c). There was a significant decline in the diversity of recruited seedlings over time (t 3355 = 544, P < 0.001). Specifically, Cohorts 1 (in 2008) and Cohort 2 (in 2009) were significantly different (t 2392 = 30.7, P < 0.001) and both were significantly higher than cohort 3 (in 2010) (P < 0.001 each year) despite an increase in the number of recruits (H index for 2008, 2009 and 2010 were 2.70, 2.76 and 1.91, respectively). Seedling mortality was lowest in the first period (2007–2008) and increased significantly (doubled) during the period after the hurricane (2008–2009; F1, 290 = 126, P < 0.001; Figure 1d) and increased again during the final period (2009–2010; F1, 295 = 161, P < 0.001; Figure 1d). The diversity of seedlings decreased from a pre-hurricane diversity of 54 species in 2007 to 44 species in 2008, but increased to 46 species in 2009 and was unchanged in 2010. This was reflected in the H index, which also differed significantly among the years (Figure 1e). It declined (lowest value) during the census following the hurricane, increased 2 y after the hurricane and declined again in the final census (Figure 1e). This decline in diversity coincided with higher mortality of uncommon (vs. common) species. During the 2007–2008 period, mortality of the most common species was lower (0.257) than that of uncommon species (0.543). Therefore a higher mortality of uncommon species may have contributed to the significant decrease in diversity (Figure 1e). For the 2008–2009 period, mortality was 0.258 and 0.282 for common and uncommon species respectively, and as a result, the H index and overall diversity increased (Figure 1e). For the final period (2009–2010) mortality was again higher for uncommon species (0.368), compared with common species (0.117), and again the H-index decreased (Figure 1e).
Mean values (± SE) for GSF (global site factor) (a) and seedling densities (b) and recruitment densities (c), seedling mortality (d) and height relative growth rate (RGR) (e) for the initial population, cohorts 1 and 2 (new recruits recorded in June 2008 and 2009, respectively) recorded for each period in the John Crow Mountains, Jamaica.

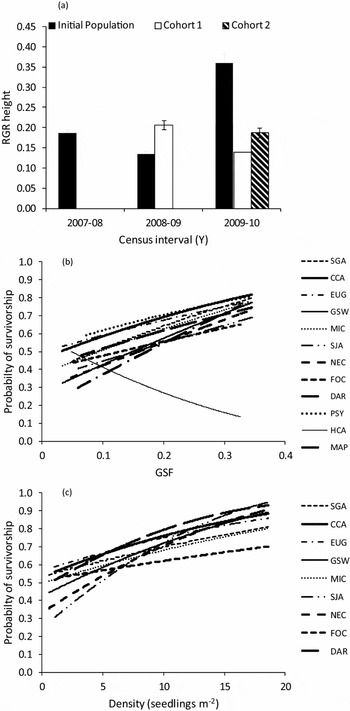
The initial population recorded significantly higher RGRs during the period of the hurricane (2007–2008) when compared with the following period (2008–2009; F1, 292 = 32.4, P < 0.001; Figure 2a). Also RGR was highest in the final period (2009–2010) and significantly higher than the first period (2007–2008; F1, 292 = 72.0, P < 0.001; Figure 2a). The highest RGR for cohort 1, was recorded in its first period (2008–2009), after which there was a significant reduction in the 2009–2010 period (F1, 238 = 14.9, P < 0.001; Figure 2a); however, height RGR did not differ significantly between initial and Cohort 1 in their first period (Figure 2a). Overall, community RGR followed a pattern similar to the initial population although it was not found to be significantly different among the periods.
Predicted relationship between the probability of survivorship and GSF for 12 (out of 12) species (a) and density for nine (out of 12) species (b) that returned a significant result in the John Crow Mountains, Jamaica. Species codes are as follows: CCA = Calophyllum calaba; DAR = Dendropanax arboreus; EUG = Eugenia spp.; FOC = Faramea occidentalis; GSW = Guarea swartzii; HCA = Hernandia catalpifolia; MAP = Matayba apetala; MIC = Miconia sp.; NEC = Nectandra spp. PSY = Psychotria sp.; SGA = Symphonia globulifera; SJA = Sapium jamaicense.

Light, seedling density and seedling dynamics interactions
Overall, there was a positive relationship between seedling density and light (F1, 352 = 15.5, P< 0.001). Mortality was not significantly related to light but declined with increasing density (Table 1). Survivorship was positively related to both density (Table 1) and light environment (Table 1). However, RGR was not significantly related to light availability or seedling density. Seedling recruitment declined with increasing GSF (Table 1), but there was a positive relationship between seedling recruitment and density (Table 1). The relative importance of light varied during each census interval, and generally, it was either important before the hurricane, or after the canopy closed (but not during the period of the hurricane, 2007–2008). The exception was the relationship between seedling recruitment and density, which was positive during each period. All other interactions however, were affected by the hurricane. The relationship between seedling density and light was positive and significant before (2007; F1, 61 = 4.62, P < 0.036) and 2 y after (2009) the hurricane (F1, 61 = 9.68, P< 0.003). The relationship between density and light was not assessed for 2010 because GSF was not measured on the south-west face of the mountain. There was a negative relationship between recruitment and light and between mortality and light during the final period (Table 1); all other periods assessed were not significant. Mortality was not related to density during the period of the hurricane (2007–2008), but declined with increasing density when the canopy closed (Table 1). Survivorship was not related to the light environment for the individual periods, and was not related to density during the period of the hurricane; but there was a significant positive relationship with density after the canopy closed (Table 1). Seedling RGR was positively related to light during the final period (Table 1).
Results of GLMs used to assess the relationship between seedling dynamics (recruitment, mortality, survivorship and height relative growth rate) and light or density, over the entire study period and for each census period, during the passage of the hurricane (2007–2008) and after the hurricane, in the John Crow Mountains, Jamaica. + = Positive relationship; − = Negative relationship; df = degree of freedom; F = F ratio; P = probability; ns = not significant.

Species effects
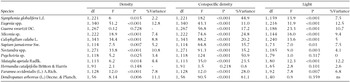
Overall, RGR was not related to either light availability or density for the species assessed. The probability of survival was positively related to increasing light (P < 0.001; Figure 2b) for most species, except for Hernandia catalpifolia, which showed a negative relationship (P < 0.001; Figure 2b). The probability of survival was positively related to increasing density (P < 0.001 for each species; Figure 2c) for most species, except for three species that showed no significant relationship (H. catalpifolia, Psychotria sp. and Matayba apetala). There was a significant decline in the probability of mortality with increasing heterospecific and conspecific density for most species. Also the variance accounted for by conspecific density was higher (Table 2). Hernandia catalpifolia showed no relationship with heterospecific or conspecific density (Table 2). Mortality declined with increasing understorey light for most species except H. catalpifolia, Psychotria sp. and Dendropanax arboreus (Table 2).
Results of the pseudo-likelihood GLM analysis of the relationship between species mortality and heterospecific density, conspecific density and light in the John Crow Mountains, Jamaica. % Variance refers to percentage variance accounted for by the model. df = degree of freedom; F = F ratio; P = probability; ns = not significant.

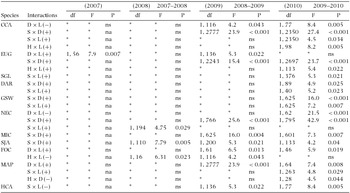
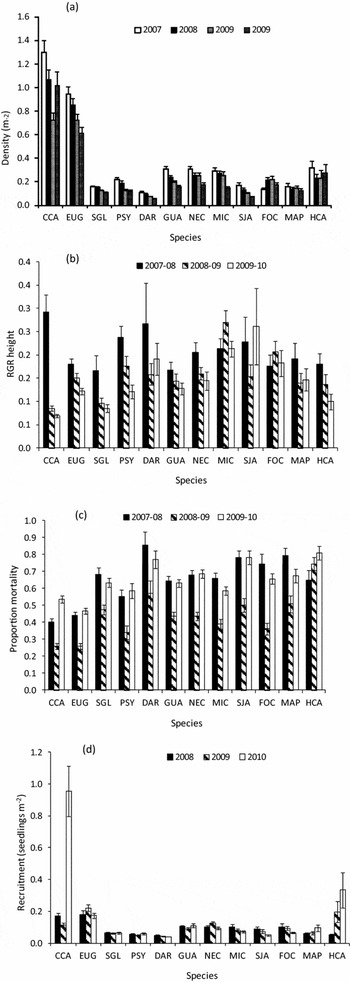
The species assessed varied in their response to the hurricane and the subsequent closing of the canopy. Abiotic factors and seedling interactions only became important when the canopy closed and the importance of these factors varied among the species assessed and over time. We separated the 12 species assessed along a continuum of responses, based on whether they recorded their highest density before the hurricane, after which density declined significantly over time (nine species; Figure 3a), or whether density was stable over time (three species; Figure 3a). They were further separated based on whether they benefited from the increase in light (recording their highest RGR during the period of the hurricane), and/or a reduction in mortality (a lag) (Figure 3b & c; Table 3). A final separation was based on the significance of density and light interactions over time (Table 3).
Results of GLMs used to assess the relationship between seedling dynamics (density (D) survivorship (S) and height relative growth rate (H)) and light (L) or density, for each year (highlighted by brackets for density × light only) and each period, during the passage of the hurricane (2007–2008) and after the hurricane, for 11 species that returned a significant result in the John Crow Mountains, Jamaica. + = Positive relationship; − = Negative relationship; df = degree of freedom; F = F ratio; P = probability; ns = not significant; na = not applicable. Species codes are as follows: CCA = Calophyllum calaba; DAR = Dendropanax arboreus; EUG = Eugenia spp.; FOC = Faramea occidentalis; GSW = Guarea swartzii; HCA = Hernandia catalpifolia; MAP = Matayba apetala; MIC = Miconia sp.; NEC = Nectandra spp.; SGL = Symphonia globulifera; SJA = Sapium jamaicense.

Mean (± SE) density (a), height relative growth rate (RGR) (b), mortality (c) and recruitment density (d) for 12 of the most common species sampled in the John Crow Mountains. Species are ordered according to their position along a continuum of responses. Species codes are as follows: CCA = Calophyllum calaba; DAR = Dendropanax arboreus; EUG = Eugenia spp.; FOC = Faramea occidentalis; GSW = Guarea swartzii; HCA = Hernandia catalpifolia; MAP = Matayba apetala; MIC = Miconia sp.; NEC = Nectandra spp.; PSY = Psychotria sp.; SGA = Symphonia globulifera; SJA = Sapium jamaicense.

The first four species (of the nine species) along the continuum (significantly higher RGR during and lower mortality after the hurricane) includes Calophyllum calaba and Eugenia spp., which recorded the highest densities and highest RGR, for C. calaba of all the species assessed, and benefited from sites with higher densities and understorey light after the canopy closed (Figure 3a; Table 3). However, for C. calaba, high-density sites became inversely related to light (Table 3). The remaining species either only benefited from light (Symphonia globulifera) or did not benefit from density and light interactions when the canopy closed (Psychotria sp.). Of the five species (of the nine) with only lower mortality after the hurricane (Figure 3c), three species either benefited from density interactions during the period of the hurricane (Nectandra spp.) or after the canopy closed or when the canopy closed (Dendropanax arboreus and Guarea swartzii) (Table 3). They also benefited from high densities in the final census (although the density of Nectandra spp. was inversely related to light) (Table 3). The remaining two species only benefited positively from high densities (Miconia sp. and Sapium jamaicense) (Table 3). Two of the three species with stable densities, Faramea occidentalis and Matayba apetala, benefited from a reduction in mortality only (Figures 3a & c; Table 3). RGR of F. occidentalis, understorey tree species, was negatively affected by light when the canopy opened and when the canopy closed, density was positively related to light (Table 3). Matayba apetala recorded higher densities at sites with higher light levels, and survivorship increased with light, but higher densities had a negative effect on growth (Table 3). The pattern exhibited by the last species along the continuum, Hernandia catalpifolia, was not clear. It benefited from the hurricane (Table 3), but survivorship was inversely related to understorey light when the canopy closed. Despite an increase in mortality, density remained stable, possibly due to an increase in seedling recruitment.
DISCUSSION
The effects of the hurricane
Understorey light levels increased, as expected, due to canopy damage following the passage of Hurricane Dean in August 2007 and understorey light levels declined to pre-hurricane Dean levels in the subsequent censuses (in 2009 and 2010; Figure 2a). Other studies have reported a quick recovery of forest canopy following hurricanes through refoliation and resprouting. Walker et al. (Reference WALKER, LODGE, GUZMÍN-GRAJALES and FETCHER2003) reported rapid decline in forest site factors (indirect site factors and direct site factors) 1 y after Hurricane Hugo in a hurricane-driven rain forest in Puerto Rico. Rapid growth and sprouting of understorey plants following the passage of Hurricane Georges in subtropical wet forest in Puerto Rico were also observed and this (coupled with canopy regrowth) contributed to decreased light availability for seedlings (Comita et al. Reference COMITA, URIARTE, THOMPSON, JONCKHEERE, CANHAM and ZIMMERMAN2009).
Despite the recovery of the forest canopy, GSF values recorded before (2007) and after (2009 and 2010) the hurricane, are higher than some values reported for other tropical rain forests. The passage of previous hurricanes and tropical storms in the years preceding 2007 damaged the forest canopy, resulting in additive effects on understorey irradiance. The low irregular canopy that exists in the JCM may also have contributed to the elevated understorey light levels. A low irregular canopy has been reported by other studies to contribute to elevated levels of understorey irradiance (Denslow & Guzman Reference DENSLOW and GUZMAN2000, Poorter & Arets Reference POORTER and ARETS2003). Although understorey irradiance is higher than other tropical forests it is not entirely dissimilar to other studies; Numata et al. (Reference NUMATA, YASUDA, OKUDA, KACHI and SUPARDI2006) reported a range of 0.06–0.13 ISF in canopy gaps in two stands of lowland rain forest in Malyasia, while Poorter & Arets (Reference POORTER and ARETS2003) found DSF ranges of 0–27.5% in lowland moist forest in Bolivia. Steep slopes are characteristic of the JCM and these have been shown to contribute to increased understorey light levels (Fladeland et al. Reference FLADELAND, ASHTON and LEE2003, Tateno & Takeda Reference TATENO and TAKEDA2003).
An increase in understorey irradiance following a hurricane can result in increased seedling densities immediately following the disturbance event, followed by a decline in seedling densities in subsequent years (Comita et al. Reference COMITA, URIARTE, THOMPSON, JONCKHEERE, CANHAM and ZIMMERMAN2009, Walker et al. Reference WALKER, LODGE, GUZMÍN-GRAJALES and FETCHER2003). However, in our study, despite an increase in understorey light after the hurricane, there was no increase in seedling density during this period; instead there was a decline in seedling density in the years after the hurricane (despite a significant increase in the number of recruits during the final census period). The forest experienced a series of hurricanes, two in 2004, and two in 2005, possibly opening up the canopy in both years. Therefore, seedling density may have increased before our study began, and was maintained by the passage of the hurricane in 2007. But, eventually, as the forest canopy recovered and light conditions became limited, these seedlings were unable to persist in the limited light conditions of the understorey leading to a reduction in seedling density over time (Comita et al. Reference COMITA, URIARTE, THOMPSON, JONCKHEERE, CANHAM and ZIMMERMAN2009). Comita et al. (Reference COMITA, URIARTE, THOMPSON, JONCKHEERE, CANHAM and ZIMMERMAN2009) reported an increase in seedling mortality over time in Puerto Rico following the passage of Hurricane Georges. We found that overall there was a complementary decrease in seedling density and an increase in seedling mortality over time. However, mortality was lower in sites with high densities, presumably, due to higher light levels at these sites. Also, Hurricane Dean had no significant effect on the density and diversity of recruits (which was maintained at hurricane levels and declined after the canopy closed). Seedling diversity fluctuated over time and the initial decrease in diversity during the period of the hurricane may be due to an increase in mortality of uncommon species, which was higher during this period. Therefore, the hurricane had a negative effect on diversity possibly by increasing mortality of the least common species found in the community.
The effects of light and density on seedling dynamics
Seedling mortality is expected to decrease with increasing light availability (Connell & Green Reference CONNELL and GREEN2000, Kobe Reference KOBE1999, Kobe & Vriesendorp Reference KOBE and VRIESENDORP2011). We found no overall relationship between light and mortality; but light was positively related to survivorship and site differences exemplified the importance of understorey light. The importance of light changed over time due to the effects of the hurricane. Comita et al. (Reference COMITA, URIARTE, THOMPSON, JONCKHEERE, CANHAM and ZIMMERMAN2009) found that canopy openness was a significant predictor of survival in their first census interval after Hurricane Georges in a tropical rain forest in Puerto Rico. But we found no relationship between light and survivorship for the individual census periods, although mortality was inversely related to light when light levels were reduced to pre-hurricane levels. We surmise that during the period of the hurricane, light was no longer a limiting factor; consequently, density and survivorship were therefore independent of understorey light. As the canopy closed, the seedlings appear to aggregate in high densities at sites that experience higher light and lower mortality (explained by the positive relationship between density and light and survivorship before and/or 1 y after the hurricane). However, seedling densities at favourable sites may have already been high because of the impact of previous hurricanes; as such, high densities were maintained by the passage of this hurricane. Furthermore, regardless of the light requirements of individual species, an increase in understorey light will result in an increase in survivorship in most species (Kobe Reference KOBE1999, Poorter & Arets Reference POORTER and ARETS2003) or a reduction in mortality. For some species, seedling survivorship can be reduced in a high-light environment (Comita et al. Reference COMITA, URIARTE, THOMPSON, JONCKHEERE, CANHAM and ZIMMERMAN2009). The latter was not clearly manifested at the species level for any of the species we examined (except H. catalpifolia), although there was possibly a lag in the reduction of mortality. This was probably due to higher mortality during the period of the hurricane, and surviving seedlings recorded lower mortality until the canopy closed. Reduced survival at high light levels could be as a direct result of sunscald or photoinhibition or indirect result of a reduction in humidity and soil moisture as a result of loss of forest canopy (Comita et al. Reference COMITA, URIARTE, THOMPSON, JONCKHEERE, CANHAM and ZIMMERMAN2009).
Additionally, an increase in understorey light is usually related to an increase in relative growth rates (Poorter Reference POORTER1999). In the JCM, during the period of the hurricane, when light was not a limiting factor, there was no relationship between light and growth. But eventually, growth became positively related to higher understorey light after the canopy closed when light was a limiting factor. Also, Walker et al. (Reference WALKER, LODGE, GUZMÍN-GRAJALES and FETCHER2003) reported a decline in growth (by four species) between first and second census intervals in response to Hurricane Hugo at a tropical rain forest in Puerto Rico, after the canopy closed. We found a similar trend for the initial cohort (significant) and a significant decline for most species examined. However, there was an increase in growth in the final census (that was not significant overall but significant for the initial cohort), when there was a reduction in rainfall. Also, seedling recruitment declined with increasing understorey light, possibly indicating that as light declined over the census periods recruitment became progressively higher at sites with lower understorey light, perhaps under trees that were not toppled by the hurricane (in this forest, most species are gravity dispersed). Moreover, increased recruitment from a few species resulted in the only significant (negative) relationship with GSF during the final census, which again may have occurred away from sites with high understorey light.
Species response to disturbance
We found that overall survivorship was positively related to light for most species. Mortality was lower overall and survivorship was higher in higher densities for most species. However, for two species (M. apetala and Psychotria sp.) this was not clear-cut, as they either recorded a significant relationship between survivorship and density but a non-significant relationship between mortality and density or vice-versa. Generally, most species benefited from the opening of the canopy and this was exhibited by higher growth during the census period of the hurricane and a subsequent reduction in mortality when the canopy closed. Comita et al. (Reference COMITA, URIARTE, THOMPSON, JONCKHEERE, CANHAM and ZIMMERMAN2009) reported that there was considerable variation in the importance of abiotic and biotic factors at the species level in a hurricane-impacted tropical forest in Puerto Rico. We found a similar result in the JCM, as the importance of light and seedling interactions were more pronounced either before the hurricane or after the canopy closed and varied in importance among the species and among the years after the canopy closed. Calophyllum calaba benefited the most from the hurricane, and further benefited from abiotic factors and seedling interactions after the canopy closed. Matayba apetala was the only species to simultaneously record positive (higher densities and survivorship with increasing light) and negative effects (a reduction in RGR) of high densities when the canopy closed. Hernandia catalpifolia was the most unusual of all of the species assessed as it showed a pattern of survivorship consistent with both a light-demanding (lower mortality and higher growth when the canopy was open) and a shade-tolerant species (lower survivorship at high-light sites under the canopy). Also, for Miconia sp., Nectandra spp. and Sapium jamaicense, density was not linked to light availability, or was inversely related to light when the canopy closed, yet survivorship increased with density during two or three census periods.
Conclusion
Disturbance events (i.e. hurricane) are expected to alter the abiotic and biotic environment of the forest understorey. In this study, seedlings aggregated in high densities at favourable sites with relatively high understorey light. Consequently, areas of high density represent microsites that offer benefits to seedling establishment and growth. Accordingly, sites with both high densities and/or light were found to enhance survivorship. Hurricane Dean increased understorey light in this forest and did not appear to significantly impact seedling dynamics. However, species diversity declined immediately after the hurricane, and this decline in diversity may have been associated with an increase in the mortality of uncommon species. Also, the hurricane altered the relative importance of light and seedling interactions, which also varied in importance among the years and among the species. Periodic changes in these interactions and the effects of the hurricane on individual species resulted in a continuum of responses, which ranged from positive, neutral to negative. An increase in the frequency of hurricanes due to global climate change will likely have both positive and negative effects on seedling dynamics and will ultimately alter species composition.
ACKNOWLEDGEMENTS
We wish to thank the Rufford Foundation, International Foundation for Science, the Wildlife Conservation Society and The Environmental Foundation of Jamaica for providing funding for initial assessments. We would like to also thank our field assistant Mr Kirk Lewis.