THE IMPORTANCE OF CO-INFECTION
For the majority of human and animal populations worldwide, infectious disease is not the result of a single pathogen, but the consequences of multiple pathogens infecting the host simultaneously (Christensen et al. Reference Christensen, Nansen, Fagbemi and Monrad1987). Even in cases where current infection is the result of a single pathogen species, prior history of infection may be important in determining the outcome of current infection (Walzl et al. Reference Walzl, Tafuro, Moss, Openshaw and Hussell2000).
Despite the fact that co-infection can influence the clinical outcome of disease, there is little information in the literature, with the possible exception of concurrent infections with HIV (Harms and Feldmeier, Reference Harms and Feldmeier2002; Kontorinis, Agarwal and Dieterich, Reference Kontorinis, Agarwal and Dieterich2005; Rockstroh, Reference Rockstroh2006; Sullivan et al. Reference Sullivan, Hanson, Teshale, Wotring and Brooks2006), as to the consequences of particular pathogen co-infection combinations. This paucity of data leaves the clinician without a clear idea of how any particular combination of infectious agents may alter the course of disease or the efficacy of any treatment regime. Even where clinicians do realise the potential problems caused by co-infection, they have little choice but to treat the various pathogen species as if each were infecting the host singly. Such decisions are inevitable given that most pathogen control strategies have been extended from laboratory studies, in which hosts are infected with only one pathogen at time. No current mechanism exists by which clinicians can make informed decisions about best practice when presented with a co-infected patient. Nevertheless, it is becoming increasingly clear, from both theoretical and clinical studies, that treating co-infected patients as if they were infected with a series of isolated pathogen species is insufficient and may lead to ineffective disease control or even to increased damage to the host (Lello et al. Reference Lello, Boag, Fenton, Stevenson and Hudson2004; Brown et al. Reference Brown, Mawa, Joseph, Bukusuba, Watera, Whitworth, Dunne and Elliott2005).
Co-infection has consequences for both the host and the pathogen species involved. For example, concurrent or prior infection may increase pathogen virulence and this in turn could lead to increased disease severity (Graham et al. Reference Graham, Lamb, Read and Allen2005; Abu-Raddad, Patnaik and Kublin, Reference Abu-Raddad, Patnaik and Kublin2006; Deka et al. Reference Deka, Vanover, Dessus-Babus, Whittimore, Howett, Wyrick and Schoborg2006; Hughes and Shafran, Reference Hughes and Shafran2006; Page, Scott and Manabe, Reference Page, Scott and Manabe2006). Recent studies have highlighted how the severity of the disease caused by one organism may be altered by the presence of a second species. For example, infection with Hepatitis C has been reported to increase the incidence of AIDS defining events in HIV infected patients (Stebbing et al. Reference Stebbing, Waters, Mandalia, Bower, Nelson and Gazzard2005). Similarly, chickens co-infected with cryptosporidium and Marek's Disease show increased severity of both diseases when compared to singly infected individuals (Abbassi et al. Reference Abbassi, Dambrine, Cherel, Coudert and Naciri2000). However, it should be noted that not all co-infection leads to increased severity of disease. Indeed, in some cases co-infection may lead to decreased disease severity. For example, one study shows that infection with rotavirus is less severe if the host is concurrently infected with Giardia lamblia (Bilenko et al. Reference Bilenko, Levy, Dagan, Deckelbaum, El-on and Fraser2004). Similarly, influenza-induced pathology in mice is ameliorated by co-infection with Trichinella spiralis (Furze, Hussell and Selkirk, Reference Furze, Hussell and Selkirk2006). In these latter two cases, it may be advisable to hold back on treatment of one species (in these cases G. lamblia and T. spiralis) until after the more damaging infection has been cleared, rather than attempting to treat both diseases simultaneously. Without a clear understanding of the dynamics of the whole system, such delayed treatment might have other unforeseen consequences.
The duration of the disease may also be altered by co-infection (Walzl et al. Reference Walzl, Tafuro, Moss, Openshaw and Hussell2000) and extended infections may be due to increased survival or fecundity of the parasite or to a reduced capacity of the host to resist or eliminate the infection(s). Whatever the cause, increased disease duration can mean a longer period of infectiousness for the patient (and hence transmission opportunities for the pathogens) and may also lead to increased disease severity, simply because the host accumulates damage over a longer period.
Finally, both treatment efficacy and the degree to which the treatment itself harms the patient may be affected by co-infection. For example, a recent study has shown that treatment for schistosomiasis causes an increase in HIV viral load in co-infected individuals (Brown et al. Reference Brown, Mawa, Joseph, Bukusuba, Watera, Whitworth, Dunne and Elliott2005). Further, co-infection may buffer pathogen species from the effects of a treatment strategy, or could favour one pathogen over another (thus producing an apparent competition and potentially changing the aetiology of the disease). Where competition between pathogen species has resulted in a more virulent species being suppressed, targeted control of the competitor could release the virulent species from its constraints and the host may suffer a more severe disease than if the treatment had not occurred (Lello et al. Reference Lello, Boag, Fenton, Stevenson and Hudson2004).
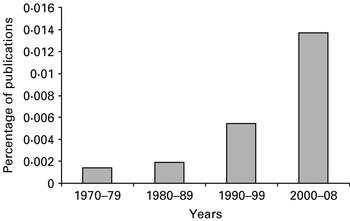
There is undoubtedly a growing comprehension of the importance of co-infection, which may be seen in the rapid increase in the percentage of publications in which the words, co-infection or mixed infection are found within the title (Fig. 1). Currently, only prior knowledge of the consequences of particular combinations of pathogens can provide the clinician with any solid decision-making tool and there are very few published examples of such co-infection data. Why then has no mechanism been developed to aid clinicians in dealing with co-infected patients? We believe that the reason is that the problem is viewed as intractable, given the virtually infinite number of possible combinations of pathogens with which human and animal hosts may be infected. In order to provide clinicians with a tool with which they could deal with any potential co-infection combination, some simplification mechanism must be found. In this review we present one possible mechanism for simplification. It is important to be clear that we are not proposing this mechanism as the only potential simplification that could be undertaken, nor will we present a finished product, but rather we describe one possible method for achieving this aim.
Increase in the percentage of publications containing the terms ‘co-infection’ or ‘mixed infection’ in the title, as calculated from a Web of Science® search between 1970 and 2008.

PATHOGEN INTERACTION THROUGH IMMUNITY
Every pathogen will have some degree of effect on the immune system of the host, stimulating or suppressing particular pathways of the immune response. These various pathways are interlinked through up- and down-regulatory mechanisms. Therefore, unless the immune response against a pathogen is entirely localised and the pathogens involved in the co-infection are spatially separated, we should expect that one organism would usually have an effect upon another when co-infecting a host. For example, in humans, there is a known see-saw response between the Th1 and Th2 branches of the immune response, such that an increase in the Th1 response generally results in a lower Th2 response and vice versa (Diehl and Rincon, Reference Diehl and Rincon2002). Page et al. (Reference Page, Scott and Manabe2006) discuss the effects of a strongly Th2-inducing infection with the mouse nematode, Heligmosomoides polygyrus, on the host response to a subsequent infection with the bacterium Helicobacter felis. The helminth infection is associated with a down-regulation of the Th1 response against the bacterium. In this case the pathology of the disease is largely immune mediated and hence this down-regulation could be interpreted as a positive outcome. Conversely if a Th1-inducing organism such as T. gondii infects the host first, then the Th1-induced damage increases.
It should be noted that direct interactions between pathogen species are also possible, but even less documentation may be found on the consequences of these co-infections. Further, it is generally more difficult to establish the mechanism for direct pathogen interactions, as the tools with which they could be elucidated have not been developed to the same extent as immunological parameter assessments. Co-infecting pathogens are often separated into different physical niches within the host, either in different tissues and organs or in different cellular compartments (e.g. outside of host cells, free within the cytoplasm or in vesicles within the cytoplasm) and direct interactions are less likely to occur in such cases. Therefore, we believe that direct interactions are likely to make up a smaller subset of the overall potential co-infection mechanisms, although this is open for debate. Whatever the overall importance of such non-immune-mediated interactions, because of the lack of available data on this topic we will not consider them further. Nevertheless, in the limited number of pathogen systems where such information is available, there is no reason that they could not be included in the overall framework described hereafter.
FUNCTIONAL/GUILD GROUPINGS: A MECHANISM FOR SIMPLIFICATION
Well-established concepts in ecology are the functional group and the guild (Catovsky, Reference Catovsky1998; Blondel, Reference Blondel2003; Davic, Reference Davic2003; Biber, Harwell and Cropper, Reference Biber, Harwell and Cropper2004; Davis et al. Reference Davis, Liu, Perner and Voigt2004; Dumay et al. Reference Dumay, Tari, Tomasini and Mouillot2004; Wardle and Zackrisson, Reference Wardle and Zackrisson2005; Petchey and Gaston, Reference Petchey and Gaston2006; Storkey, Reference Storkey2006; Pedersen and Fenton, Reference Pedersen and Fenton2007). The two terms are often used synonymously and may indeed define the same groups under certain circumstances. However, in a review of the topic by Blondel (Reference Blondel2003) the two terms are considered as separate, with the functional groups being associated with ‘effects’ upon the ecosystem (functions they perform) and guilds being defined by resource use or ‘response’ to the ecosystem. Of course, any particular organism may be categorised either into a functional group or a guild, and it would be possible to create a new group definition which combines both functional group and guild concepts. Functional groups and guilds may contain taxonomically related species but can also cross such taxonomic boundaries (Blondel, Reference Blondel2003; Hood et al. Reference Hood, Laws, Armstrong, Bates, Brown, Carlson, Chai, Doney, Falkowski, Feely, Friedrichs, Landry, Moore, Nelson, Richardson, Salihoglu, Schartau, Toole and Wiggert2006). For example, the broad functional group ‘decomposers’ may include bacteria, fungi and soil animals such as earthworms and collembolans (Milcu et al. Reference Milcu, Partsch, Langel and Scheu2006). Similarly, the oceanic functional group termed calcifiers includes phytoplankton, zooplankton and reef-building coral species (Hood et al. Reference Hood, Laws, Armstrong, Bates, Brown, Carlson, Chai, Doney, Falkowski, Feely, Friedrichs, Landry, Moore, Nelson, Richardson, Salihoglu, Schartau, Toole and Wiggert2006). There has been wide debate about the definition and usefulness of functional groups and guilds, and it is possible for the same organism to be placed into entirely different groupings (under either term) based upon the criteria used to define the groups (Petchey and Gaston, Reference Petchey and Gaston2006). Obviously, the usefulness of this group approach to conceptually simplifying complex ecosystems is only as good as the accuracy of the group definitions. The best examples of using such groupings effectively are those where the groups are defined in association with the question being investigated. For example, if the question relates to nutrient cycling, then the definition of the functional groups must be directly related to an organism's place in this process (Hood et al. Reference Hood, Laws, Armstrong, Bates, Brown, Carlson, Chai, Doney, Falkowski, Feely, Friedrichs, Landry, Moore, Nelson, Richardson, Salihoglu, Schartau, Toole and Wiggert2006; Petchey and Gaston, Reference Petchey and Gaston2006). Any particular organism might have a different grouping if the question being examined was related to some other aspect of its environmental activity or response, e.g. trophic level. Similarly, organisms may shift between groups at different stages of their life cycle (Blondel, Reference Blondel2003) and the groupings should be seen as dynamic. If the groups are clearly defined then the relationships between them are also clear and predictable e.g. primary producers fix energy from the sun, or other sources, and provide food for the first trophic level of consumers.
One advantage to creating functional groups is that any novel organism's influence upon its ecosystem may be predicted by assigning that organism to one of the defined functional groups, based on some typical group characteristics (King, Andersen and Cutter, Reference King, Andersen and Cutter1998; Storkey, Reference Storkey2006). Plant ecologists have made particularly good use of this concept in a number of studies, where plant functional groups are defined based upon combinations of easily measured characteristics such as leaf thickness or tree height (Foster and Brooks, Reference Foster and Brooks2005; Poorter, Bongers and Bongers, Reference Poorter, Bongers and Bongers2006).
Ecosystem models, using functional groups, have proven highly effective as methods to understand the mechanics of ecosystems and to predict the outcomes of perturbations to those systems (Biber et al. Reference Biber, Harwell and Cropper2004; Dumay et al. Reference Dumay, Tari, Tomasini and Mouillot2004; Storkey, Reference Storkey2006). Fulton et al. (Reference Fulton, Parslow, Smith and Johnson2004) describe the simplification of a very complex Integrated Bay Ecosystem Model (IGBEM) by use of functional groups. The resulting Bay Model 2 (BM2) agreed well with the more complex model in its capacity to predict a range of features from predicted biomass through to community composition of the benthos, and, in fact, was a better predictor of this latter feature. As the functional groups alone are clearly accurate predictors of the system, this guides understanding of what the key processes are within that system. Biber et al. (Reference Biber, Harwell and Cropper2004) describe the use of a functional group model of macro-algae within a seagrass habitat in South Florida which they use to predict annual biomass dynamics. They validated the model with real data and then used it to examine the productivity responses under a range of stress conditions imposed by freshwater discharges. Although the model failed to predict responses in canal-influenced conditions, it did very well under sheet-flow and oceanic conditions, and the failure in the former case was thought to be due to a lack of data on one of the functional groups. These examples provide evidence of the potential usefulness of functional group models and show that, where they fail, they are also useful in defining what additional information is required to improve their accuracy.
APPLYING THE FUNCTIONAL GROUP APPROACH TO PATHOGENS
For a pathogen infecting a host, its ecosystem consists of the components of the host biology and immunology and of any other species of pathogen with which the first pathogen species may interact. Importantly, any of these components of the ecosystem may be altered by the actions of the other components. If we take a functional group guild approach, with organisms defined by their effects upon and responses to the ecosystem, then the usual mechanism for grouping pathogens by taxa (e.g. viruses, protozoa, bacteria, helminths) may not apply. We might find that one functional group contains a number of intracellular viruses, bacteria and protozoa, all of which invade host cells and evade the immune response for a time (Werling et al. Reference Werling, Howard, Niederer, Straub, Saalmuller and Langhans1998; Carlyon and Fikrig, Reference Carlyon and Fikrig2003; Shumilla et al. Reference Shumilla, Lacaille, Hornell, Huang, Narasimhan, Relman and Mellins2004). Conversely, two helminth species might be placed in different functional categories because their effects on immune components are markedly different (Turner et al. Reference Turner, Faulkner, Kamgno, Cormont, Van Snick, Else, Grencis, Behnke, Boussinesq and Bradley2003; Stadecker et al. Reference Stadecker, Asahi, Finger, Hernandez, Rutitzky and Sun2004). However, it is worth noting that functional groups and guilds do often contain multiple organisms from the same taxonomic grouping (Blondel, Reference Blondel2003).
There is little discussion in the literature regarding the use of simplifying approaches to understanding pathogen, in-host, ecosystems. Recently, Pedersen and Fenton (Reference Pedersen and Fenton2007) described a possible framework by which pathogens might be assigned to guilds. They suggest that guilds be defined by shared niche, which they further define by using three axes, the resource axis (food), the location axis (infection site(s)) and the immunological axis (i.e. which immune components are stimulated). In adding the third, immunological, axis the authors cross from a resource use grouping (Blondel's (Reference Blondel2003) description of a guild) and into a grouping concerned with the functional role the pathogen plays in the ecosystem (Blondel's functional group). This approach is more holistic and, as suggested earlier, a new categorisation term which includes both the functional group and guild concept might be needed here. In the absence of such a new grouping term, and for simplicity, we will refer hereafter to the term functional group and drop the term guild.
An additional consideration in using an immunological axis for defining pathogen groupings is that it could be argued that stimulation of the immune response is not a true function of the pathogen but rather a function of the environment (the host) acting against the pathogen. As such, some may argue that immune stimulation should not be used to define the pathogens themselves. However, as many pathogens are known to manipulate the host immune system to their advantage and as the specific immune response of the host would not exist without the presence of the pathogen, the two are so inextricably linked that we agree with Pedersen and Fenton (Reference Pedersen and Fenton2007) and believe that the host immune response may legitimately be used as a grouping factor.
The response of the host to the presence of particular pathogens could be considered in terms of Immunological Activity Groups (IAG). A Pathogen Functional Group (PFG) which is defined on the basis of IAG, would have two components. If a pathogen stimulates an inappropriate host immune response (i.e. a response which does not lead to disease control and/or clearance) then it may have a different IAG for ongoing disease compared to a controlled infection.
Application of a pathogen functional group concept could be an extremely useful tool in exploring the relationships between pathogens in concomitant infections, provided that a suitable IAG can be created. These IAGs are formed in same manner as functional groups and as such must be chosen with a clear question in mind. In this case, we wish to establish how the pathogens may interact through the host immune system. Therefore, our definitions of the groups should be driven by the potential forms of immune stimulation that pathogens invoke and the forms of immune response that the pathogens are subsequently controlled by.
Much is known about the position of individual immune components (at least those that are commonly recorded) in the various pathways of the immune response and, in turn, the inter-relationships of these pathways are also well understood. Therefore, if functional groups are defined on the basis of the IAG, then prediction of the relationships between these groups should also be possible. Defining pathogen functional groups should allow assessment of both the likelihood of specific pathogen interactions and the mechanisms by which those interactions may be mediated. Furthermore, models constructed using these groupings would allow the dynamics of the pathogen infections and the consequences of perturbations (e.g. treatment strategies) to those dynamics to be predicted.
At the finest scale, the intricacies of how pathogens interact with the host immune system are probably as diverse as the species themselves. However, at a median level of complexity many parasite species will share similar interaction mechanisms and it is at this level that functional groupings could be useful. The key to categorizing the functional groups is in defining the level of complexity at which the groupings need to be set.
CREATING THE PFG MODEL
We propose that there should be five key stages to the production of a clinically useful functional group model. First, a database should be constructed using the current immunological literature on laboratory-conducted, single-species infection experiments. The database should contain the recorded immune parameters for specific pathogen infections and, where known, whether or not these immune responses were associated with successful pathogen control (leading to cessation of infection) or with an on-going infection (acute or chronic). Secondly, this database would be used to form the IAG. Thirdly, the Pathogen Functional Groups (PFG) would be created. A PFG would be defined by two IAG scores, one for the pathogen's stimulatory effects on the immune system and one for the IAG by which the pathogen is successfully controlled. The fourth step in the process would be the model construction, with the links between groups based upon the known relationships between the IAG. The final step is validation and requires the model to be tested against real co-infection data.
Suitable data do exist, at least for humans and domestic animals, which would allow the construction of a database for the formation of the IAG. However, such a process is a very large undertaking and is beyond the scope of this review. Nevertheless, here we demonstrate the potential to undertake this process. We construct a small preliminary database using a limited number of data fields and organisms and use it to construct an example of an IAG. From our example IAG we then form preliminary pathogen functional groups (PFG). The number of PFG is simply the number of unique combinations of the two IAG scores. Although this will potentially lead to quite high numbers of PFG, the modelling of these groups remains comparatively simple as the IAG will always be fewer in number and it is the IAG relationships that ultimately describe the model.
It is important to stress that the database described hereafter is not to be considered as anything more than an example of how such a database may be formed and the uses to which it can be put. Further, the functional groups and example model produced from those groups are also given solely as examples of the proposed process and are not in any way intended to be definitive, nor are we proposing that the model described in this paper would be useful for clinical purposes as it stands. What we hope to achieve is to provide a framework by which researchers may continue to explore this topic.
Step 1: Database production
To produce an example pathogen/immunological database we preliminarily searched for the terms, ‘interleukin, T-helper, Th1, Th2 and Th0’ in the search engine Web of Science®. We then chose fourteen of the infectious organisms (from the first few pages of the search) which yielded frequent hits in this first search (2 fungal, 3 helminth, 3 protozoan, 3 bacterial and 3 viral pathogens). Next, we conducted a more detailed search on these organisms using the species or genus name (as appropriate) and a partial list of cytokines (i.e. IL-1, IL-2, IL-4, IL-5, IL-6, IL-10, IL-12, IL-13, IFN-γ and TNF-α). Cytokine profiles were scored as having either no or no recorded response (0), a down-regulation of that response (−1), or an up-regulation of the response (+1). Using only the cytokines described above obviously constrained the database and we emphasise that this was purely a constraint for the purposes of this example. We also recorded the pathogen taxon as either fungal, viral, bacterial, protozoan or helminth.
For a full database we would recommend that there be no a priori restrictions on which immune features were recorded. All aspects of immune response, including the cytokine profiles, information on TLR stimulation (Liew et al. Reference Liew, Xu, Brint and O'neill2005), cellular immune responses and genetic data could potentially be useful. An extended database could also include pathogen traits, such as infection site, the intra/extracellular nature of the organism, its taxonomic group, trophic level, virulence and relative growth rates. Additionally, traits of the host could be included where they may influence the immunological outcome, e.g. species, host age and genetic information such as mouse strain. If a damage component is to be included in the model it would also be useful to incorporate information as to the nature of the pathogenesis of the disease, i.e. whether it is directly pathogen mediated or caused via the actions of the immune response. If these additional data are associated with particular immune activity groupings with sufficient specificity, then these pathogen and host traits could be used to assign novel organisms to their specific IAG (and then their subsequent PFG) without the need for direct measurement of the indicator immune traits themselves.
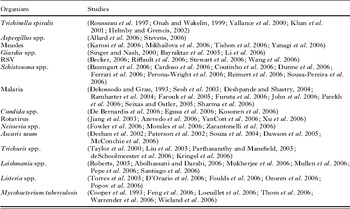
Within our example database we divided the immunological profiles into those which were associated with ongoing disease and those which were associated with disease control or cessation. Multiple studies from different authors (Table 5) were used to make up the profiles for each disease and where studies disagreed the majority finding was taken. For a full database we would suggest that where a disagreement is found in the literature both sets of information are recorded as separate entries in the database and a weighting column added, based on the number of papers describing each type of immune response. Again we should make clear that we did not conduct an exhaustive literature search for each organism in this example.
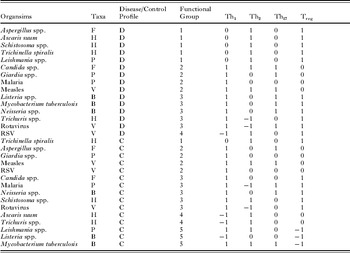
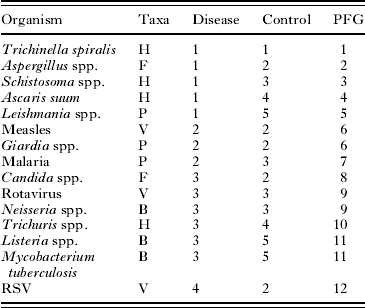
Due to the limited number of records and information in our database we conducted a further simplification with a grade given (on the basis of the cytokine profile) to indicate whether the disease was associated with up, down or no regulation of the Th1, Th2, Th17 and T regulatory cell responses (Table 1).
Pathogen database example showing pathogen species or genus, taxa (B=bacteria, F=fungi, H=helminth, P=protozoa, V=virus) of the pathogen, whether the immune profile is representative of ongoing disease (D – upper section) or of an infection which is being controlled (C – lower section), the proposed functional group membership (see also Table 2) and the score for T cell responses (no or no recorded response=0, up-regulated response=1, down-regulated response=−1) of each pathogen

Step 2: Defining the IAG
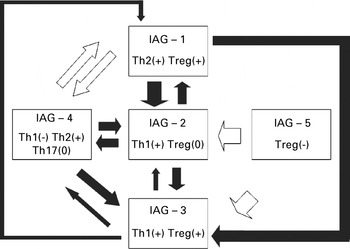
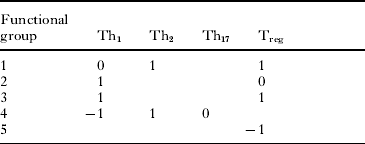
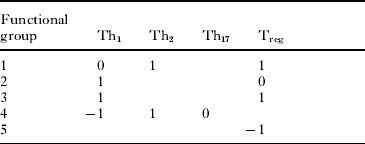
Once a database has been produced it may be used to define the immune activity groups. Our groupings were defined simply by establishing how many unique profiles could be found in the dataset. In this case we find five distinct profiles which are characterized in Table 2. Fig. 2 diagrammatically represents the proposed relationships between our defined immune activity groups.
Hypothesised relationship between the immune activity groups (IAG). Black arrows indicate down-regulatory processes and white arrows indicate up-regulatory processes. The thickness of the arrow equates to the proposed strength of the action of one group upon another. T regulatory mechanisms are assumed to have down-stimulatory effects on Th1 responses only.

Defining features of the proposed immunological activity groups, using the T cell profiles. Blank cells indicate that any response is allowable. No response=0, an up-regulated response=1 and a down-regulated response=−1
Step 3: Defining the PFG
Once the immune activity groups have been established the pathogen functional groups can also be created. This step is a simple process, with each pathogen being given two IAG scores as described above. For our pathogens 12 distinct PFG were defined (Table 3). This may appear to be a large number of groups to deal with but, as stated earlier, each group is still centred on only the five immune activity groups and their influences upon one another are relatively simple to define and model. Of further interest is the grouping of unrelated taxa in some of these PFG. Measles and Giardia spp. both show profiles in PFG 6, characterized by a Th1 response with no T-regulatory involvement. Rotavirus and Neisseria spp. have profiles in PFG 9, characterized by a Th1 response but moderated by a T regulatory cell response. Listeria spp. and Mycobacterium tuberculosis show profiles in PFG 11, which for their disease profile show the same immune profile as PFG 9 but for their control response are characterized by a down-regulation of the T regulatory cell response.
Pathogen functional group (PFG) allocation, revealing 12 distinct functional groups defined by their ongoing disease (Disease) and infection control (Control) immune activity group (IAG) profiles

Why do some PFG contain only one IAG?
In our defined PFG, the IAG for the disease profile is sometimes the same as for the control profile. There are three possible explanations for this. Firstly, organisms which show acute dynamics may stimulate an immune response that is effective at clearing the disease and their chief strategy for survival is to reproduce and transmit rapidly before the immune system has time to mount the effective response. Secondly, the pathogen may show acute but recurrent dynamics, wherein the immune response stimulated is effective against a certain life-stage of the pathogen, but the pathogen also has a life-stage within the host which is resistant, dormant or can sequester away from the immune components. Similarly, where there is no or only short immune memory, re-infection with the same species, can also result in these acute dynamics. The latter two possibilities are not taken into account in our simple examples, but could be incorporated in the full database, for development of the IAG and PFG and the subsequent model.
Step 4: Production of the functional group model
As we have shown, functional group models have proven useful in determining likely changes in an ecosystem given perturbations to that system and model manipulations can be used to assess the best solutions to ecosystem problems. Models are also useful because multiple model manipulations can be carried out without the need for expensive and sometimes impractical experimentation. Creation of a functional group model for pathogen ecosystems would allow similar system engineering to be undertaken and thus introduce a mechanism for more efficacious pathogen control and prediction of co-infection consequences.
The model should contain the descriptors of the PFG influences on the immune components (in our example the T cells) and also the effects of those immune components upon the pathogen. To assess the effects of the immune components on the pathogens we need to know whether the pathogen is in the disease or clearance phase, in other words is the immune response appropriate for controlling the pathogen. As stated earlier, pathogens may move between functional groups depending on stage of infection. For simplicity in this example we choose two pathogens for which their two IAG are the same and for which there is published evidence of the consequence of co-infection. We therefore consider the example of a co-infection with the protozoan Giardia lamblia and the helminth Trichinella spiralis. (von Allmen et al. Reference von Allmen, Christen, Forster, Gottstein, Welle and Muller2006), which the literature suggests should lead to an increase in the number of G. lamblia trophozoites if the infections are concurrent.
According to our example PFG classification, Trichinella spp. fall into PFG 1, with both IAG scoring 1. This IAG is chiefly characterized by the up-regulation of both Th2 and T regulatory cell responses. Giardia spp. are classified as PFG 6 in our proposed system, with both IAG scoring 2. Immune activity group 2 is characterized by an up-regulation of the Th1 response and no evidence of any T regulatory activity.
A functional group simulation model was formed in the statistical package, Mathematica (v6.0). The model consisted of a series of differential equations for describing the functional groups and their interactions with the components of the immune response. The functional group equations are defined below:


where Fi refers to the functional group number i; ai is the relative growth rate of the pathogen population in functional group i; bi is the relative death rate of the pathogen population in functional group i. Further there are three immune parameters modelled, the Th1 response, the Th2 response and the T regulatory cell response (Tr). We assume that over the time span of the model no immune decay occurs. The Th1 and Th2 responses are assumed to have equivalent down-regulatory effects upon one another. Additionally, the Tr response has a down-regulatory effect on the Th1 production which is ten-fold the level of the direct effects of Th1 and Th2 upon one another. The formulae for these immune responses are below:



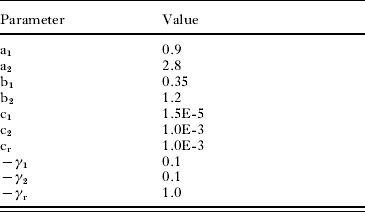
Where ci is the stimulation rate of the immune response for immune response i; -γj is the moderator of the down-regulatory effect of the immune response j upon immune component i.
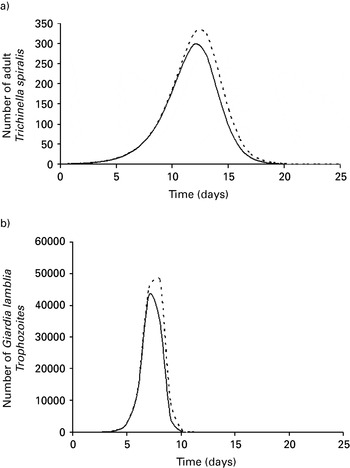
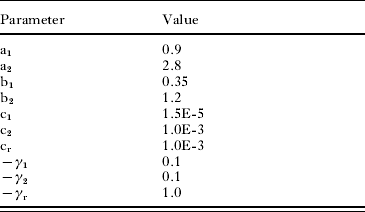
Detailed descriptions of pathogen growth and death rates are often absent from the literature. There is usually sufficient data to describe the organisms qualitatively. For example, we can establish from the literature that Trichinella spp. infections in mice have a comparatively lower growth rate (within the host) than Giardia spp. and that T. spiralis has approximately similar temporal dynamics (14–20 day infection) to the faster replicating G. lamblia, (Gbakima, Reference Gbakima1993; Gurish et al. Reference Gurish, Bryce, Tao, Kisselgof, Thornton, Miller, Friend and Oettgen2004). A complete list of the parameters used for the model is given in Table 4. Parameter values were chosen to give model outputs which, in the modelled single species infections, broadly represented the pathogen dynamics described in the literature (Gbakima, Reference Gbakima1993; Gurish et al. Reference Gurish, Bryce, Tao, Kisselgof, Thornton, Miller, Friend and Oettgen2004; von Allmen et al. Reference von Allmen, Christen, Forster, Gottstein, Welle and Muller2006). The growth rate of the T. spiralis infection (reproduction–death) was adjusted to give the approximately 350 adult worms at day 10 which was the peak of adult worm numbers in the study of Gurish et al. (Reference Gurish, Bryce, Tao, Kisselgof, Thornton, Miller, Friend and Oettgen2004) . The outputs of the single and two species models may be seen in Fig. 3. The model successfully predicts an increase in G. lamblia trophozoites in the presence of T. spiralis. It also suggests that the duration of infection (calculated as days that the pathogen count is above one) will increase. T. spiralis infection level is also predicted to increase, although no increased duration of infection is observed. However, the model only succeeds qualitatively. In the experimental system both the number of trophozoites and the duration of the infection are much more severely increased. Nevertheless, even a qualitative statement about the effects of co-infection could be useful in a clinical setting. We re-emphasise that this model is extremely simplistic and is only a demonstration of how such techniques might be usefully employed.
Example pathogen functional group (PFG) model simulations for the single and mixed infections of functional group 1 (Trichinella spiralis.) and functional group 6 (Giardia lamblia.). Panels (a) and (b) show the model dynamics for the infections with PFG 1 and PFG 6 respectively. Solid lines represent single species infections and dashed lines represent the pathogen dynamics in co-infection.

Parameter values for the model describing the interaction between pathogen functional groups 1 and 3
It should also be noted that in previous work with T. spiralis and G. lamblia, where the T. spiralis infection was given prior to the G. lamblia, there was a strong reduction in the number of G. lamblia trophozoites. Our current model does not allow for the complexity of time dependency in the immune response. During the development of a model for clinical use, any time dependency in the various IAG would need to be incorporated.
Despite its quantitative shortcomings, even this simple model, based on example functional groups and derived from a very limited dataset, proves to be a useful qualitative tool in predicting the outcome of co-infection. Therefore, there should be little doubt that a more detailed model, based around functional groups, which are derived from a comprehensive dataset, could prove equally useful in a clinical setting.
Objective methods for defining the IAG
Of course, the form of grouping we have used for our example data is very subjective and ideally, especially for larger datasets, some automated, objective mechanism of grouping would be used. Although, the formulation of such a mechanism is again beyond the scope of this preliminary study, such tools do exist. One option is the use of neural networks. In particular, self-organising maps (SOM) have been successfully used to classify organisms based upon a set of traits (Park et al. Reference Park, Chon, Kwak and Lek2004; Weller, Harris and Ware, Reference Weller, Harris and Ware2006). These networks may be unsupervised, where no preliminary classification is known, and the SOM seeks to group data without this prior knowledge, or they may be supervised, where a classification is already known and the model then fits new data to the established criteria. The unsupervised SOM could be useful for initial immune activity group classification and the supervised SOM could then be used to fit novel organisms to this classification system.
Weller et al. (Reference Weller, Harris and Ware2006) successfully used unsupervised SOM to classify dinoflagellate cysts based on image data. Similarly, Park et al. (Reference Park, Chon, Kwak and Lek2004) used SOM in conjunction with a second method called adaptive resonance theory (ART) to successfully predict benthic macro-invertebrate group membership under differing water quality conditions. Further, adapted SOM can be used on categorical data (Hsu, Reference Hsu2006), which is the most likely form of data available for a pathogen/immunological database.
Step 5: Model validations
Once a suitable dataset has been collected, the functional groups defined and the model produced there must be a phase of validation before the model could be safely utilised in a clinical setting. At the heart of the modelling approach is the assumption that the functional groups and their predicted linkages are correct. Tests of this hypothesis could take several forms. Firstly, the limited literature describing the consequences of particular co-infections could be used as in the described example above. The pathogens in these studies could be assigned to their relevant functional groups and the predicted outcome of the model could then be checked against the experimental data in the relevant journal articles. Additionally, the model could be used to predict the outcomes of particular clinical co-infections (including the consequence of specific treatments) and these could be compared with the outcomes for those patients. Finally, where specific gaps in knowledge occur, e.g. where there is no literature or clinical data against which to test particular functional group combinations, laboratory experiments could be conducted. At each stage of model validation, the functional groups and, particularly, the linkages between the groups could be refined if errors were found.
List of studies used to define the immunological (cytokine) responses for each organism in the example database

CONCLUDING REMARKS
Once refined, the final model could be used to assess the optimal control strategies for any given network of co-infecting organisms. Perturbations of individual and multiple functional groups could be undertaken to mimic different vaccine and chemotherapeutic treatments and the effects upon all groups and upon the host (presuming a damage component is included in the model) could then be assessed.
The significance of the proposed simplification mechanism would be in offering the first step towards a generic and practical methodology for assessing control strategies in multi-pathogen infections. No such decision-support tool presently exists. While it is likely that a final model for clinical use would take several years to develop, at each step along its production path the process itself would undoubtedly increase knowledge and understanding in the rapidly growing field of co-infection biology.
ACKNOWLEDGEMENTS
The authors would like to thank the BSP co-infection symposium organising committee for their invitation to present this new idea at the symposium and for the opportunity to put this document forward for publication in Parasitology. We would also like to thank the reviewers for their helpful comments on the earlier draft of the document.