

Introduction
In 1887, Henry Helm Clayton, a young forecaster at the even younger Blue Hill Meteorological Observatory near Boston, Massachusetts, issued a “Plea for Civilian Control of the Weather Bureau.” The “Weather Bureau” was the weather observing and forecasting arm of the U.S. Signal Service, and it was the first national service that issued free daily short-term weather forecasts (Fleming Reference Fleming2000, 318; Clayton Reference Clayton1887b, 114).Footnote 1 In that plea, Clayton posited an “experiment” that was actually a thinly-veiled challenge to the Signal Service's claim that its forecasts were successful 77 percent of the time. First, he had the steward at Blue Hill, Frank Brown, make weather predictions using the instruments at the observatory, which achieved “from three to ten per cent higher success than the signal service.” He then made another comparison:
In order not to confine the test to one person alone, I asked Mr. and Mrs. Davenport, intelligent persons living near Blue Hill, but who claimed to know nothing about the science of meteorology, to make weather-predictions during the month of June. These predictions were made at sunset for the twenty-four hours beginning at midnight, and were based on the appearance of the sky alone without any instruments. These predictions were received and recorded when made, and the end of the month showed that the predictions of each, though slightly different, were eighty per cent verified, while the signal-service predictions during the same time were only seventy-seven per cent verified. (Clayton Reference Clayton1887b, 114)
Clayton's article was the opening salvo of a campaign to get the national weather service transferred to civilian control, and his “experiment” displayed many of the epistemological concerns of that campaign. Clayton used Brown and the Davenports, for instance, to ascertain the value of meteorological knowledge in weather forecasting. These were people with no knowledge of meteorology, and yet they did better than the Signal Service forecasters. The Davenports did not even have access to the instruments at Blue Hill. The only procedure the Davenports used was a glance at the sky. And yet, even they did slightly better than the Signal Service, despite the Signal Service's access to a network of observing stations across the United States. Clearly, according to Clayton, the Signal Service's forecasting methods were not worth the taxpayers’ money.
What was the root of the problem? Clayton was not arguing that laypeople should be in charge of weather forecasting. Certainly, there were laypeople who did claim a better success rate than the Signal Service, but Clayton, who had recently helped set up the Tennessee State Weather Service and had just apprenticed with academic meteorologists, or scholars who got as close as anyone to academic meteorology in late-nineteenth-century United States, was trying to show the opposite: Signal Service forecasters needed more knowledge of meteorology, and its weather service arm needed to be run by scientists, not military men.Footnote 2 Additionally, that knowledge of meteorology, and knowledge of the weather when a forecast was being made, had to include knowledge of local weather, which forecasters at the Signal Service did not have. Based in Washington, DC, these forecasters issued forecasts for forty-one states (Willis and Hooke Reference Willis and Hooke2006, 318).
The work of the Blue Hill Observatory in the 1880s was a platform to define the value of different kinds of knowledge in forecasting. The observatory began experimental forecasts in the middle of 1886 to determine whether its combination of synoptic maps from the Signal Service and local observations provided a basis for 24-hour forecasts for southern New England weather that could outperform those issued by the Signal Service (Rotch Reference Rotch1887c). A comparison of their forecast “verifications” with those of the Signal Service showed that theirs were better, and in 1887 they began selling their forecasts to the Associated Press for twenty-five dollars a month. As Clayton's challenge showed, however, the forecasts were more than a way of earning money. The forecast verifications were evidence that Blue Hill's approach – local forecasts at an institution devoted not to military signaling, but to the study of meteorology – was a better model for weather forecasting.Footnote 3
Blue Hill's challenge became part of a larger campaign to get the national weather service transferred out of the military. In using their forecasts for political ends, though, they opened themselves up to charges that their modes of verifying their forecasts, and by extension their claims about the value of their forecasts, were unsound. In fact, it opened up another question, which has persisted into the twenty-first century, according to Gary Fine: “What does it mean to be ‘right’?” (Fine Reference Fine2007, 173).Footnote 4 All of this circled back to the evolving relationships between meteorological knowledge, local knowledge, and the networks of knowledge generation, sharing, and maintenance that Paul Edwards has called knowledge infrastructures (Edwards Reference Edwards2010, 17).
Knowledge infrastructures were an important part of meteorology in the nineteenth and twentieth centuries. As James Fleming, Vladimir Janković, and Deborah Coen have observed in their introduction to Intimate Universality, meteorology “lays claim to universality first in its infrastructure,” and Roger Turner has classified meteorology as an “infrastructural science” whose primary justification is not in making discoveries – though this is certainly possible and important – but the day-to-day monitoring of the atmosphere that is crucial to management and governance (Fleming, Janković, and Coen Reference Fleming, Janković and Coen2006, x; Turner Reference Turner2010). Meteorology in the nineteenth century underwent substantial changes of timing and scale. This was in large part because of the telegraph, which “allowed weather data to travel faster than the winds themselves” (Anderson Reference Anderson2005, 1). Storm warnings could be telegraphed to areas before the storms arrived, but even more importantly, a forecaster could receive data from multiple stations at once, plot the data on a map, and, by connecting stations with similar measurements (of pressure, temperature, etc.), create a “snapshot of surface weather” whose patterns could indicate storms, cold waves, and other hazards (Monmonier Reference Monmonier1999, xi). The resulting “synoptic map” was a powerful means of seeing the weather over a large area – in the U.S. case, over the continental United States – at a glance.
Historians have (astutely) tied the evolution of meteorology to knowledge infrastructures. As Fleming, Janković, and Coen have observed, the narrative of meteorology has often been written as a “transition from local to global” (Fleming, Janković, and Coen Reference Fleming, Janković and Coen2006, x).Footnote 5 And even when the narrative is written in the other direction – “scaling down” – the impetus for the move is often a political change that underlay the loss of that infrastructure.Footnote 6
The “scaling up” narrative has invited broader claims about the role of meteorology in modernization. Jeremy Vetter, for instance, has characterized the hierarchical observation network of the U.S. Weather Bureau (the name of the weather service once it was transferred to the Department of Agriculture in 1891) as an example of “high modernism.” Vetter argues that the hierarchical structure of the national weather service's network “constituted a strengthened, rigorously bureaucratic form of top-down control over knowledge production that, despite its evident decentralization, aggregated observations from the field through strict standardization and rigid discipline" (Vetter Reference Vetter2011, 264).Footnote 7 Vetter's characterization explicitly invokes the work of James Scott, particularly Scott's argument that governments’ techniques to make their populations “legible” have also engendered the kinds of high-modernist planning that have, in many cases, failed to achieve the goals of those governments. Scott opposes to this technical knowledge “metis” knowledge that can only be acquired by local practice (Scott Reference Scott1998, 316–319). To this we might add the “weather wisdom” discussed by Katharine Anderson – “subtle, unmeasured indications from the sky, animal behavior, the built environment, even one's own body” and Jamie Pietruska's “goosebone prophets” who claimed to be able to forecast the weather using the behaviors of animals (Anderson Reference Anderson2005, esp. 274–279; Pietruska Reference Pietruska2011, 83).
The case of Blue Hill complicates this tension between local, lay, and statist techniques of observation. The first tension is between local knowledge and lay knowledge. Blue Hill's “local knowledge” was not the same thing as the kinds of lay knowledge discussed above. It was certainly particular to a place, and, in the words of Anderson, it “did not travel well” (Anderson Reference Anderson2005, 179). Signs that might help a forecaster in a dry region didn't work in the very wet and stormy region of New England. Forecasts that were easy in some areas were harder in New England, as Clayton would observe in his critiques of forecast verification. And yet, Blue Hill's forecasters sought to integrate local knowledge with techniques of observation and visualization that were used more generally. The second tension, between local and statist ways of “reading” the weather, demands a rereading of the infrastructure in which knowledge was being made. Blue Hill made ample use of the communications network and techniques of visualization that the Signal Service provided, yet it resisted the putatively “modernist” hierarchy of the Signal Service. Rather, it exhibited what Paul Edwards has termed “mutual orientation,” an interaction between “micro-scale” users of that infrastructure – in this case, Blue Hill – and “meso-scale” institutions, like the Signal Service and even larger academic institutions, particularly Harvard University, which sponsored some of the actors in this narrative.Footnote 8 As Edwards showed in the case of the Internet, this article shows in the case of meteorology that “subjection and domination are only part of the story” (Edwards Reference Edwards, Misa, Brey and Feenberg2003, esp. 222). To push the metaphor (perhaps) to the point of anachronism, forecasters at Blue Hill “hacked” into the larger network of the Signal Service by using a combination of analytical techniques that combined local observations with synoptic maps, the issuance of its own forecasts as an example for other local weather services to follow, and a political campaign to demilitarize the national weather service.Footnote 9 In doing so, they found a place for local knowledge that was different from the lay knowledge with which the national weather service was competing. Also in doing so, they called into question the terms of expertise the national weather service had set.Footnote 10
Dissonance in a “Bureaucratic Orchestra”: The Powers and Limitations of the Signal Service's Knowledge Infrastructure
The 1870s and 1880s was a period of staggering growth for the national weather service's infrastructure. From 1870 to 1874, “[Chief Signal Officer Albert] Myer's command expanded from three enlisted men to over five-hundred college-educated observers” (Fleming Reference Fleming2000, 319). By 1880, 138 of its observers were transmitting observations three times a day, and its budget had grown from $15,000 a year in 1870 to nearly $1 million in 1880 (Craft Reference Craft1999, 1069). European scientists looked enviously at the scale of the American weather service and its achievements in standardizing its observations (Fleming Reference Fleming2000, 327; Anderson Reference Anderson2005, 249). The national weather service's network was dedicated to the service of weather forecasting, primarily storm warnings, but its network of observers offered powerful means of visualizing the weather on a national scale.
Forecasting at the national weather service depended heavily on the telegraph and the synoptic maps that were plotted from observations telegraphed to headquarters in Washington. Indeed, a telegraph network was the main amenity Chief Signal Officer Albert Myer could offer Congress in 1869 when it was considering a bill to establish the first national weather service. Myer had founded the U.S. Army Signal Corps during the Civil War to provide intelligence on Confederate movements, but without a clear justification for the existence of the Corps's successor, the Signal Service, Myer faced repeated budget cuts from Congress (Fleming Reference Fleming2000, 317–318). Myer saw an opportunity in the weather service bill, and though the original candidate for the service was the Smithsonian Institution, which had coordinated the nation's largest network of weather observers before the Civil War, Myer convinced the sponsor of the bill, Milwaukee representative Halbert Paine, to house the storm warning network with the Signal Corps. Myer argued that the telegraph could provide advance warning of approaching storms, “as it would, in time of war, those of an enemy” (quoted in ibid., 319).
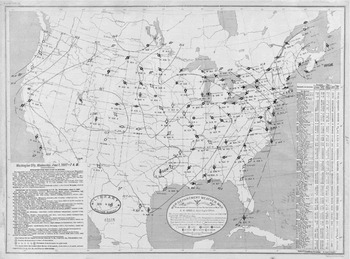
The telegraph network provided a powerful means of “seeing” the weather across the country. Upon receiving a flurry of simultaneous reports over Signal Service and private telegraph wires, clerks in the “Telegraph Room” of the Signal Service decoded the reports and manually entered the data onto weather maps (see fig. 1), after which point forecasts, called “probabilities” and later “indications,” were transmitted to “newspaper offices, boards of trade and commodity exchanges, the halls of Congress, scientific institutions both at home and abroad and back to Bureau substations, each of which relayed the forecast by telegraph to towns and villages within fifty to one hundred miles” (Fleming Reference Fleming2000, 320; Willis and Hooke Reference Willis and Hooke2006, 317; Pietruska Reference Pietruska2011, 85).Footnote 11
Weather map of the United States for 7 a.m., June 1, 1887. The map displays isobars connecting stations with readings of similar pressure. For each station, wind velocity, cloudiness, and precipitation are indicated by symbols. Centers of low- and high- pressure systems are also labeled. NOAA Central Library Data Imaging Project.

Powerful and far-reaching as this new network was, though, developing it into a knowledge infrastructure depended on a variety of social and political innovations developed both from the military tradition of the service and from the practices in earlier weather services. The discipline of military observers was originally thought to be an asset to what Jamie Pietruska has called a “bureaucratic orchestration of simultaneous and standardized weather observations” (Pietruska Reference Pietruska2011, 80). Indeed, Representative Halbert Paine, the original sponsor of the bill to create the weather service, believed that “weather observations would be conducted with ‘greatest promptness, regularity, and accuracy’ by military, rather than civilian, observers” (Pietruska Reference Pietruska2009, 101–102). At the same time, many of the observing procedures were designed by Cleveland Abbe, Myer's chief civilian scientist (Fleming Reference Fleming2000, 327). Abbe, an astronomer by training, had tried to develop a regional observation network and weather forecasting service based at the Cincinnati Observatory (Craft Reference Craft1999, 1067). In starting at the Signal Service, he used a number of the same forms he had designed while attempting to start that service (Willis and Hooke Reference Willis and Hooke2006, 317). Observers were given strict instructions for the recording and transmission of observations to the central office. For instance, observers were given orders that “the observations for telegraphic transmission will be taken daily at ___ a.m., ___ p.m. and ___ p.m., (local time,) and after the proper corrections are made, will be entered on Form 5, supplied by this office” (Chief Signal Officer 1874, 321).
Once the observations were telegraphed to the central office in Washington, DC, the synoptic map was drawn by plotting simultaneous observations around the nation and then drawing “isolines” to connect stations with the same or similar readings – generally temperature and pressure. Using a table of barometer readings, for instance, the clerk would plot the barometer readings for each station on a base map of the United States. Stations with readings between, say, 29.45 and 29.55 inches would be connected, then readings between 29.55 and 29.65 were connected, until the highest barometer was reached. Abbe marveled that these maps “reveal[ed] to a single glance of the eye a synoptic view, at once, of the meteoric conditions at the different stations, and of the deductions thence to be made as to the conditions of the atmosphere then extending over the continent” (Chief Signal Officer 1871, 85).
The creation of maps was just as standardized as the taking of observations. Each chart had a specific designation: “Chart 1, weather; Chart 2, barometric changes; Chart 3, barometric departures and abnormal variations.” Color pencils were assigned different purposes; blue pencils, for instance, were used to make corrections on charts (Chief Signal Officer 1885, 42). The preparation of charts was divided among several clerks and three separate shifts (8 a.m. to 11:30 a.m., 3:30 p.m. until relieved, 11:30 p.m. until relieved) (ibid., 46). A clear hierarchy divided the drawing and analysis of the maps. “Probabilities,” later called “indications,” were only to be issued by an “indications board” in the central office. The board, composed of high-ranking military officers and civilian scientists, rotated its duties, so that each member would make indications for only one month (Weber Reference Weber1922, 4). Observers in the field were forbidden from making forecasts for their regions, and even the central forecasts were heavily standardized. Abbe insisted that “the first or opening sentence of the Probabilities must always employ a verb, and this verb must be in one of the future tenses, or must distinctly refer to the future.” Creation of new expressions was strictly forbidden (Chief Signal Officer 1874, 379).
The map, according to Abbe, was a powerful tool for forecasting. Because of the translucency of the paper the maps were printed on, the user could trace the line of the previous map, as well, and then note the difference of location of the area of lowest pressure. In this way, the forecaster could compare the “successive phases of the weather” (Chief Signal Officer 1871, 85–86). If multiple reports were considered at the same time, he wrote, one could trace on the map “the progress of storms, or the change of meteoric condition (as the movement of an area, of high or low barometer) from report to report, and thus by considering the past, and by applying laws and generalizations reasonably well established, to estimate more easily the ‘probability’ of the future” (ibid., 85).
Indications officers were given extensive training in the use of maps in the creation of forecasts. Indeed, William Koelsch has argued that the training these officers received in meteorology might be considered “America's first postgraduate program in meteorology” (Koelsch Reference Koelsch and Fleming1996, 512). They first took a “theoretical” course at Fort Whipple that not only covered all the knowledge a Signal Officer needed to operate the Army's communications technology, but they also took courses on meteorology. Required reading in those courses were the new Treatise on Meteorology by Elias Loomis, a professor of astronomy at Yale and one of the original discipline builders of American meteorology, and the Handbook of Meteorology by Alexander Buchan, the Secretary of the Scottish Meteorological Society.Footnote 12 Although the historical record does not provide an indication of how these texts were used, Loomis's Treatise on Meteorology provided useful descriptions of the way storms appeared on synoptic maps. Storms were characterized by a “decrease in pressure toward the center of a revolving mass” and generally oval isobars. In the United States, Loomis wrote, they also tended to move eastward (Loomis Reference Loomis1894, 138; Chief Signal Officer 1881, 78). Forecasters could use these and other descriptions to identify storms and track their movements.
Indications officers went through additional training after that course. They studied at least thirteen more books on weather, after which time they would undergo individual study of the daily weather maps in the Office of the Chief Signal Officer. They had to note the general movements of storms and changes in pressure and humidity, and then practice drawing isobars and isotherms. Once they had “sufficient skill” in drawing the lines, they would begin preparing synopses and indications. However, for a period of one month, they could only issue forecasts for eight hours ahead. After that, officers started issuing 24-hour forecasts, and when the officers were deemed “proficient in forecasting,” they would be examined on Loomis, Buchan, and other texts relating to meteorology, and then pronounced qualified for duty in the “Indication Room” (ibid., 90).
Intensive as this training might have been, however, Abbe was unsatisfied with the theoretical basis of forecasting, and the educational opportunities available to meteorologists. As late as 1901, he lamented that short-term daily forecasts provided by weather services across the world “merely represent[ed] the direct teachings of experience.” He continued, “they are generalizations based upon observations but into which physical theories have as yet entered in only a superficial manner, if at all.” Those predictions related to details for “regions that have been charted and studied for years” (Abbe Reference Abbe1901, 551). In other words, knowledge of meteorology was still “local knowledge,” unlike the knowledge of astronomers, chemists, or physicists, which were based on laws and, in the case of those studying electricity, “far more complex theories than are as yet at the command of the meteorologists” (ibid.).Footnote 13 The paucity of meteorological work at the university level was to blame, said Abbe in an open letter to the American Meteorological Journal. Progress in inventions using electricity were only possible, argued Abbe, because “the physical laboratories of the world have turned our attention so largely to the purely scientific investigation of electrical laws.” Abbe then generalized to all applied science that “we must first know the laws of nature before we can apply them to human needs” (Abbe Reference Abbe1893, 560). Without university departments of meteorology, endowed by some as yet unknown benefactor, weather forecasting would never become the sophisticated art that the electricians had achieved.
Abbe was a staunch advocate for the “purely scientific investigation” of meteorology in the Signal Service, as well. Myer had eschewed research entirely and focused on the forecasting service, but when General Hazen succeeded Myer as Chief Signal Officer in 1880, Abbe was able to convince him to establish a “Study Room” for theoretical research in meteorology. The room included such scientists as William Ferrel, who had studied the effects of the earth's rotation on the atmosphere, and T.C. Mendenhall, known for his study of atmospheric electricity (Willis and Hooke Reference Willis and Hooke2006, 319). Even with these amenities, though, scientists found the Signal Service an odd place:
The most industrious and enthusiastic investigator would be somewhat dismayed by the receipt of ‘instructions’—not much unlike the following: ‘You will begin on Monday next an investigation of the cause or causes of the attraction of gravitation, and make a preliminary report upon your work in two weeks. A final report is to be ready by the first of next month.’ Unfortunately, Nature does not yield her secrets in response to orders, and there were naturally many failures to ‘get results’ on time. (Quoted in Humphreys Reference Humphreys1919, 481)
The mismatch between research and military organization went beyond the frustrations of the Study Room scientists. The 1880s was a period in which the organization, and finances, of government science, and the justifications for their activities, came under intense scrutiny in the executive and legislative branches.Footnote 14 The War Department, for instance, made numerous attempts to shed the weather service; according to A. Hunter Dupree, “the Army wanted science no more than science wanted the Army,” especially given the substantial cost of maintaining that service (Dupree Reference Dupree1986, 191). Congress, for its part, established a commission, headed by William Allison, to investigate the organization of government science, including the national weather service, and its members asked a number of questions about the value of abstract research in making weather forecasts (ibid., 190–191). The weather service remained with the military until formally transferred to the Department of Agriculture in 1891 (the commission was deadlocked on whether it should be transferred), but the Study Room was abolished by the Secretary of War in 1886 after General Hazen fell ill (ibid., 192).
The difficulty in doing scientific work was not the only point of criticism of the Signal Service. Rural users, and, we will see, many scientists, believed the Signal Service was too centralized. The telegraph network was wide, but it did not penetrate very far into the countryside. As Jamie Pietruska has observed, the weather service was set up mainly for issuing storm warnings, and even with its issuance of farmers’ bulletins and frost and storm warnings, the national weather service was experiencing a steady increase in demand for increased rural services (Pietruska Reference Pietruska2011, 86). By 1880, under its new chief, General Hazen, Abbe and an indications officer developed plans for supplementary state weather services, but even as they were implementing these plans, agricultural organizations such as the Grange continued to clamor for even better access to the forecasts coming from Washington (Whitnah Reference Whitnah1961, 33; Pietruska Reference Pietruska2011, 85). General Hazen's successor, A.W. Greely, continued to encourage the development of state and local weather services. Indeed, when Blue Hill discontinued its forecasts in 1888 in a bid to get the Associated Press to pay more for their forecasts, Greely documented his disappointment at this news in his annual report, because they were doing the necessary “local predictions” that the Signal Service was unable to do (Chief Signal Officer 1889, 9).
The Signal Service's difficulties with Congress and the War Department were exacerbated by a series of scandals during that period, including an embezzlement of $90,000 that prompted Congress to cut appropriations to the Signal Service by the amount found to be embezzled and to close 18 stations (Whitnah Reference Whitnah1961, 46–47; Craft Reference Craft1998, 1059). More serious for the national weather service, though, were the ever-mounting challenges to its credibility. Although there had been complaints about the Signal Service's forecasts since its inception in 1870, the 1880s saw what Donald Whitnah has called a “crescendo of dissatisfaction” with its forecasts (Whitnah Reference Whitnah1961, 43). One of the most famous failures of the weather service was the Sunday, March 11, 1888 forecast of “fair weather” that was followed on Monday by what is still recognized as the worst blizzard in the nation's history (Pietruska Reference Pietruska2011, 82). That failure to forecast was compounded by the success of Horace Johnson, one of the many “weather prophets” that threatened the credibility of the Signal Service, who had not only forecast it successfully, but had done so months in advance (ibid.). As Pietruska has argued, traditional methods of long-range weather forecasting posed “a substantial epistemological threat to professionalising government meteorological science” (ibid., 80).
The Signal Service did not just face anecdotal evidence the decline in its forecast accuracy. From 1883 to 1887, the Signal Service's “verifications,” i.e., the percentages of forecasts that were later found to be “correct,” showed a decline. But once again, as Fine has asked about current forecast verification, what did it mean to be “right”? (Fine Reference Fine2007, 173). Measurements are taken at discrete points and then generalized for an entire area. How do we know that the weather at one point is similar to another (ibid., 208)? Additionally, verification is still done on the basis of political units. If a tornado is forecast for a county, and it touches down right across the border in another county but never crosses that border, the forecast is considered an organizational failure, despite how close it was (ibid., 191).
The judgment required in, and potential gaming of, forecast verification is apparent from the Signal Service's instructions to the officer in charge of verification. A forecast of “rain” for a state was verified if .01 inches of rain or more fell in 60 to 80 percent of the state. But to determine this percentage, the officer would outline the area of rain in green and use, as a guide, the assumption that “rainfall at a station will, in general, imply that rain has fallen over half the area between this and adjacent stations.” If the Boston Signal Office reported rain, for instance, and the Albany Signal Office reported fair weather, the green line would pass exactly between them. “If, on the one hand, the amount of rainfall reported is only a ‘trace,’ or a few hundredths of an inch,” the officer would pass the line far closer to Albany (“Verifications at the Signal Office” 1889, 28).Footnote 15 But how much closer? The fact that these two “adjacent” stations were 170 miles from one another points to the difficulties in using verifications to determine the value of a forecast, particularly for the area through which that green line was being drawn.
Geographic ambiguity was only one of many ambiguities in forecast verification. Another question was how much the verification reflected the value of the forecaster's work. For instance, it had been known since the early 1800s that one had a good chance of success if one predicted that the weather would stay the same, and the climatologist and meteorologist Wladimir Köppen had calculated in 1872 that a forecaster who predicted a persistence of current conditions would have a 67 percent rate of success (Sheynin Reference Sheynin1984, 77–80). If a forecaster simply forecast “persistence” all the time and got a higher verification rate than one who issued forecasts using their knowledge of past and present weather, was the latter more or less valuable?
This ambiguity created a great deal of space for using verification to justify one's own forecasts. The most notorious instance of this was what has become known as the “Finley Affair.”Footnote 16 In the July 1884 issue of the American Meteorological Journal, Sergeant John P. Finley, a member of the Study Room at the Signal Service in Washington, DC, reported on the verifications of the first three months of experimental tornado forecasts. Each day, Finley would forecast “conditions favorable for tornadoes,” or “conditions unfavorable.” After three months, he verified the forecasts according to a simple scheme: If the forecast and the eventual result coincided – for instance, if a forecast of “conditions favorable for tornadoes” was followed by an actual tornado – the forecast was verified. If they did not coincide, the forecast was not verified. Finley reported a staggering 96 percent success rate in tornado forecasting (Galway Reference Galway1985, 1390–1391). Skeptics, however, began to question this, especially since forecasting for normal phenomena were only 80 to 90 percent, at best. One skeptic was a geologist from the U.S. Geological Survey, Grove Karl Gilbert. Gilbert found that, out of Finley's 2,803 forecast periods, 2,680 of those “successes” – the overwhelming majority – were negative tornado forecasts for conditions unfavorable for tornadoes in the first place. These were not difficult forecasts to do, and in fact, Gilbert found that, if Finley had only issued “unfavorable” forecasts, his verification rate would have been greater (Gilbert Reference Gilbert1884, 161). Gilbert argued that a good verification system should have measured how many coincidences between forecast and occurrence were the product of Finley's “skill in inference.” To Gilbert, this was actually a variant on value. In a footnote, Gilbert noted that a letter to Science on the same subject claimed that “the value of the expert work must be measured by the excess which is obtained over the man who knows nothing of the subject” (ibid.). Verification, to Gilbert and the anonymous letter writer in Science, was a means of justifying the use of experts in forecasting.
However ambiguous the verification methods themselves could be, the interpretations of those verifications was even more open. The decline in verification from 1883 to 1887 might have seemed upsetting, but to Adolphus Greely, the successor to General Hazen as Chief Signal Officer, the decline actually highlighted the importance of experience in forecasting: In the past three or four years, Greely reflected, Congress had forced the Chief Signal Officer to lay off a number of veteran forecasters. A number of the replacements, wrote Greely, “have necessarily been assigned to [an] indications work[er] who never before [had] performed duty of this character” (Chief Signal Officer 1888, 14). Greely invoked additional failures the next year to defend the weather service against transfer to a civilian agency. In a statement to the U.S. Senate, Greely said that such a move “would have a damaging effect. The civilian prognosticators would have full sway.” His evidence for this came from an “experiment” in which he gave two civilians a chance to do predictions. One was Cleveland Abbe, the chief scientist, and the other was Henry Allen Hazen, a member of the study room and a former assistant to Loomis at Yale. According to Greely, “the result of this experiment is known. The blizzard [of March 11, 1888] was not predicted by Prof. Abbe, and during this month the work of Prof. Hazen has been the subject of ridicule in the newspapers” (Baltimore Sun 1888). In Greely's “experiment,” like Rotch's and Clayton's “experiments,” forecast verification became a means of defending or attacking an institution.
With the “weaponization” of forecast verification came a war of interpretation of those forecasts, much of which revolved around the question of what, exactly, was being measured in a verification, and what knowledge and experience a forecaster actually needed. Greely asserted that experience was paramount in forecasting. “Every one must admit that it requires long training to develop a weather indicator,” said Greely to the Senate. Even more importantly, the skill of a weather forecaster had to be acquired through experience. It wasn't possible, said Greely, for experienced forecasters to “communicate the methods of their work to inexperienced officers.” Greely submitted, instead, that, although “the basis on which rests their judgment is known to all scientific men . . . their skill of correct judgment is in no manner communicable to others” (Chief Signal Officer 1888, 14). Greely contended that this need for experience was reason enough to stop threatening to transfer the weather service: “It is no more than proper that the man who spends the best portion of his life fitting himself for such duties should feel reasonably secure in his position" (Baltimore Sun 1888).
Hazen, for his part, assailed Greely's contention that experience was necessary. Hazen, a distant cousin of General Hazen, was hired by the general in 1881 on Abbe's recommendation as one of three junior officer “computers” who were believed to be “men of decided scientific ability” who had the mathematical training to assist Abbe in meteorological work (Chief Signal Officer 1881, 61; Sandlin Reference Sandlin2013, 168). Hazen had been an assistant to Loomis before joining the Study Room, and he proved prolific in his work at the Signal Service, particularly with regard to his work on meteorological instruments and upper-air observations. Hazen had developed a reputation as the “in-house skeptic” who reveled in taking the contrary viewpoint (Sandlin Reference Sandlin2013, 169). In a letter to Mark Harrington, editor of the American Meteorological Journal, Hazen ridiculed Greely's argument that “a new man cannot make predictions.” Referring to the training regimen he had to go through, Hazen continued, “I was ordered to study ‘indications’ on Sept. 7th and on Oct. 1 began predictions, or just 23 days later . . . the truth is their officers know not one whit more about the weather than Prof. Abbe or I do. They have made no advance in the last 17 years & are not likely to do so” (Hazen Reference Hazen1888c). Implicit in Hazen's comments was the idea that the difference between forecasters was not the amount of experience they had, but in how much they knew about the weather. At the same time that Hazen was disputing Greely's interpretations of the Signal Service's verifications, he was disputing Blue Hill's interpretations of its own forecast verifications. Debates over forecast verification would depend greatly on what kind of knowledge about the weather was deemed important and what infrastructure was deemed necessary for forecasting.
High Altitudes, Independent Attitudes: Blue Hill, the Professionalization of Meteorology, and Political Activism in the New England Academic Community
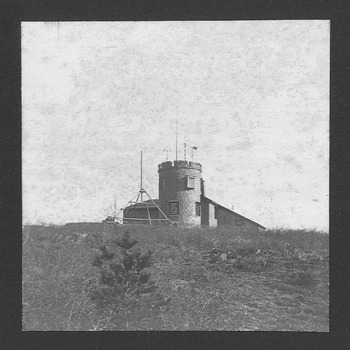
The reach and breadth of the Signal Service's network was impossible to dismiss, but a handful of academic enclaves sought to challenge the Signal Service's military model of weather forecasting and observation. While the national weather service was the product of a perceived need for storm warnings and the need for a peacetime role for the Signal Service, the Blue Hill Observatory was the product of a perceived need to professionalize meteorology in New England and also a recent college graduate's need for a career. Blue Hill's founder, Abbott Lawrence Rotch graduated from the Massachusetts Institute of Technology in 1884, and while his degree was in civil engineering, he had a longstanding passion for meteorology. Upon his father's death in 1882, Rotch acquired a sizable inheritance, and he used that to purchase a plot of land atop Great Blue Hill in Milton, Massachusetts (see fig. 2) – purported, by Rotch, to be the highest point within ten miles of the Atlantic CoastFootnote 17 – and construct and maintain a meteorological observatory (Conover Reference Conover1990, 1–2, 6).
Early photograph of Blue Hill Observatory, from Clayton's collection of photographs. Harvard University Archives, UAV 221.269p.

In addition to his family money, Rotch had the support of a new, Boston-based semiprofessional association, the New England Meteorological Society. Founded in 1884, the Society was intended as an organization bringing together professionals whose work related, in some way, to the study of weather, and amateur weather observers. William Koelsch has argued that the society was an example of disciplinary entrepreneurship. A particularly poignant example was its first secretary, W.M. Davis, who held the office either of director or secretary for the duration of the society's existence (Koelsch Reference Koelsch and Blouet1981, 91). Davis had studied geology at Harvard under Nathaniel Shaler and later took a post in the geology department there. However, his prospects for promotion in geology were poor, and meteorology looked like a more promising avenue. In addition to helping found the NEMS, he developed a course of instruction in meteorology at Harvard and a Laboratory of Physical Geography. Koelsch has characterized these institutions as “an empire for scientific meteorology” that was referred to affectionately by other scientists as the “Harvard School of Meteorology” (ibid., 97). In the 1880s and 1890s, he produced a number of disciples, most famously, the climatologist Robert DeCourcy Ward, who would continue on the faculty with Davis at Harvard.Footnote 18
The society's mission would evolve considerably, from a combination of an observation network and an academic society whose members met at MIT to present papers, to a “Harvard oligarchy dominated by Davis,” and ultimately to its demise in 1896 (ibid., 91). In the 1880s, the society saw its value as an institution dedicated to the study of local and regional weather (Bulletin of the New England Meteorological Society 1884a, 1–2). Its president, William Niles, an MIT geology professor with whom Rotch corresponded regularly, put the society's mission in direct contrast to the work of the Signal Service, whose wide distribution of stations made it “necessarily general in its application.” Niles continued:
Within the broad areas which [the Signal Service] recognizes there are divisions, each having its peculiar weather and climate. Our New England sections with its exposed position and its diversified surface, presents a marked variety of meteorological conditions. (“New England Meteorological Society” 1884, 300–301)
Knowledge of local conditions, in other words, was an appropriate niche for the Society in a period when the Signal Service was extending the breadth of its gaze. However, they were still anxious to hold this regional, amateur network to a high standard of accuracy. Their advertisement to observers asserted that
it is the intention of the Society to recommend for use only an accurate class of meteorological instruments, as experience has shown in many instances that the apparent discrepancies which sometimes exist in the results of meteorological records, are in a large measure due to the use of faulty instruments, or to the employment of unsystematic methods of observation. (Bulletin of the New England Meteorological Society 1884b, n.p.)
The society wanted to give more attention to smaller areas, encourage greater precision among amateur observers, and do both in a manner that was distinct from that of the national weather service. Like the Signal Service, they sought to make their observations systematic and accurate. Unlike the Signal Service, however, the overarching goal of the organization was scientific. Although the society kept an open door, its upper ranks consisted primarily of scientists and engineers, and even then, the scientists were the only ones who regularly remained in official positions in the society (Koelsch Reference Koelsch and Blouet1981, 91).
Blue Hill's founding in 1885 was a major opportunity for the society to achieve its goals. First, Rotch was determined to maintain the observatory's autonomy. He had originally intended to make the observatory a first-order Signal Service station that telegraphed observations three times a day, and he went as far as to request observers from the Service. However, he still reserved the right to close the observatory to the Signal Service at any point (Rotch Reference Rotch1884). When the Office of the Chief Signal Officer answered that they would only supply observers “if the entire control and management of the station be under the Chief Signal Officer” for some specified period of time, Rotch ultimately decided to decline the offer (Mills Reference Mills1884). It was the New England Meteorological Society that had encouraged Rotch to do so. Niles wrote to Rotch, “We think it would be a gift to our local meteorology,” wrote Niles, “to have an observatory differently equipped than a Signal Service station” (Niles Reference Niles1884).
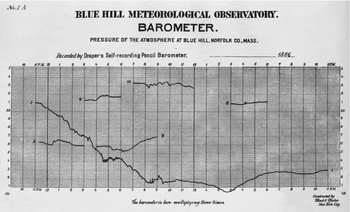
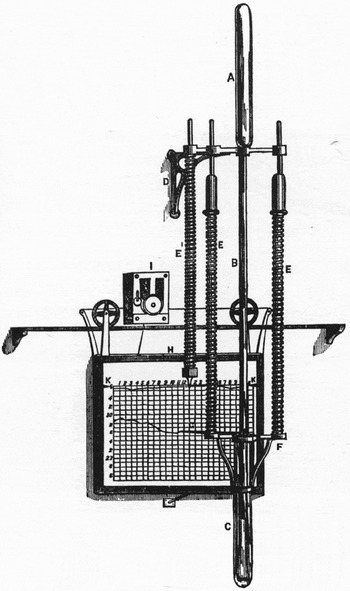
Not only was the instrumentation different from the Signal Service's stations. It was better. Members of the society encouraged Rotch to purchase self-recording instruments. A self-recording instrument really consisted of two instruments coupled together. One was a meteorological instrument, such as a barometer, thermometer, hygrometer, etc. The other was a stylus that traced, on a rotating drum, the quantity being measured – pressure, temperature, wind speed, humidity, etc. – over the course of the day. Lined paper with a scale tailored to the particular element being measured was pasted to the drum and replaced once a day at 11:00 p.m. (Rotch Reference Rotch1887b, vi). (For examples of tracings and an instrument commonly used, see figs. 3 and 4.) The readings were checked against visual observations of the observatory standards (instruments against which the rest were calibrated) three times a day to ensure accuracy of the self-recorder (ibid., viii). According to Niles, such instruments “would do much to remove the difficulty you have anticipated in getting observers” (Niles Reference Niles1884). Self-recording instruments also allowed for constant vigilance, because they could trace measurements of unexpected events. “The recent atmospheric waves observed in connection with the Krakatoa eruption could have been studied to better advantage,” argued Upton, “had there been more good records” (Upton Reference Upton1884). An observer might have been taking a measurement when the waves rippled through, but self-recording instruments traced such changes continuously, even if no one was watching the instrument and waiting it to happen.
Tracings from a Draper self-recording barometer at Blue Hill, compiled from a series of notable meteorological events and published in a published volume of Blue Hill's observations in 1886. In that volume Clayton explained that “Curve 1, Plate No. 1A, shows the barograph trace on Jan. 9, during a remarkable cyclonic storm which, moving northeastward along the Atlantic coast, apparently passed centrally over this station, and the barometer reached the lowest point yet recorded.” Clayton also compared this curve with the tracing of the Draper anemograph on that day: “Curve 6 is a tracing of the barograph while a thunderstorm passed over the observatory and was compared with the tracings of a thermograph and hygrograph at the same time” (Rotch Reference Rotch1887b). Reproduction by Blue Hill Meteorological Observatory Library/Gordon McKay Library, Harvard John A. Paulson School of Engineering and Applied Sciences, Harvard University.

Drawing of a Draper self-recording barometer from 1885. Unlike other instruments, which made traces on a rotating drum, the Draper barograph made traces on a sheet of paper that moved sideways across a rail (Engineering 1885, 534; reprinted in Middleton 1964, 317). Reprinted with permission from Engineering magazine.

The observatory's location, itself, promised a variety of studies. At an elevation of 635 feet, it was 100 feet higher than the surrounding hills, so observers atop Great Blue Hill had an uninterrupted 360-degree view of the surrounding area, including a view of the sea-level horizon 33 miles to the east (Rotch Reference Rotch1887a, 4–5). It was also one of only three mountaintop observatories in the United States (Pike's Peak and Mount Washington were the others), and of those three, it was the only one at a low enough elevation to study the movements of the lower atmosphere (ibid., 4). Rotch observed that the observatory's position made it “especially suitable for the study of the path of thunder and other local storms,” in addition to comparisons of precipitation at elevation and on the ground (ibid.). Davis – another leading member of the NEMS – promoted this feature of the observatory in Science, writing that the study of the movements of the lower atmosphere could take place without “the natural or artificial irregularities of surface that modify the records of so many of our Signal stations” (Davis Reference Davis1885, 440; quoted in Rotch Reference Rotch1887a, 3–4).
Blue Hill's location also gave it access to the communications infrastructure of the Signal Service. It was just ten miles from downtown Boston and was connected with the Boston Signal Office by telegraph and telephone, and Rotch played an active role in building those links and others with the Signal Office. Especially important was his purchase a cyclostyle machine for the Signal Office that allowed multiple copies of a synoptic map to be made and mailed to Blue Hill each day (Rotch Reference Rotch1887a, 22; Conover Reference Conover1990, 28).Footnote 19 According to Rotch, these maps significantly improved the forecasts from Blue Hill. Before Rotch provided that cyclostyle to the Boston Signal Office, the daily map had only been produced in Washington and received in Boston thirty-six hours after the observations had been made. After his intervention in the Signal Office's mapping process, the map took only four hours after the 7 a.m. observations to print, after which time it was mailed to Blue Hill, where it arrived at 2 p.m. (Rotch Reference Rotch1887a, 21). With this development, Blue Hill could combine its standing as a local observatory, well equipped to study the “peculiarities” of New England weather, and the synoptic view of the Signal Service.
The combination of a well equipped observatory and a community of professionalizing meteorologists became a platform for political activism. Davis, for instance, took the occasion of General Hazen's death in 1887 and subsequent vacancy in the post of Chief Signal Officer to offer the following advice on appointing a successor to head the weather service:
The director of the Weather Bureau should be qualified for his position by a scientific knowledge of meteorology as well as by executive ability; second, that the work of observing and predicting the weather is eminently a peaceful, and in no sense a military, art. . . . It is a mere accident, partly historical, that there is any present connection of matters so dissimilar as weather prediction and military drill. There is now a good opportunity of dissolving this connection altogether. (Quoted in [Clayton] Reference Clayton1889, 11)
Davis praised the general's decision to establish state weather services, “entirely voluntary and non-military in their nature” (ibid.).
Few were more vocal, however, than Blue Hill's observer, Henry Helm Clayton. According to A. Hunter Dupree, Clayton led a group of meteorologists to join with agricultural interests, including the Grange and land grant colleges, to campaign for the transfer of the weather service out of the military (Dupree Reference Dupree1986, 192). At the time of his arrival at Blue Hill in 1886, Clayton, twenty-six years old, was already well versed in the practice of regional and local meteorology. He had helped set up the state weather service in Tennessee. Then he worked as an assistant for astronomer-turned-meteorologist Mark Harrington at the Observatory of the University of Michigan and as an associate editor at Harrington's newly founded American Meteorological Journal (Fergusson and Brooks Reference Fergusson and Brooks1947, 247). While in Tennessee, he conducted some of his first studies of periodicity in the weather (Clayton Reference Clayton1884, 133). He also wrote a series of reviews for the American Meteorological Journal of Elias Loomis's Contributions to Meteorology. Rotch argued that Clayton's review of Loomis's work on storms made Clayton especially well qualified to issue weather forecasts (Rotch Reference Rotch1887c, 456).
By Reference Clayton1889, Clayton had compiled and published, anonymously, a collection of testimonials by scientists and the press criticizing the Signal Service's weather forecasting record and its failure to encourage and emphasize scientific research. In an introduction to the compilation, Clayton said that forecasting was far more accurate during the “scientific height” of the Service in the early 1880s, than later in the decade, as the prospects of transferring the service faded and research declined ([Clayton] Reference Clayton1889, 5). Indeed, Clayton had been emphasizing the importance of scientific training for forecasters for several years. In a letter to the Boston Evening Transcript in early 1887, Clayton argued that it was
unreasonable and unwarranted by facts to assume that a military officer, whose training has been largely taken up by military affairs, could be placed for a year or two at a time in the discharge of scientific work requiring the highest skill, and do it as well as it might be done by a man who has been especially trained in scientific work, and follows his specialty as a profession. (Quoted in [Clayton] Reference Clayton1889)
In an earlier article in Science – the same one in which he conducted the experiment with the Davenports which found lay forecasters more accurate than the Signal Service – Clayton argued that, in addition to the difference in time devoted to basic science between military officers and scientists, there was a qualitative difference between the skills of the two groups. Military training emphasized “conventional routine, and action without questioning” (Clayton Reference Clayton1887b, 113). Forecasters at the Signal Service were using only rudimentary knowledge that storm systems tended to move eastward; they had not taken into account the “splendid researches during the last ten years of Loomis, [German meteorologist] Van Bebber, and a host of others” (ibid., 113). One might have objected to Clayton that Loomis's textbook was required reading at Fort Whipple, but that would not have been enough for Clayton, because he was comparing the Signal Service with the European weather services that Rotch had visited several years earlier and likely discussed with Clayton on several occasions.Footnote 20 There, wrote Clayton, “the men in charge . . . are scientific men, who not only do their present work well, but, sustained and enthused by their work, are investigating the difficult problems which present themselves, and thus rapidly pushing meteorology to a higher standpoint” (ibid., 113). The best forecasters were not only versed in meteorology, but were enthusiastically engaged in work at the cutting edge of meteorology.
Clayton's accusations of the national weather service were not necessarily fair or accurate. But others had difficulty adapting to research at the Signal Service, as well. Alexander McAdie, a signal officer in Washington who had worked at the Boston Signal Office (and would later become director of Blue Hill), wrote of one of his investigations that
the work is really good and worth publication – but as you probably know – the Office is publishing nothing. All we can do is to get in half a page or so of text and a chart in the Monthly Weather Review. I often wish I was back again in the Hub [Boston]. At least I don't wish – but I am alive to the difference in this respect of the two places. (McAdie Reference McAdie1886; see also Koelsch Reference Koelsch1986, 531)
For Clayton, as well as his colleagues at Blue Hill and in the NEMS, scientific training went hand in hand with a scientific knowledge of local weather conditions. “During the last few months,” Clayton reported, “I have endeavored to ascertain the causes of the many failures in New England of the signal-service ‘indications.’” The problem with the Signal Service's New England forecasts, Clayton wrote, was probably “the position of New England between the lakes on one side, and the ocean on the other.” How did Clayton determine this? “We find from local observations here in Boston, that, when a storm approaching from the west passes over, the sky begins to clear almost immediately after the passage of the line of minimum pressure.” On a synoptic map, rain may have been reported at the Great Lakes stations even when the low pressure center of the system has already passed over Boston. In those circumstances, wind patterns brought moisture-laden air over the lake to stations such as Oswego and Marguette, but those storms never reached Boston, because the conditions for storms in Boston have already passed. “The signal service,” however, “ignoring all local influences, and basing their predictions on the eastward movement of weather-changes, predict over and over again rain or snow for New England, which, under such conditions, seldom arrives” (Clayton Reference Clayton1887b, 113; emphasis added). Understanding local weather often meant reading a synoptic map; but it also meant knowing the behavior of weather in a particular area.
Hacking into the Network: Bridging Local and Synoptic Knowledge at Blue Hill
Clayton's boldness in his “Plea for Civilian Control of the Weather Bureau” may have been fueled by Blue Hill's apparent success in forecasting. In February 1887, shortly after Clayton's article came out in Science, Rotch reported the results of the observatory's “Experiment in Local Weather Prediction,” conducted over the last six months of 1886, in the American Meteorological Journal. The experiment was to make forecasts for the nearby city of Boston, and then compare the success of those forecasts with those of the Signal Service. Rotch happily reported that, in five of the six months, Blue Hill had higher verification percentages than the government weather service (Rotch Reference Rotch1887c, 455). Rotch offered an explanation for why this might have been the case:
The superiority of Blue Hill, or other local predictions, over those of the Signal Service, lies in the fact that it is impossible for predictions made at one central station to take into account local causes which may influence the weather at any distant place. These influences each meteorologist learns for his own locality, and when his observations are combined with a knowledge of the weather conditions existing that day over a large extent of country, as shown by a synoptic chart, he is better able to prophecy the weather for his locality than is the Signal Service, which generalizes for large areas, though the weather probabilities for his own town are what each inhabitant thereof wishes to know. (Ibid. 457–458)
Rotch's explanation was more than an advertisement for Blue Hill. It was an epistemic claim for the importance of local knowledge in forecasting, even with the aid of a synoptic map. “From the map and from the local observations and traces of a number of self-recording instruments, the afternoon prediction is prepared,” wrote Rotch. Rotch did not follow this up with details on how these elements were combined; rather, he promoted the forecaster, Clayton, as “especially fitted for the work by his review of Loomis' Study of Storms in the United States, which is now being published in the Journal” (ibid., 456). Clayton's knowledge of meteorology, specifically his recent scientific work, was an important qualification for a forecaster.
Blue Hill's forecasts appeared in the Boston Evening Transcript, where they were printed right above the “Official Weather Predictions” from the Signal Service in Washington, and the contrast between the two highlighted the local nature of Blue Hill's forecasts. A typical forecast would be something like the following:
Blue Hill Predictions
Blue Hill Observatory, Oct. 3—2 P.M. (For twenty-four hours, beginning at 12 o'clock tonight.)
For southeastern New England—Rain, followed in the morning by cooler, clearing weather.
Synopsis for the Next Thirty-Six Hours.
The storm, which is now central in the lake regions, is expected to continue moving slowly east.
[Signed] H.H. Clayton, Observer. (Boston Evening Transcript 1887)
The prediction narrated the day using qualitative descriptions (“rain,” “cooling,” “clearing”) and juxtaposed the forecast with the wider picture (a moving storm, now over the lake) that Clayton took from the Signal Service's synoptic map. The Signal Service “indications” were similar in many ways:
Indications
Washington, Oct. 3—10.30 A.M. (For twenty-four hours, beginning at 3 P.M. today.
For New England and eastern New York—Slightly warmer, followed by lower temperature; rain; fresh to brisk southwesterly winds on the coast.
Weather Synopsis.
Washington, Oct. 3—7 A.M. (For the past twenty-four hours.) The storm which was central in Minnesota yesterday has now moved eastward with increasing energy, and is now central over the eastern portion of upper Michigan. Westerly winds of fifty miles an hour have been reported from Milwaukee, Wis. and Port Huron, Mich. A high area has moved from the Pacific coast southeastward to Nebraska, where a temperature of 30 is reported. Rain has become general from Wisconsin and Illinois to New York and Pennsylvania. The temperature has fallen generally east of the Mississippi, except stationary from North Carolina to Ohio.
Maximum Temperature in Boston. The highest temperature recorded at the signal service station yesterday was 67.
The Weather in New York
New York, Oct. 3—8:30 A.M. Weather clear and mild; wind southeast; thermometer 58°. (Boston Evening Transcript 1887)
The predictions also narrated the day using qualitative descriptions. It also described the storm over the Great Lakes, thereby connecting the New England region with the larger national picture. Unlike Clayton's forecast, though, the Signal Service gave a synopsis for the previous 24 hours, and the period for which the forecast was made only continued until 3 p.m. the next day. Readers of the evening paper were already several hours into the period for which the forecast was made. The regions they covered were also different. These differences, of course, posed difficulties for comparing forecast verifications, but they also reflected a difference in what was considered useful and what needed to be indicated to the readers. Clayton ended his synopsis by saying that the storm was expected to move eastward, i.e., from the Great Lakes to New England, thereby communicating its significance to the area of southern New England. The Signal Service, on the other hand, gave a picture of the state of the atmosphere over a large portion of the country, but they did not include its implications for New England weather.
How did Blue Hill add “local observations” to the work of the Signal Service? In his “Plea for Civilian Control,” Clayton had given one example of how he combined local observations with the synoptic map: Even if it was raining over the Great Lakes, Clayton had found that the sky cleared as soon as the line of minimum pressure moved over Boston. Because the Great Lakes were further west, however, it was assumed by the forecasters at the Signal Service that the rain over the Great Lakes would eventually reach Boston due to the tendency of storms and other features on the synoptic map to travel eastward. A daily synoptic map, or even thrice-daily synoptic maps, would not have provided that correlation as effectively as a continuous graph of the barometer readings at the observatory, which traced pressure readings continuously. This strategy was representative of Clayton's larger project to combine the unique geographic vantage point of the observatory, the almost unique instrumental vantage point of the observatory, and the Signal Service's synoptic maps – now available to the observatory thanks to Rotch's investment in a cyclostyle machine – into what Anderson has called a “technological version of sensibility” (Anderson Reference Anderson2005, 232–233).
Cloud observations were central to the forecast work of Blue Hill, and Clayton's observations from 1886 to 1890 were, even by Clayton's death in 1946, the only hourly observations of cloud height, form, and movement in the western hemisphere (Fergusson and Brooks Reference Fergusson and Brooks1947, 247). The observatory's altitude gave it a decided advantage in these measurements. According to Clayton's instructions for observing clouds, the height of the base of the lowest clouds could “be ascertained by walking down the side of the hill.” The altitude of Blue Hill also meant that cloud shadows could be seen for miles, “and by timing the movement of the shadows, the velocity of the cloud can be determined.” Other cloud heights were measured by triangulation with another station that was a kilometer away, or by measuring the angular altitude of the light reflected by the cloud on other cities (Clayton and Fergusson Reference Clayton and Fergusson1892, 30:207–208).
Although the observatory's long, 360-degree view certainly helped his observations, Clayton was careful to distinguish his observations from lay observers by highlighting the importance of instrumentation. In a review of Instructions for Observing Clouds, Clayton wrote that
the advance of science. . .consists largely, if not entirely, in the use of instruments to supplement or displace human judgment; and as few people would trust to merely dampening the finger and holding it up in order to determine the direction from which the wind blows, the present writer hopes that it will not be long before some form of cloud mirror, or nephoscope, will be generally adopted for determing [sic] cloud motions in place of the crude methods now in use. (Clayton Reference Clayton1888d, 379–380)
A network of instruments was one of the things that would distinguish a local observatory from observations of the sky like that of Blue Hill's neighbors, the Davenports. Nephoscopes – instruments that facilitated measurements of cloud movement and velocity – would, indeed, be used at Blue Hill by the late 1880s, but they were only one part of the complement of instruments and graphical aids Clayton would use to develop his understanding of local weather.Footnote 21
Clayton would use these cloud studies to lay claim to a number of improvements in the scientific basis of forecasting. Like Abbe, Clayton believed that the goal in weather forecasting was a “deductive method” which “may be described as deciding from well-known laws of physics what will be the future action of atmospheric disturbance already in action and where future disturbances will appear.” To Clayton's mind, “weather forecasting will not reach its highest development until the laws developed by induction have been explained and expanded so that deductive methods can be successfully used in forecasting” (Clayton Reference Clayton1892, 128). Clayton believed that he, himself, was working toward this goal, but he also believed his work fell short in that it did not involve work in physics. Rather, it was “inductive work” that involved refining and discovering new laws of the behavior of weather. Blue Hill would contribute to this refinement through its cloud studies. Its studies had already confirmed the findings of other students of cloud movement, such as British meteorologist William Clement Ley and Swedish meteorologist Hugo Hildebrandsson, that storms travel in the direction of the higher clouds (ibid., 129). Clayton even went a step further to claim that Blue Hill's observers had found that clouds at a given altitude followed the isobars calculated for that altitude (ibid., 130). New methods developed by meteorologists in Europe, Clayton wrote, allowed him to calculate pressure at higher altitudes from pressures taken near the earth's surface.Footnote 22 This, in turn, allowed him to draw isobars for any altitude as he would for sea level (ibid., 129). As in his forecasting, Clayton's inductive method combined synoptic maps with new methods of calculation and new observations.
One of the best examples of the combination of local knowledge, synoptic knowledge, and forecasting was in an 1892 study Clayton conducted for his old mentor, Mark Harrington, who had become chief of the Weather Bureau in 1891 after its transfer to the Department of Agriculture. Harrington wanted to develop a better understanding of what Clayton called “the laws governing the movement of storms. Harrington had asked Clayton to investigate the connection between the movements of storms and the movement of the higher clouds. Clayton conceptualized the study as one that would not only improve analysis of the synoptic maps that displayed the storms, but improve an observer's ability to make meaning out of local observations.
Clayton used synoptic maps as the basis for an inventory of areas of high and low pressure systems. He divided each map into squares of five degrees of latitude and longitude. Whenever a low or high pressure center was located over a particular square, the date of its appearance was entered under the number for that square, as well as the shape of the isobars (circular, elliptical, or elongated), the major axis of the ellipse or elongation, the direction of the center's origin, and other elements (ibid., 132).
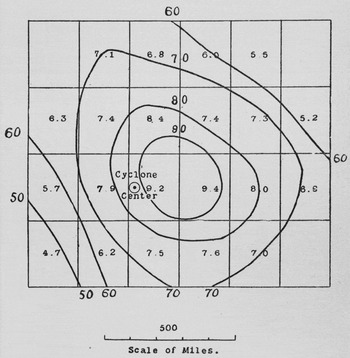
Once the data for each center was tabulated, Clayton brought in the studies of clouds from Blue Hill and used it to better understand the relationship between the clouds in an area and the movement of nearby storms. Figure 5 shows his map of cloudiness in a low pressure system. To produce this map, he grouped together data on low or high pressure centers that were in one of the five-degree squares adjacent to Blue Hill's square and noted what direction the center was in relation to Blue Hill. He then grouped data for successive distances – two squares away, then three squares away, in each direction. After that, he graphed isonephs – isolines connecting squares of similar cloudiness – that gave the average cloudiness at Blue Hill at each distance and direction from the storm center. The result was a map composed from data produced by analyzing another series of maps. Additionally, however, it was composed of data from a single station, Blue Hill, at different times and places relative to the low pressure center (ibid., 133). In reporting the findings from the map, Clayton combined the broad-based knowledge one can get from a synoptic map of a low pressure system – “These isonephs show that the centre of the cloud sheet and the maximum cloudiness are about two hundred miles in front of the cyclone centre, and over an area several hundred miles square the cloudiness averages more than ninety percent” – with the local knowledge developed at Blue Hill – “Over the area inclosed by the line of ninety per cent it is found that the most frequent clouds observed are those whose bases are below the top of Blue Hill, that is, only about one hundred meters above the level of the surrounding country” (ibid., 133). Clayton's map, in other words, was a manual for finding one's position inside a low pressure system, and a way to make local knowledge span a geographic area of hundreds of miles.
Aggregation of mean cloudiness in different parts of a cyclone. It should be noted that the squares do not correspond to different points relative to the Blue Hill Observatory. Rather, each square gives the average cloudiness registered at Blue Hill when it was at different distances and directions from the center of a low pressure system (Clayton Reference Clayton1892, 132A). Reproduction by Harvard College Libraries. This image originally appeared as part of ProQuest's American Periodicals product. Reprinted with permission from digital images produced by ProQuest LLC.

This project was not atypical of Clayton's efforts to bridge local and synoptic knowledge. He also used it to further a project he had embarked upon while still in Tennessee in the early 1880s. Clayton analyzed time series of measurements of pressure, temperature, and storm positions to determine whether variations in pressure, temperature, and storm frequency were periodic. While at Blue Hill, he took weekly thermograph curves from the base station of Blue Hill, and, at the suggestion of W.M. Davis, drew vertical lines through the maximum of each diurnal wave, the minimum, and the average, “as accurately as could be determined by the eye” (Clayton Reference Clayton1893, 35–36). Visual observations of the curve, and the corresponding table showing the days of maximum temperature, revealed “a vere [sic] striking regularity between the intervals of many of the maxima.” Clayton investigated and found that “almost all the maxima could be arranged in such a way that they followed each other at regular intervals, mostly six or seven days” (ibid., 36). Clayton expanded these investigations of periodicity by applying them to the movement of storms in the United States, as indicated by synoptic maps. Clayton broke down a map of the United States into a grid of segments 15 degrees of longitude wide and 10 degrees latitude high. By counting the number of times low pressure centers appeared in each box, he derived a statistical series from a map and rendered that series in a different medium, this time a table with each row representing a day in the seven-day period and each column representing a 15-degree-longitude segment of the grid. By putting the maximum storm frequency in bold, Clayton identified a movement of storms eastward, and identified an apparent cycle of seven days in each segment (Clayton Reference Clayton1894, 225–226).
Clayton was not the only one working on cycles, at that point. One of the progenitors of neoclassical economics, William Stanley Jevons, had famously tried to correlate weather cycles with sunspot cycles in the 1860s; and meteorologist Frank Bigelow was working on correlations between sunspot cycles and weather cycles in the 1890s at the Weather Bureau (Porter Reference Porter1986, 277–278; Pietruska Reference Pietruska2011, 89). Clayton's approach, however, reflected a commitment to preserving a place for local knowledge, and even tradition. While the national weather service was frantically trying to distance itself from nonscientific “weather prophets,” Clayton was quick to point out that weather cycles had been noted by scientists like former Smithsonian Secretary Joseph Henry – progenitor of the first national correspondence network for weather data – as well as by lay prophets like Henry Vennor, publisher of Vennor's Weather Almanac, which also happened to be one of the weather service's main targets of criticism (Clayton Reference Clayton1885, 167–168). Clayton was validating local observations of a nonscientific kind, but he also cast his own work as having substantial value over and above those of a layperson, or even an almanac author, who was predicting on the basis of these cycles. In the debate over verification, the value of local forecasts and the value of local observations would be debated with these kinds of people in mind – laypeople like the Davenports; “ignoramuses”; “children”; and other hypothetical prognosticators who might try to predict the weather, and might even do surprisingly well at it.
Debating the Value of a Forecast: Clayton versus Hazen
Blue Hill's claims to superiority over the Signal Service's forecasts invited criticism from within the Signal Service. Henry Allen Hazen, one of the original members of the Signal Service Study Room and regular critic of the Signal Service's own assessments of its work, wrote to Blue Hill arguing that the observatory's verifications were “all moonshine” and challenged Clayton to a contest in which they made predictions for the city of Boston (Clayton Reference Clayton1888b, 22–23). Hazen disputed Blue Hill's claim that “it is evident that a man can locally predict better than another hundreds of miles away.” He argued, to the contrary, that local knowledge was a hindrance: “If a man looks up at the sky and sees it threatening rain or clearing he will be affected by local peculiarities instead of by general considerations and in so far will be misled” (Hazen Reference Hazen1888a).Footnote 23 By framing the difference between Blue Hill's methods and the Signal Service's methods as a difference between “looking up at the sky” and looking at “general considerations,” Hazen framed the competition squarely as one between forecasting from local observations and forecasting from synoptic maps, but the image he painted of Blue Hill forecasters “looking up at the sky” also associated Blue Hill forecasters with lay forecasters who used signs from the sky, as well as the behavior of animals and changes in one's own body, to forecast the weather. Katharine Anderson has argued that the ability of laypeople to forecast the weather at a glance, using variables from their immediate environment, suggested “the instability of the hierarchy of intelligence and sensibility – a hierarchy in which more learning was not necessarily a source of superiority” (Anderson Reference Anderson2005, 177). Hazen, as we saw earlier, strongly believed that more scientific learning led to better forecasts and could, at least to some degree, stand in for long experience. Blue Hill, for its part, was also interested in distinguishing itself from “lay forecasting,” but its explicit identification with local knowledge of the weather left it open to portrayals like Hazen's. Blue Hill's task was to show that local knowledge could also be scientific.
Although Hazen's response was not an official response from the Signal Service, Footnote 24 it can be read as part of the larger difference of opinion within the Signal Service about the meaning of their decline in verifications. Hazen did not only dispute Blue Hill's observations. He also debated Greely's interpretation of the Signal Service's decline in verifications, an interpretation that reflected badly on him and, to some degree, Abbe (see Hazen Reference Hazen1888c). As in the case of the Signal Service's internal conflict, though, the results of the “competition” were not a cut-and-dried decision as much as they were fodder for a new debate over the proper interpretation of forecast verifications. The original contest was conducted according to the following rules:
Prediction: Fair weather. – Success: if fair three times; cloudy, fair, clear in any order; and any cloudiness less. Failure: if cloudy twice in any order; cloudy, fair, fair in any order, and any cloudiness above; a drop of rain.
Prediction: Threatening. – Success : if cloudy twice in any order; cloudy, fair, fair and any cloudiness above; rain .01 [inches] or less. Failure: if fair three times; cloudy, fair, clear in any order; and any cloudiness less; rain over .01 [inches].
Prediction: Rain. – Success: rain at any time over .01 [inches]. Failure: rain .01 [inches] or less and any cloudiness. (Clayton Reference Clayton1888b, 23)
The rules were slightly different from the forecast verification scheme used by the Signal Service, and they revealed a number of tacit assumptions about how a forecast should be valued. Leeway was given, for instance, so that some cloudiness did not doom the forecast. It could be cloudy at some point during the day, but as long as it was mostly “fair,” a forecast of “fair” succeeded. On the other hand, if there was any rain whatsoever, a forecast of “fair” failed.
The competition solved nothing. In fact, it exacerbated the disagreement between Clayton and Hazen and prompted an exchange about the appropriate way to assess the value of a forecast. By Hazen's accounting Hazen had “won” the competition (Hazen Reference Hazen1887, 323). But verification was in no way straightforward, and then, as now, it was open to gaming. Successful forecasts were not necessarily the result of a good forecast; one could easily be right by coincidence, as the Finley Affair had demonstrated. Hazen and Clayton had agreed that the forecast area would be “Boston,” and that “rain” would involve detection of .01 inches of rain on a particular day, and that the month would be October (Clayton Reference Clayton1888b, 23). But they differed on how they had decided to verify the predictions. Hazen sent the results to two outside scientists “in order to obtain a fair comparative estimate.” Hazen relied primarily on the verification scheme of one of the scientists who gave the Signal Service 69 percent verification and Blue Hill 65 percent (Hazen Reference Hazen1887, 323). Clayton cried foul at this referral, saying they had agreed on the verification rules, and that Blue Hill had been making predictions with that verification method in mind (Clayton Reference Clayton1888b, 23). Changing the method of verification would not only change the scores; it would change the forecasts.
The exchange between Hazen and Clayton continued in the American Meteorological Journal. Hazen, using the pseudonym “Gan,” analyzed Blue Hill's predictions for 1887.Footnote 25 This article explicitly challenged Rotch's declaration that Blue Hill's forecasts were superior to the Signal Service's forecasts in the second half of 1886. The debate dealt with verification, but underlying it was the question of how to value a forecaster's expertise. Was an easier forecast less valuable? According to Gan, it was. Blue Hill's predictions were easier than those of the Signal Service, because it was “well known that sunset is a very favorable time for local predictions of weather.” Gan then illustrated the “ease” of the forecasts through a simple experiment: What if “a child or totally ignorant person” had simply predicted a “stationary temperature,” that is, a change in temperature of less than 5 degrees. That “child,” Gan argued, would have beaten Clayton's forecasts every month. This led to the absurd conclusion “that the skill in predictions and the assistance acquired from the daily maps are really hindrances, and one would be much better off to predict, as the Almanac maker does, for 100 years in advance” (Gan 1887, 375). A method of forecast verification needed to capture the value of the forecaster and their tools. Without that, what was the value of a short-term forecast, if an Almanac maker could forecast 100 years in advance and still achieve a better forecast? Once again, Hazen compared Blue Hill's prediction to “weather prophets” to distinguish his own forecasts from those of Blue Hill.
One of Clayton's and Rotch's associates in the New England Meteorological Society, William Morris Davis, addressed head-on Gan's comparison with an “ignoramus”:
a totally ignorant person could not know enough to choose from among the several verbal forms of prediction those particular forms which would lead him to the highest percentages of success. He would be as likely to say “decidedly lower” as “stationary” temperature, for he could not be expected to know that, according to definition, even in so changeable a climate as New England's, the temperature from day to day is generally “stationary” . . . If Gan would try the luck of all kinds of children and ignorant persons . . . then the average of all the results might be fairly compared to the results of professional prediction: but such comparisons are not worth the trouble of making them. (Davis Reference Davis1888, 409)
The very fact that a forecaster understood that this persistence was characteristic of a region's weather, argued Davis, was enough to prove that their forecasts had value. Davis's response also reinforced the position of the New England Meteorological Society that understanding the “peculiarities” of local weather – especially “so changeable a climate as New England's” – was an important part of the knowledge base of a forecaster (ibid.).
Clayton also responded to Gan's hypothetical case, but his response focused on the local particularities of the weather forecasts that were verified. The timeframe, according to Clayton, consisted of “the driest months of 1887. During all except one of these months the rain-fall was decidedly below normal, and there was almost a drouth.” Clayton continued, “it has become an adage that ‘all signs fail in dry weather.’” As he did in his analyses of cycles, Clayton took a common saying and grounded it in his experience observing local weather. The “signs” in this case, were clouds, whose movements Clayton was in the process of codifying and hybridizing with synoptic maps. “In such cases when areas of low pressure pass over, the clouds become dense and seem almost on the point of rain, but they as frequently pass away and not a drop falls.” Even in those cases, argued Clayton, “predictor must be guided somewhat by normal conditions” (Clayton Reference Clayton1888a, 414). Not only was Gan cherry-picking the forecasts to verify, Clayton argued. He was ignoring best practices in forecasting, which was to do what was most valuable to the public. Clayton continued that “even such predictions are certainly better than a prediction of fair all the time, for they indicate to the public the times when rain is most likely to occur, and the times when rain is scarcely at all likely to occur; and this must be of value even though rain is predicted too often” (ibid., 414; emphasis in original). The forecaster's job was not to provide certainty, but to provide guidance to the public in making decisions in the context of the weather.
Gan objected to Clayton's reasoning, writing that “in a dry time when ‘all signs of rain fail’ a skillful person ought to obtain a higher percentage than a ‘skillfully ignorant’ one.” Additionally, Gan used Hazen and Clayton's competition to show that the forecaster “on the spot” only made 80 percent of his predictions, “and [Hazen], 300 miles away, 96 per cent” (Gan 1888, 38–39). This reinforced the point Hazen made in his letter to Rotch, that access to local weather ended up hindering Clayton, rather than helping (Hazen Reference Hazen1888a). Additionally, the skill of a forecaster, according to Gan, was measured in their ability to predict weather even when signs failed. For Clayton, signs guided a forecaster in their use of synoptic maps; for Gan, signs fooled the forecaster.
Clayton and “Gan” never came to an agreement on who won the competition, or whose predictions were better. Indeed, they could not agree on the appropriate methods of verification. Anticipating this early in his first response to Gan, Clayton offered another way of resolving the dispute:
Since the methods of comparison have been called in question, perhaps it will be allowable to adduce public opinion as evidence in the matter. Complimentary notices of the Blue Hill predictions have appeared in almost all of the Boston papers; and to prove that these are not mere empty compliments, the Associated Press in southeastern New England have been willing to pay something for the predictions, notwithstanding they have free predictions from Washington. (Clayton Reference Clayton1888a, 416)
Those market signals were not simply a rhetorical flourish on Clayton's part. They were integral to the observatory's measure of its epistemic success.Footnote 26 In March 1888, after the “competition” was finished, Rotch doubled the Associated Press's $25.00-a-month fee for the observatory's weather forecasts. Rotch's grounds were the results of the previous year's predictions against the Signal Service. “The comparisons of these predictions with those of the Signal Service, verified by the same rules and for this locality, gave for the twelve months ending with December 1887, the following percentages of success for the forecast of weather: Blue Hill 78, Signal Service 72” (Rotch Reference Rotch1888b). Rotch also reminded the Press that “tho. the Blue Hill and Signal Service Predictions reach the public through the afternoon newspapers at the same time, those of Blue Hill are extended nine hours longer in advance than those of the Signal Service, which is equivalent to 7%.” All told, Blue Hill's forecasts were 13 percent better. Rotch continued, “now that the value of the local predictions has been demonstrated I would ask that the price of these predictions be advanced to fifty (50) dollars per month, otherwise I shall probably be obliged to discontinue them” (ibid.). Forecast verification provided a justification for a higher price tag, one that would, in fact, allow the observatory to make a profit on the forecasts.
Although Hazen was never satisfied with the outcome of the competition, Rotch and Clayton acted as if the matter had been resolved. In 1890 Rotch wrote in the introduction to the Observations Made at the Blue Hill Observatory that “the advantage of local weather predictions over general ones, which was the object in instituting the Blue Hill predictions, seems now to be generally admitted” (Rotch Reference Rotch1896, vol. 30, x). An article in The Daily American, a newspaper from Clayton's home state of Tennessee, crowed that “The Tennessean Won: How a Murfreesboro Youth Eclipsed Prof. Hazen” (Daily American 1888). The favorable coverage of Blue Hill is further evidenced by Hazen's frustration that Clayton “published in foreign journals his side of the story and also in this country” (Hazen Reference Hazen1888c).
In 1889, the Signal Service released their forecast verification schemes to the American Meteorological Journal for the first time (“Verifications at the Signal Office” 1889). This newfound disclosure renewed Clayton's interest in the topic; “heretofore, but few have had access to them, and hence have had no means of determining the value or meaning of the per cents published in the U.S. Weather Review.” Not surprisingly, though, Clayton believed that this public release of information required a critical response. There was too much “latitude” in Signal Service verifications, so much so that different verifiers could end up calculating radically different percentages, and interpretation in such conditions was difficult. A more exact method had to be determined “in order to attach any meaning to a per cent of success” (Clayton Reference Clayton1889, 213). He therefore set out to improve upon the forecast verification scheme of his own, and though he was only partially successful, his verification scheme shows the efforts he made to incorporate the value of local knowledge into the value of a forecast. At the same time, he tried carefully to distinguish his role as a forecaster from that of laypeople. His methods relied, in part, on earlier scholarship precipitated by the Finley Affair, his debate with Hazen, and finally, his methods of observation and forecasting at Blue Hill. Clayton's efforts in forecasting involved new methods of analyzing local weather by hybridizing local observations and general Signal Service maps. Clayton began by setting out the problem of determining a forecast's value:
Suppose a weather predictor should confine his forecasts to intervals of a week, and by the side of a column of figures containing the days of the month write “about this time look out for rain.” Such predictions might be 100 per cent verified and yet have comparatively no value. (Ibid., 211)
A more detailed forecast of thunderstorms might have a lower percentage of success, argued Clayton, but was far more valuable than the 100 percent chance of rain over the span of a few days. But how could one balance the value of specificity with the value of accuracy?
Clayton systematically noted four questions a verification scheme would need to take into account:
-
1. “To determine “at what point weather forecasts cease to have any value.”
-
2. “To determine what part of their success can be attributed to chance.”
-
3. “When they deviate from this in the right direction to give them a proper weight in the verification in proportion as they approach the exact facts.”
-
4. “To so arrange the material (as is now done by the German Seewarte) that the weak points of the forecasts are pointed out and thus open the road to improvement.” (Ibid., 213)
Clayton succeeded in meeting the fourth criterion in his verification scheme and failed in meeting the third one. The first and second, he argued, depended on the locality of the forecast: “It would seem that every one ought to be familiar with the climate of the place in which he lives, and weather forecasts would only become valuable as they exceeded the per cent of success which might be gained by stating well known, or easily ascertained climatic facts” (ibid., 214). In other words, what was the forecaster able to offer that the average person, or intelligent persons such as his neighbors, the Davenports, could not offer? Whatever could not be guessed simply from “familiarity” with the weather was the value of the forecast.
Clayton continued to press the importance of understanding “normal weather” in his critique of the solution G.K. Gilbert had put forward in his response to Finley's verifications. Clayton noted, for instance, that Gilbert's solution to the problem of verification indicated that no skill had been used if fair weather was forecast and occurred for the entire period of verification. In the case of tornado forecasts, this worked well enough, because “no tornado” forecasts were entirely the norm for months at a time. But this, Clayton said, “certainly does not apply to a climate like that of New England, where if a drought of a month should occur it might require the highest degree of skill to predict fair weather every day” (ibid., 218). Fair, unchanging weather was not the norm in New England, and a verification scheme that didn't take the characteristics of local weather into account failed to establish the value of a forecast. This echoed Clayton's response to Gan that forecasting in a near-drought period was far more difficult than forecasting in a period with normal rainfall. Clayton argued that a better solution, to determine the role of chance versus skill, was to find “the normal frequency of any phenomenon” over a particular period. For that to hold, of course, “chance” would have to indicate what could be guessed by someone who is familiar with the “normal weather of a place,” rather than simply the random guess of an “ignoramus” or a “child.”
The assessment of forecast's value, and therefore a forecaster's value, depended on the assessor's understanding of the relationship between knowledge and place. Clayton's responses to Hazen regularly invoked the public opinion of New Englanders, and his ultimate determination of a forecast's value required an understanding of the “normal weather” of a place. At the same time, he argued that the expertise required by the forecaster included an understanding of “local weather” that was produced through the combined knowledge infrastructures of the Blue Hill Observatory and the Signal Service.
Conclusion
Clayton's goal to demilitarize the Weather Bureau and decentralize forecasting was ultimately realized in 1891, when the Weather Bureau was transferred to the Department of Agriculture by an act of Congress. Clayton's old mentor, Mark Harrington, a civilian scientist, became its head (Whitnah Reference Whitnah1961, 64). By 1894, forecasting was decentralized when a system of district forecasting stations was established. But just as the work of Blue Hill helped effect a transformation in the national weather service, the substantial changes in the national weather service sent ripples through the community of professionalizing meteorologists. With the realization of Clayton's goal came the end of some of the local services and research that was motivated by the need for an “alternative” to the national weather service's centralized infrastructure. The New England Meteorological Society transferred the operations of its observation network to the Weather Bureau in 1892 and became fully devoted to research in meteorology (Koelsch Reference Koelsch and Blouet1981, 93). Four years later, as Davis became less and less interested in meteorology and more interested in geography, the NEMS dissolved, as did the American Meteorological Journal (ibid., 100; Ward Reference Ward1896). Blue Hill focused more on upper-air observations, and less on forecasting, as years went on. Clayton became a district forecaster for the newly demilitarized Weather Bureau in the early 1890s, though he would find himself standing trial for a number of “errors” in drawing the weather maps (Pietruska Reference Pietruska2011).
Although many of the players in this drama moved on, the role of “theoretical meteorology” in forecasting and centralization in forecasting was in no way resolved. Harrington sparred with the Secretary of Agriculture over the place of theoretical research in the new Bureau (ibid., 88). Although the bureau was a civilian bureau, its public persona still made certain scientific research efforts taboo, especially research into long-range forecasting (ibid., 89). And to this day, as Gary Fine has aptly observed, the National Weather Service debates the relative merits of centralized forecasting offices where forecasts of different regions could be “fit together” at a central office, or regional offices in which “each office has its local weather and each office has its local hazard.” The transfer of forecasters between offices – the usual route to promotion – often means “their intuitions must shift” (Fine Reference Fine2007, 124). Forecasting in the National Weather Service is often a struggle in which “local cultures must battle against central authority to permit flexible responses to local challenges” (ibid., 219).
Clayton continued his work on periodicity until the end of his life, in collaboration with the Smithsonian Institution, specifically Smithsonian's head, Charles Greely Abbot, who worked on correlating solar radiation cycles (sunspots, primarily) with weather (Clayton Reference Clayton1947; Abbot Reference Abbot1955). In fact, techniques in climatic research – tree ring studies, especially – were innovated, with substantial support from the Carnegie Institution, in the hope of finding “climatic cycles” that could form a basis for the long-range forecasting of weather (Douglass 1919; Carnegie 1929). Though the periodicity of climate cycles faded in interest, the tree ring studies that it motivated have been important in finding evidence for climate change (Nebeker Reference Nebeker1995, 94; Weart Reference Weart2008, 121–122).
Although many of the developments in the late nineteenth century proved less robust than later knowledge infrastructures, the case of Blue Hill reminds us that, even in the nineteenth century, control of infrastructure was both centralized and distributed. Edwards has astutely pointed out that meteorology is a manifestation of “infrastructural globalism” (Edwards Reference Edwards2006). The case of Blue Hill shows that we also need to look for “infrastructural localism,” a bridge across the space between local knowledge, lay knowledge, and putatively “universal” knowledge of the kind meteorologists in the nineteenth century saw in physics and astronomy. Such pursuits may help address the need to connect global, regional, and local scales of weather and climate as the need for action on climate change becomes increasingly urgent. Mike Hulme has argued that framing climate change as a global phenomenon has obscured its importance on the local scale where weather is generally perceived, while Vladimir Janković and Michael Hebbert have noted that a focus on the effects of climate change on urban climates has only recently garnered the attention of climate modelers (Hulme Reference Hulme2008; Janković and Hebbert Reference Janković and Hebbert2012).
This need for dialog between scales has become all the more important as we enter another age in which data about the weather is rapidly becoming richer and more far reaching and when local knowledge of the weather becomes increasingly mediated by knowledge infrastructures. Consider, for instance, the case of the Climate Corporation, a San Francisco-based startup that uses public data and high-power computing to offer crop insurance to its customers. The company uses National Weather Service data to model the climate down to scales below that of individual fields and then uses that to sell farmers all-risk crop insurance tailored to their operations. Data is gathered from multiple networks and packaged for farmers as part of the local knowledge of their fields. Even more interesting is the way the company justifies the value of their services. The company's director of agronomic research, Jeff Hamlin, frames this in terms of the increasing unpredictability of the weather due to climate change. “‘If I talk to a grower for five minutes, he will say what the data also show,” Jeff Hamlin told me a few days later. ‘These enormous changes are hard to handle’” (Specter Reference Specter2013). Rather than define value in terms of what weather forecasters know over and above what the average person knows about their own climate, the new forecasting services, while tailoring their work to local conditions, are defining value on the basis of the fact that the average person can't know their local climate, anymore. Even in the case of a farmer's local knowledge, infrastructure is becoming as integral as it is in the case of global knowledge.
Acknowledgments
The author would like to thank Deborah Coen, Sarah Jansen, Jamie Pietruska, Roger Turner, and several anonymous reviewers for their comments and advice on earlier drafts of this article.