I. INTRODUCTION
The modern world is dependent on cement-based materials, such as concrete, mortar, and bricks. The cement constituent is a fundamental element in the composition of critical infrastructure, commercial buildings, and residential housing. Cement is the most widely used material in the world and forms the foundation of our infrastructure. About 4 billion metric tons of Portland cement clinker are produced every year (Cheng et al., Reference Cheng, Reiner, Yang and Guan2023). The production of cement clinker is currently responsible for approximately 7% of the global anthropogenic CO2 emissions every year. However, supplementary cementitious materials (SCMs), such as fly ash, blast furnace slag, and natural pozzolans, can effectively reduce clinker demand and emissions (Juenger and Siddique, Reference Juenger and Siddique2015).
Today, SCMs are widely used in concrete and blended cements, or they are added separately during the mixing step. It is possible to partially substitute Portland cement with SCMs, such as granulated blast furnace slag (GFS), a by-product from iron production, or fly ash from coal combustion (Scrivener et al., Reference Scrivener, John and Gartner2018; Uliasz-Bocheńczyk and Mokrzycki, Reference Uliasz-Bocheńczyk and Mokrzycki2020; Suraneni et al., Reference Suraneni, Burris, Shearer and Hooton2021). The disadvantage is their low reactivity. The composition and production process of fly ash significantly influence the reactivity of the hydration process, which in turn affects the overall performance of the cement mixture (Sarcos et al., Reference Sarcos, Hart, Bornhöft and Deubener2020). Monitoring the hydration process is essential to ensure proper product quality. To achieve this, methods such as compressive and flexural strength testing, heat-flow measurements, ultrasonic testing, and X-ray diffraction with Rietveld refinement of the non-hydrated and hydrated cement phases can be employed. Cement consists of several crystalline mineral phases, including tricalcium silicate (C3S), dicalcium silicate (C2S), tricalcium aluminate (C3A), and calcium aluminate ferrite (C4AF). These phases react with water to form crystalline calcium hydroxide (portlandite), ettringite, and nanocrystalline calcium silicate hydrate (C-S-H). The addition of calcium sulfate is essential for controlling the setting time (Taylor, Reference Taylor1990) (see Figure 1).
Hydration mechanism of Portland cement.

The suggested nucleation path to C-S-H can be described in four steps according to Aretxabaleta et al. (Reference Aretxabaleta, López-Zorrilla, Etxebarria and Manzano2023). In the supersaturated solution, the primary species, Ca2+ and SiO₄2−, rapidly form Ca(OH)2–O–Si(OH)3 complexes. These complexes quickly combine to form C2S2H20 primary particles, which are highly dynamic and swiftly aggregate into larger clusters. Over time, these aggregates gradually undergo dehydration, leading to the formation of C4S4H2 structures with a tobermorite-like structure. Recent studies have identified clinotobermorite as the tobermorite family member most closely resembling the atomic structure of C-S-H. There is a general consensus that the C-S-H structure is similar to the tobermorite phase (Duque-Redondo et al., Reference Duque-Redondo, Bonnaud and Manzano2022). The formation of C-S-H is related to that of portlandite (Taylor, Reference Taylor1986).
The phase composition of the non-hydrated and hydrated mineral phases can be analyzed with X-ray diffraction and quantified by Rietveld refinement. The quantification of nanocrystalline phases is possible using an internal standard or spiking method (Vaupel, Reference Vaupel2001).
The reaction speed of cement phases can be accelerated by temperature (Lothenbach et al., Reference Lothenbach, Matschei, Möschner and Glasser2008b), seeding (John et al., Reference John, Epping and Stephan2019), various additives—such as soluble hydroxides (Taylor, Reference Taylor1990), silicates (Bortolotti et al., Reference Bortolotti, Fantazzini, Mongiorgi, Sauro and Zanna2012; Soin et al., Reference Soin, Catalan and Kinrade2013; Witzleben, Reference Witzleben2020), and soluble aluminum-based components (Taylor, Reference Taylor1990)—or mixing energy (Juenger and Siddique, Reference Juenger and Siddique2015; Ganjian et al., Reference Ganjian, Ehsani, Mason and Tyrer2018; Saleh et al., Reference Saleh, Salehi and Teodoriu2019; Aljumaily et al., Reference Aljumaily, Alshami, Ismael, Hameed, AlOmar, Hussain, hameed, Alsalhy and Alsaadi2022). Mixing energy could also be improved through ultrasonication, as demonstrated in additive manufacturing (Vaitkevičius et al., Reference Vaitkevičius, Šerelis and Kerševičius2018).
II. MATERIALS AND METHODS
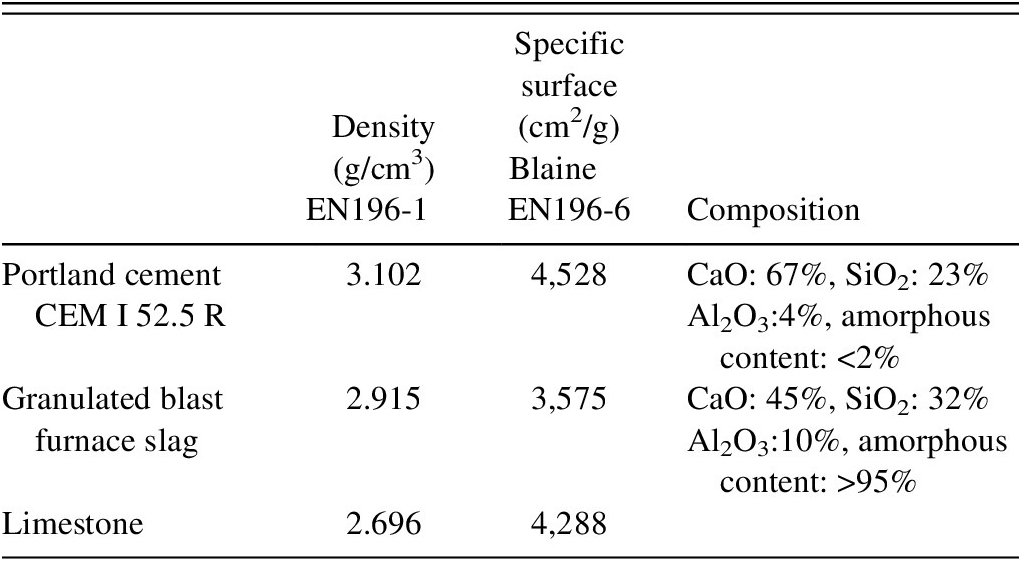
Ordinary Portland cement (OPC) conforming to the EN 197-1 standard, with the designation CEM I 52.5 R, was obtained from Portlandzementwerk Miebach Wittekind, Erwitte, Germany. Hydration studies were performed by mixing this cement with 20% granulated blast furnace slag (GFS) from Holcim, Bremen, Germany, and 10% limestone (Table I).
Raw materials

In this study, three different types of mixers were used for the mixing process. The first mixer was a standard model compliant with DIN EN 196, with the mixing procedure carried out according to the standard for a duration of 120 seconds. The second mixer used was the Ultra Turrax T50 (IKA GmbH, Staufen, Germany), equipped with a G45M attachment. This mixer offers a variable speed range from 3,000 to 10,000 rpm, and the experiments were conducted at 6,000 and 9,000 rpm for 120 seconds. The third mixer was the intensive mixer EL 5 (Eirich GmbH, Hardheim, Germany), which operates between 85 and 1,644 rpm. The mixing container moved in the opposite direction of the mixer at 1,644 rpm, and the mixing length was 120 seconds. Heat-flow measurements were performed using TAM Air (TA Instruments, New Castle, DE, USA). A water-to-cement ratio of 0.35 was used, following the procedure outlined in DIN EN 196. X-ray diffraction was measured using Oxford Supreme 8000. XRD measurements were performed using Bruker D2. Rietveld refinements were achieved using TOPAS 5.0 (Bruker AXS, Karlsruhe, Germany) with structural data and refinement range of C3S, C2S, C3A, C4AF, and calcium sulfate phases in the referenced literature (Plank and Jansen, Reference Plank and Jansen2011). In addition, the C-S-H phase clinotobermorite 2 M (ICDD 04-012-1762) was used for quantification (Kabekkodu, Dosen and Blanton, Reference Kabekkodu, Dosen and Blanton2024). During the refinement process, the lattice parameters a = 6.74 Å, b = 7.39 Å, c = 22.48 Å, and the crystal size of 9 nm were held constant. The lattice parameters were determined using a calibration process involving artificial mixtures of OPC and C-S-H, encompassing four distinct calibration levels. This calibration process yielded a regression coefficient of 0.986, indicative of a strong correlation. The refinement of the amorphous phases of GFS was performed using Quartz (ICDD 00-033-1161) with a = b = 4.913 Å and c = 5.405 Å. The particle size was fixed at 1 nm. The Refinement was validated using four calibration levels of mixtures with OPC and slag, which yielded a regression coefficient of 0.998, and by adding LaB6 (ICDD 00-034-0427) as an internal standard. The refinement was accepted when the weighted profile R values (R wp) were below 20 (see Figure 2).
Refinement of the hydrated cement phases.

The combined refinement of amorphous GFS and nanocrystalline tobermorite exhibits a cross-sensitivity of more than 30%. Therefore, the monitoring was performed using the sum of amorphous quartz and clinotobermorite (Tables II and III).
The chemical composition of CEM I 52.5 R according to X-ray diffraction

The phase composition of CEM I 52.5 R according to Rietveld

The compressive strength was determined using prisms, following the procedure outlined in DIN EN 196-1, with six replicates. The prisms were compacted and demolded after 24 hours, then stored in a water bath at 20 °C until measurement.
III. RESULTS AND DISCUSSION
Pure Portland cement had a compressive strength after 24 hours that was 25% higher than the investigated mixture of 70% Portland cement, 20% granulated furnace slag, and 10% limestone. The compressive strength of all samples was similar after 48 hours (see Figure 3).
Compressive strength (CS) in MPa after 24 and 48 hours depending on binder and mixer setup.

The Rietveld evaluation method provides a detailed analysis of the mineral phases involved in the hydration reaction. In the case of pure Portland cement, a typical acceleration period is observed during the initial 4 hours of the hydration process. Subsequently, the formation of nanocrystalline C-S-H and calcium hydroxide (portlandite) occurs. Following the acceleration period, the formation of C-S-H and portlandite, along with the consumption rate of tricalcium silicate, exhibits a notable increase compared with the initial period (see Figure 4).
Concentration of Tricalcium silicate, Portlandite, Calcite and the sum of the amorphous phasesQuartz and Tobermorinte (aQcT) during the hydration of ordinary Portland cement.

The hydration mechanism is a complex process. It involves the dissolution, nucleation, and various chemical reactions and physical changes that eventually result in the formation of the hydrated cement. The final hydration products (C-S-H, portlandite, ettringite, and others) are the result of a complex series of steps.
We focused in this study on the key components of the hydration process to compare the efficiency of various hydration reactions. OPC and the mixtures with SCMs exhibit different acceleration stages during the first 4 hours of hydration. Following the acceleration period, both the formation of C-S-H and portlandite and the rate of tricalcium silicate (C3S) consumption are significantly higher compared with the normal mixing procedure at the same time intervals for Ultra Turrax 6000 (see Figure 5), Ultra Turrax 9000 (see Figure 6), and Eirich Mixer (see Figure 7).
Concentration of Tricalcium silicate, Portlandite, Calcite and the sum of the amorphous phases Quartz and Tobermorinte (aQcT) during the hydration of Portland cement with SCM mixing with Ultra Turrax(UT) with 6000 rpm.

Concentration of Tricalcium silicate, Portlandite, Calcite and the sum of the amorphous phases Quartz and Tobermorinte (aQcT) during the hydration of Portland cement with SCM mixing with Ultra Turrax(UT) with 9000 rpm.

Concentration of Tricalcium silicate, Portlandite, Calcite and the sum of the amorphous phases Quartz and Tobermorinte (aQcT) during the hydration of Portland cement with SCM mixing with Eirich mixer.

The calcite content decreases during high-energy mixing. Here, we can observe that calcium carbonate takes part in the hydration process (Matschei et al., Reference Matschei, Lothenbach and Glasser2007; Lothenbach et al., Reference Lothenbach, Le Saout, Gallucci and Scrivener2008a). We observed the highest turnover of C3S during mixing with Ultra Turrax 9000.
It has been demonstrated that the heat of hydration increases during high-energy mixing compared with standard mixing procedures. In the event of Ultra Turrax mixing, the presence of a minor additional peak is indicative of additional reactions that lend further support to the hypothesis that carbonate and slag are involved in the hydration process (see Figure 8). It has been demonstrated that Eirich Mixer devices enhance the rate of heat flow at a subsequent stage.
Heatflow during hydration depending on binder and mixer type.

IV. CONCLUSION
The present study investigated the efficiency of high-energy mixing of OPC and its mixtures with 20 wt% amorphous blast furnace slag and 10 wt% limestone, monitoring the formation of cement phases in the process. Three distinct high-energy mixing methodologies were employed. The monitoring focused on the formation of portlandite and C-S-H phases, as well as the decline in tricalcium silicate during the initial 48 hours.
This study established that the compressive strength of pure Portland cement was approximately 25% higher than the mixture of 70% Portland cement, 20% slag, and 10% limestone after 24 hours. However, a comparative analysis of the samples revealed that they all exhibited a comparable compressive strength after 48 hours. The investigation also demonstrated that pure Portland cement exhibited a characteristic acceleration period during the initial 4 hours of hydration. In contrast, Portland cement mixed with slag and limestone through high-energy mixing demonstrated a distinct acceleration period during the first 4 hours of hydration, a behavior that contrasts with that of OPC. After the acceleration period, the formation of C-S-H and portlandite, along with the consumption of tricalcium silicate, exhibits a marked increase compared with the reaction speed at the same time for OPC. Furthermore, a decline in the calcite content was observed during high-energy mixing, suggesting the contribution of calcium carbonate to the enhancement of compressive strength within the first 48 hours.
FUNDING STATEMENT
The author gratefully acknowledges financial support from the Federal Ministry of Education and Research (Grant Nos. 13FH158IN6, 03FH005IN4, and 03FH015I3).