Introduction
The nutritional requirement of an amino acid (AA) is mainly determined changing only its own levels in the experimental diets, while other essential AA are maintained at adequate levels. However, metabolic interactions may occur between AA, and its simultaneous requirement's evaluation, associated with statistical methods that allow determining the optimum levels of more than one AA at the same time, may be an applicable technique to determine AA requirements.
Lysine (Lys) is generally used for protein accretion in the body (Baker, Reference Baker1997), and it is the most studied AA for this purpose. Furthermore, Lys is the first limiting AA in swine diets based on cereal grains and soybean meal (Lewis, Reference Lewis, Lewis and Southern2001; National Research Council – NRC, 2012), whereas tryptophan (Trp) is the third or fourth limiting AA in piglet diets, after Lys, Met and Thr (Jansman et al., Reference Jansman, van Diepen and Melchior2010).
In addition to its role in protein synthesis, Trp is also involved in many physiological functions as it is the precursor of neurotransmitters such as serotonin (5-HT), which is known to play an important role in regulating food intake and reducing stress. As a common point, Lys and Trp show synergism through the production of a common metabolite, which is α-ketoadipic acid (Augspurger and Baker, Reference Augspurger and Baker2007). As Lys may be used to produce α-ketoadipic acid, Trp can be saved and directed to other degradation pathways. Therefore, different levels of Lys and Trp in the same diet can promote different responses in pigs, providing differences in the requirement values of such AA. Additionally, Lys is the reference AA established in the ideal protein, and the other essential AA needs to be expressed as a ratio with it. Thus, it was aimed to simultaneously evaluate the standardized ileal digestible (SID) Trp and Lys levels for gilts from 15 to 30 kg of body weight (BW).
Material and methods
Location, animals, experimental design and diets
The experiment was carried out in the Fazenda Experimental de Iguatemi, at Universidade Estadual de Maringá (UEM) and in the Nutrition Laboratory of the Animal Science Department. Sixty-four individually housed gilts (Tybor × Topigs 20; 15.00 ± 1.44 kg) were allotted in a completely randomized block design with 16 treatments and four replicates per treatment. The treatments were arranged as a 4 × 4 factorial arrangement (four levels of SID Trp: 1.55, 1.85, 2.15 and 2.45 g/kg diet; four levels of SID Lys: 9.72, 11.12, 12.52 and 13.92 g/kg diet) which provided Trp:Lys ratio from 11.1 to 25.2:100. The lowest levels of SID Trp and Lys in the basal diet, which were 1.55 and 9.72 g/kg, respectively, were previously determined in a digestibility assay, with basal diet and batches of ingredients used to mix these diets similar to those used in our study (Pasquetti et al., Reference Pasquetti, Pozza, Moreira, Santos, Diaz-Huepa, Castilha, Perondi, Carvalho and Kim2015).
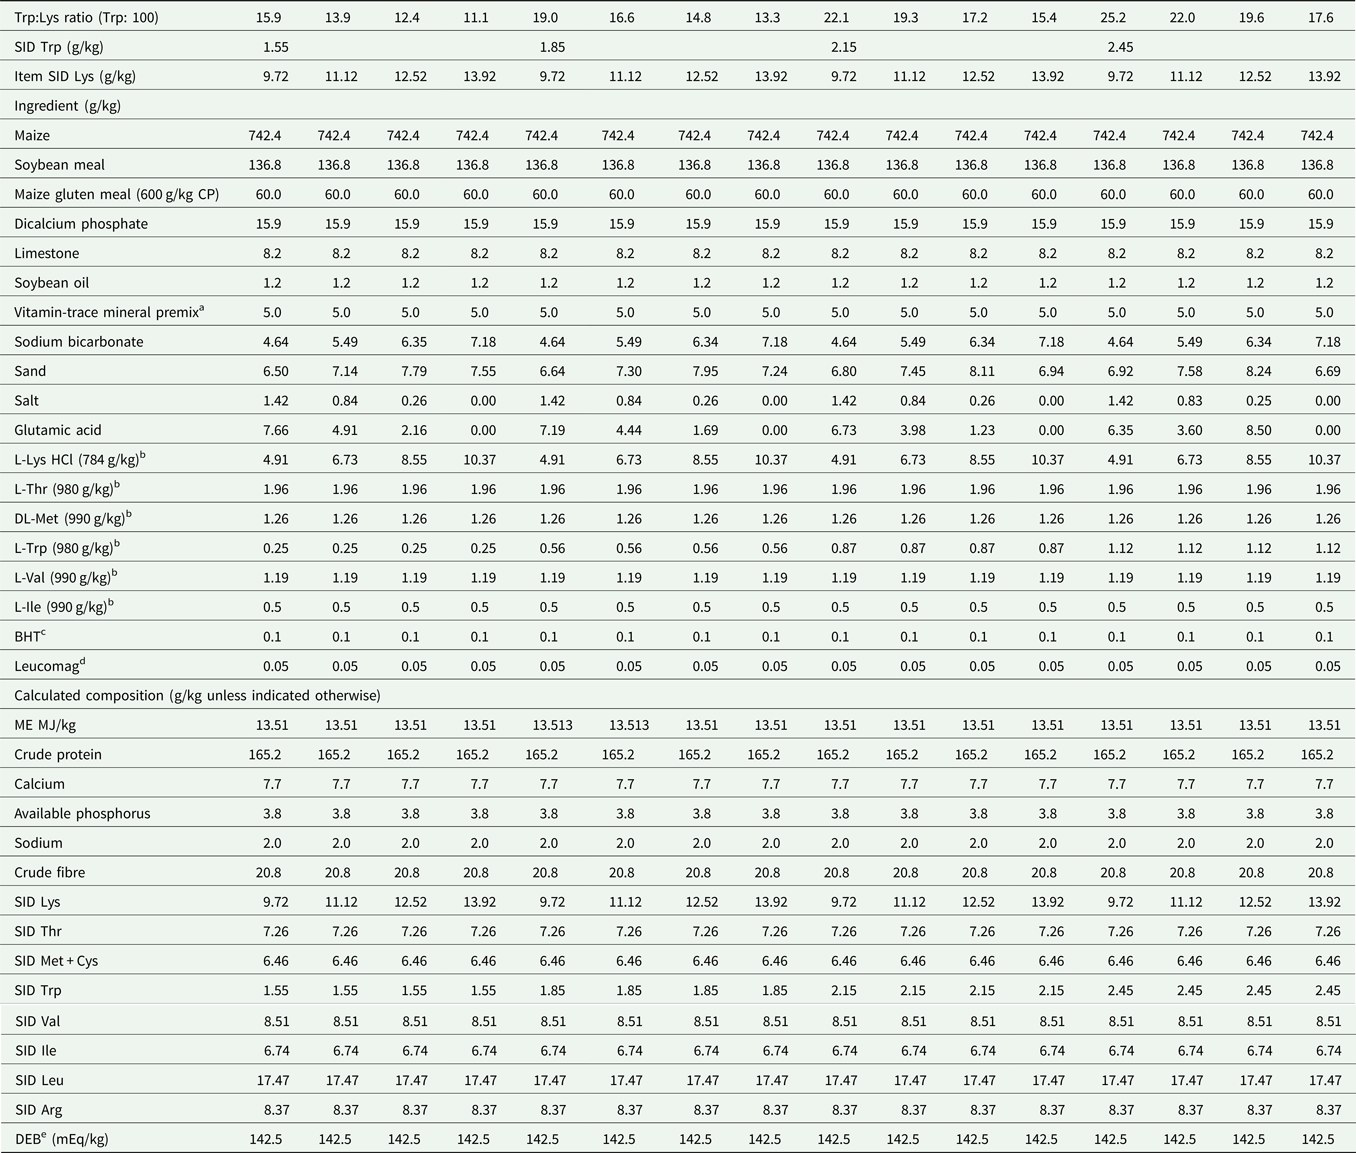
The crude protein content of the basal diet (165.2 g/kg diet) used in this study was reduced as compared to the 192.4 g/kg diet proposed by Rostagno et al. (Reference Rostagno, Donzele, Gomes, Oliveira, Lopes, Ferreira, Barreto and Euclides2011). The experimental diets were prepared by adding crystalline Trp and Lys at the expense of the inert material in the basal diet (Table 1). Glutamic acid was added in the experimental diets in order to keep the same nitrogen (N) content in all diets.
Composition of experimental diet
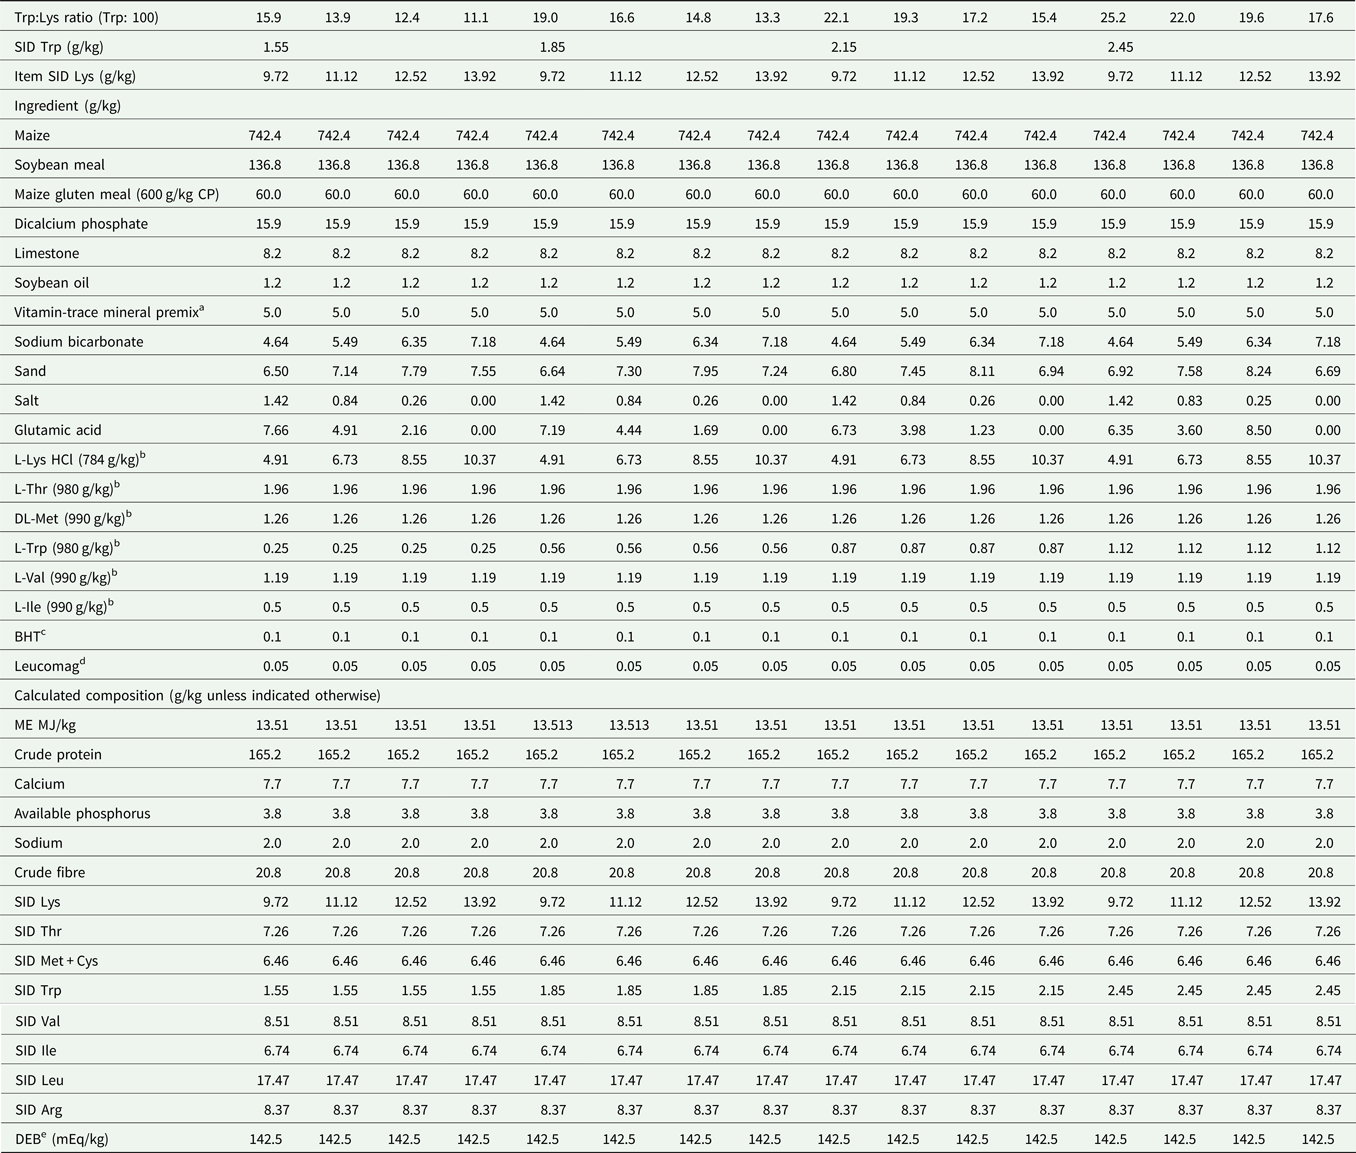
ME, metabolizable energy; SID, standardized ileal digestible; DEB, dietary electrolyte balance.
a Provided per kilogram of diet: vitamin A, 10 000 IU; vitamin D3, 2000 IU; vitamin E, 40 IU; vitamin K3, 3.12 mg; vitamin B1, 1.57 mg; vitamin B2, 4.0 mg; vitamin B6, 2.18 mg; vitamin B12, 23 μg; calcium pantothenate, 15.2 mg; niacin, 30.38 mg; folic acid, 0.3 mg; biotin, 0.12 mg; choline, 360 mg; Zn, 125 mg; Fe, 81 mg; Cu, 12 mg; Mn, 40.3 mg; I, 1.12 mg; Se, 0.32 mg; Co, 0.2 mg; and antioxidant, 5 mg.
b Purity of amino acids (g of amino acids per kg of product).
c Butylated hydroxytoluene.
d Ceva Animal Health, Paulínia, Brazil.
e Dietary electrolyte balance.
At the end of experimental period, feed intake and BW were recorded to calculate the average daily gain (ADG), average daily feed intake (ADFI) and gain-to-feed ratio (G:F). Ultrasound measurements were performed using an ultrasound equipment (Aloka® SSD 500). Previously, the P2 position, which is 6–7 cm away from the midline, had been located and shaved. Images were taken as well. Backfat thickness (BF) and longissimus muscle (LM) measurements were performed using a software (ImageJ; National Institute of Health, Bethesda, MD, USA).
Blood sample collection and processing
At the end of the study, after 6 h of fasting, 6 ml blood samples were obtained from the jugular vein and were kept in glass tubes containing heparin to analyse cholesterol, triglycerides, high-density lipoprotein (HDL), very-low-density lipoprotein, low-density lipoprotein (LDL), creatinine, total protein and plasma urea nitrogen (PUN) (Cai et al., Reference Cai, Zimmerman and Ewan1994). Plasmatic urea was multiplied by 0.467, which represents the amount of N in a urea molecule (Newman and Price, Reference Newman, Price, Burtis and Aswood1999). After sampling, the blood sample was centrifuged at 3000 g for 15 min at room temperature to separate the plasma, which was placed in propylene microtubes. Commercial kits (Gold Analisa Diagnostica Ltda., Belo Horizonte, MG, Brazil) were used to analyse the blood variables and the absorbance of the tests was measured using a spectrophotometer (BIOPLUS 2000; Bioplus, Barueri, SP, Brazil).
Statistical analysis
Initial weight was used as the covariate for all studied variables; treatments and blocks were considered in the model. Each pig was considered as one experimental unit for this experiment. The data were analysed using the Sistema de Análises Estatísticas e Genéticas – SAEG (Universidade Federal de Viçosa, Viçosa, MG, Brazil). All variables were evaluated using the response surface methodology. Additionally, when the response surface models were not fitted, orthogonal polynomial contrast coefficients were used to determine the linear and quadratic effects of increasing levels of SID Trp and Lys, wherein α = 0.05 was used as the critical level of probability. We used the β error and, consequently, the power (1–β) for the test of the interaction between Lys v. Trp to help elucidate the adequacy of the sample size of the experiment and to explain P values from 5 to 10% of significance for all variables. This procedure was performed using the ANOVA test Power of the R package (R Core Team, 2019).
Results
Performance, backfat thickness and longissimus muscle
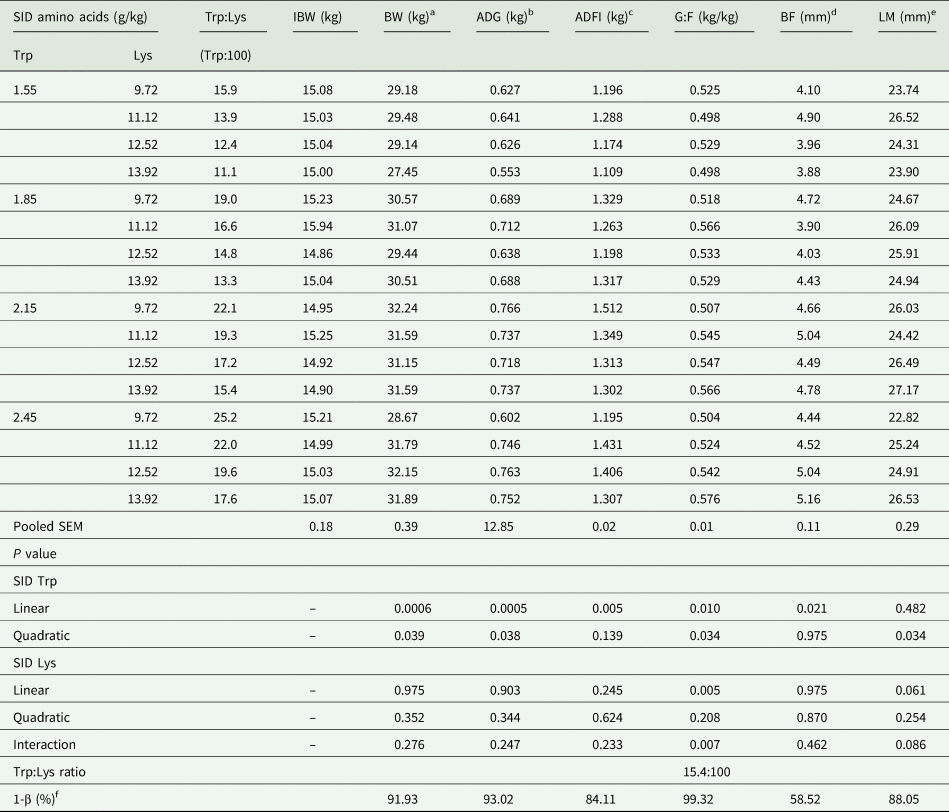
No interactions (P > 0.05) between SID Trp and Lys were observed on LM, BF and growth performance (Table 2), with the exception of G:F; however, individual effects of each AA were observed. Through polynomial regression analysis, a quadratic effect of SID Trp was observed (P = 0.039) on final BW (BW = 3.71508 + 24.6164 × Trp–5.45957 × Trp2, R 2 = 0.98) (P = 0.039) and on ADG (ADG = −0.548365 + 1.14001 × Trp−0.253944 × X 2; R 2 = 0.97) (P = 0.038), in which the optimum levels were estimated to be 2.25 g/kg (0.166 g/MJ of ME) and 2.24 g/kg (0.165 g/MJ of ME) of SID Trp, respectively. The ADFI linearly increased (P = 0.005) as SID Trp levels also increased in the diets (ADFI = 0.941471 + 0.175845 × Trp; R 2 = 0.75). Backfat thickness linearly increased (P = 0.021) according to increasing levels of SID Trp (BF = 3.02563 + 0.740625 × Trp; R 2 = 0.88). A quadratic effect of SID Trp (P = 0.034) and a linear effect of SID Lys (P = 0.061) were fitted for LM (LM = 4.10345 + 21.2179 × Trp–5.18096 × Trp2; R 2 = 0.89; LM = 22.31 + 0.247254 × Lys; R 2 = 0.63), wherein 2.05 g/kg of SID Trp was estimated as the better response.
Effect of different levels of standardized ileal digestible (SID) tryptophan (Trp) and lysine (Lys) on growth performance of gilts from 15 to 30 kg of body weight (BW)

IBW, initial body weight; FBW, body weight; ADG, average daily gain; ADFI, average daily feed intake; G:F, gain:feed; LM, longissimus muscle; BF, backfat thickness; SEM, standard error of the mean; SID, standardized ileal digestible
Equations:
a BW = 3.71508 + 24.6164 × Trp–5.45957 × Trp2, R 2 = 0.98.
b ADG = −0.548365 + 1.14001 × Trp–0.253944 × Trp2, R 2 = 0.97.
c ADFI = 0.941471 + 0.175845 × Trp, R 2 = 0.75.
d BF = 3.02563 + 0.740625 × Trp, R 2 = 0.88.
e LM = 4.10345 + 21.2179 × Trp–5.18096 × Trp2, R 2 = 0.89; LM = 22.31 + 0.247254 × Lys; R 2 = 0.63.
f Power of statistical test for the interaction considering alpha = 0.05.
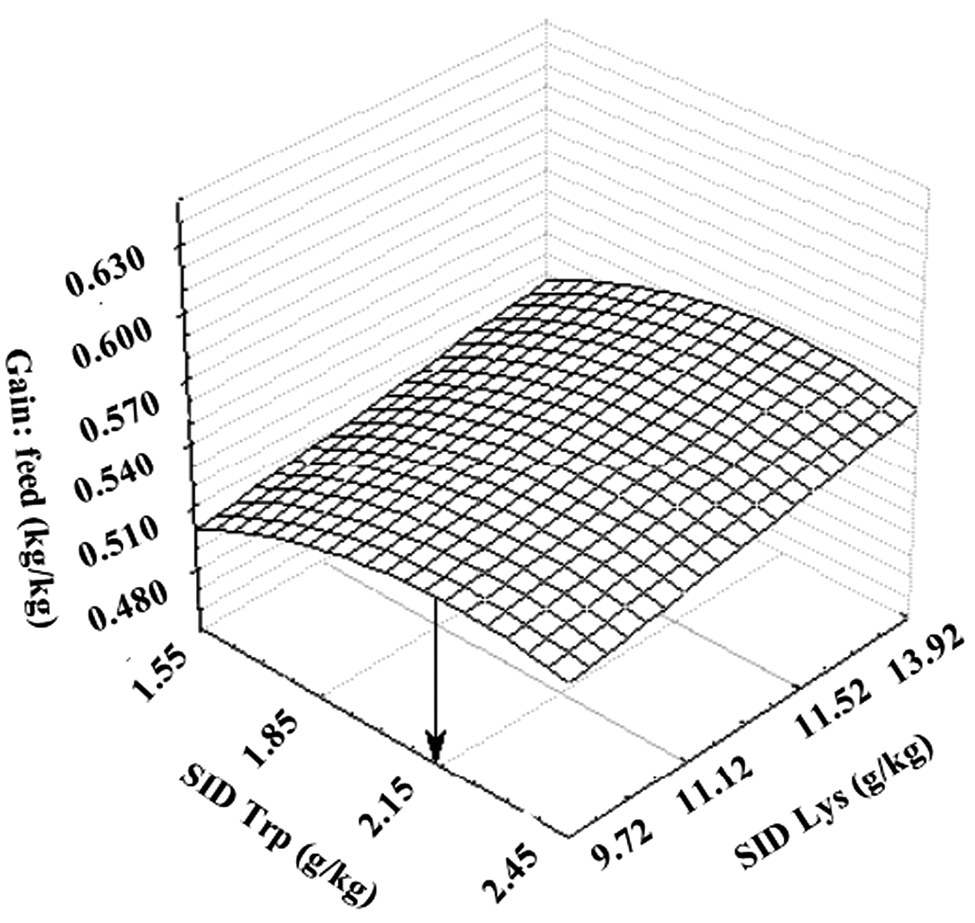
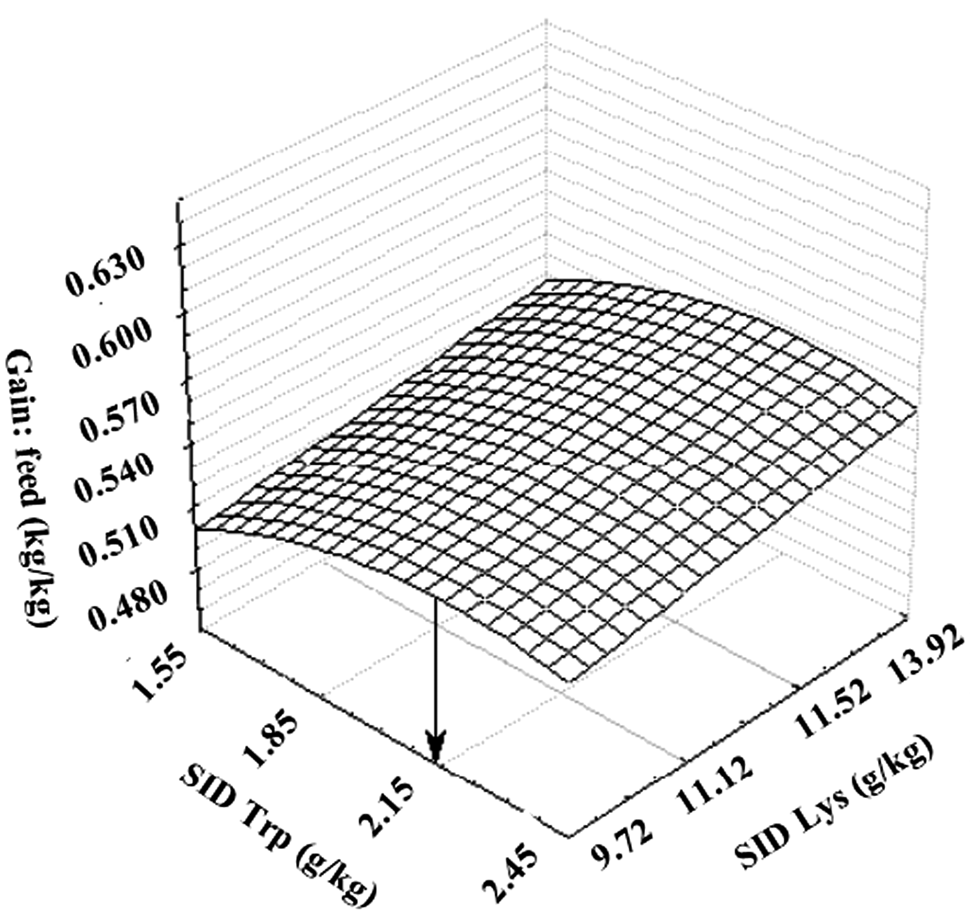
An interaction was observed (P = 0.007) for the G:F ratio (Table 2) and a response surface model was fitted (Fig. 1), represented by the equation G:F = 0.0924065 + 0.00660685 × Lys + 0.343928 × Trp–0.0794419 × Trp2 (R 2 = Trp: 0.99; Lys: 0.85). The optimum SID Trp level was achieved at 2.15 g/kg (0.159 g/MJ of ME). Considering this equation, gilts can improve by 9.25 g in G:F at each 1.4 g of SID Lys added per kg of diet. The fitted equation also shows that increasing dietary SID Lys levels provide a linear increase in G:F; the highest SID Lys level (13.92 g/kg) was the most effective considering the response surface fitted for G:F, providing a Trp:Lys ratio of 15.4:100.
The response surface for gain:feed for gilts (15–30 kg) feeding diets with different levels of standardized ileal digestible (SID) Trp and SID Lys. Gain:feed = 0.092406 + 0.006607 × Lys + 0.343928 × Trp–0.079442 × Trp2 (R 2 = Trp: 0.99; Lys: 0.85). Trp:Lys ratio: 15.4:100.
Blood plasma parameters
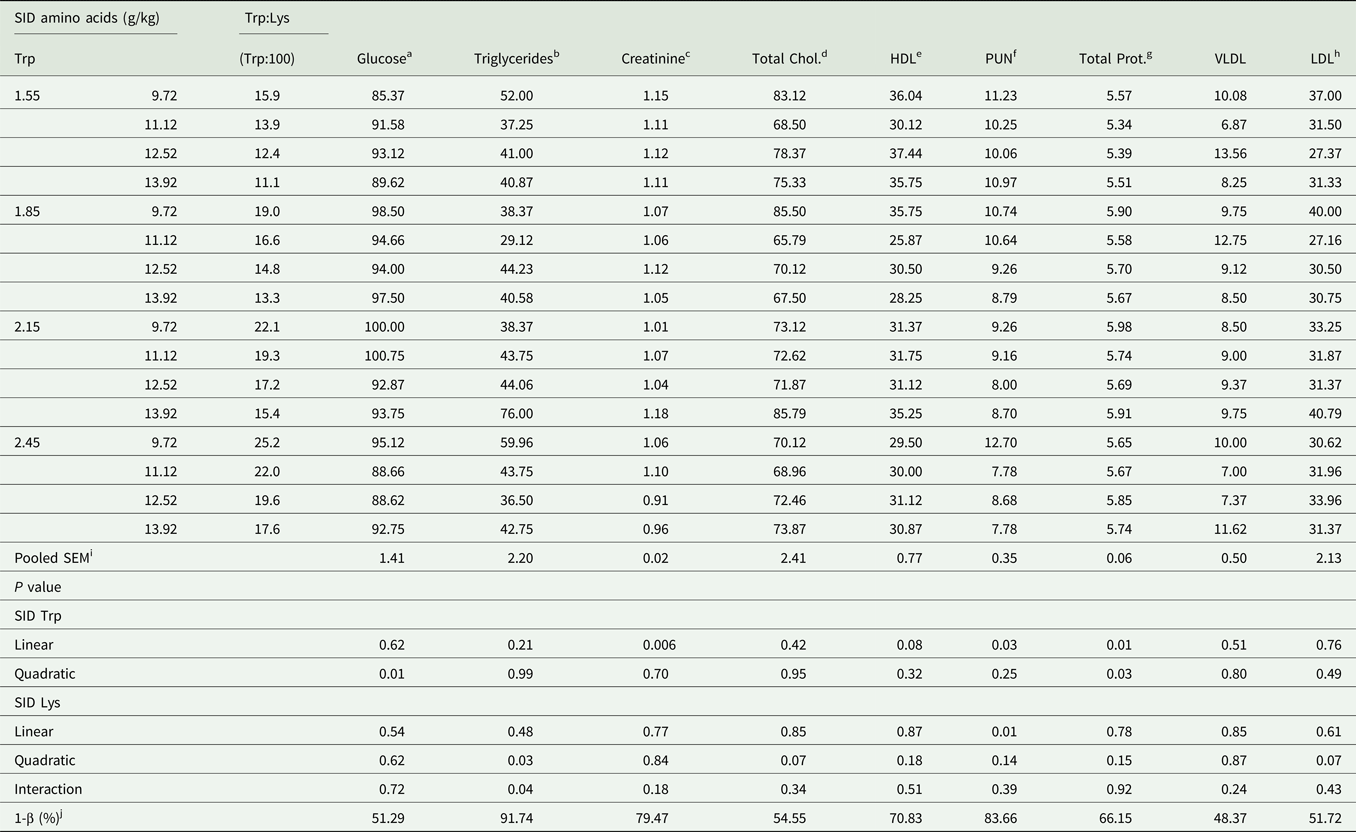
No interactions (P > 0.05) between SID Lys and SID Trp were observed for the blood plasma parameters (Table 3). A quadratic effect of SID Trp was observed on glucose (−36.9461 + 132.5980 × Trp–32.7519 × Trp2; R 2 = 1.0; P = 0.01) and total protein (1.0936 + 4.3906 × Trp–1.0190 × Trp2; R 2 = 1.00; P = 0.02), in which the higher concentrations were estimated at 2.02 and 2.15 g/kg of SID Trp, respectively. A quadratic effect of SID Lys was observed on triglycerides (Trig = 337.545–51.3649 × Trp + 2.20786 × Trp2; R 2 = 0.98; P = 0.026), total cholesterol (276.15–34.62 × Lys + 1.456 × Lys2; R 2 = 0.74; P = 0.07) and LDL (165.332–22.5135 × Lys + 0.937872 × Lys2; R 2 = 0.98; P = 0.07), in which the lower concentration was estimated at 11.63, 11.85 and 12.00 g/kg of SID Lys. Plasmatic creatinine levels linearly decreased (P = 0.006) as the levels of SID Trp increased (creatinine = 1.30586–0.116736 × Trp; R 2 = 0.89). Furthermore, the PUN level decreased (P = 0.03 Lys; P = 0.012 Trp) with increasing SID Lys and Trp levels in the diet (PUN = 14.8841–0.444762 × Lys, R 2 = 0.75; PUN = 13.1295–1.75125 × Trp, R 2 = 0.72). The HDL linearly decreased (HDL = 39.3268–3.7003 × Trp; R 2 = 0.42; P = 0.08) as the dietary SID Lys levels increased.
Effect of different levels of standardized ileal digestible (SID) tryptophan (Trp) and lysine (Lys) on blood variables (mg/dl) of gilts from 15 to 30 kg of body weight (BW)
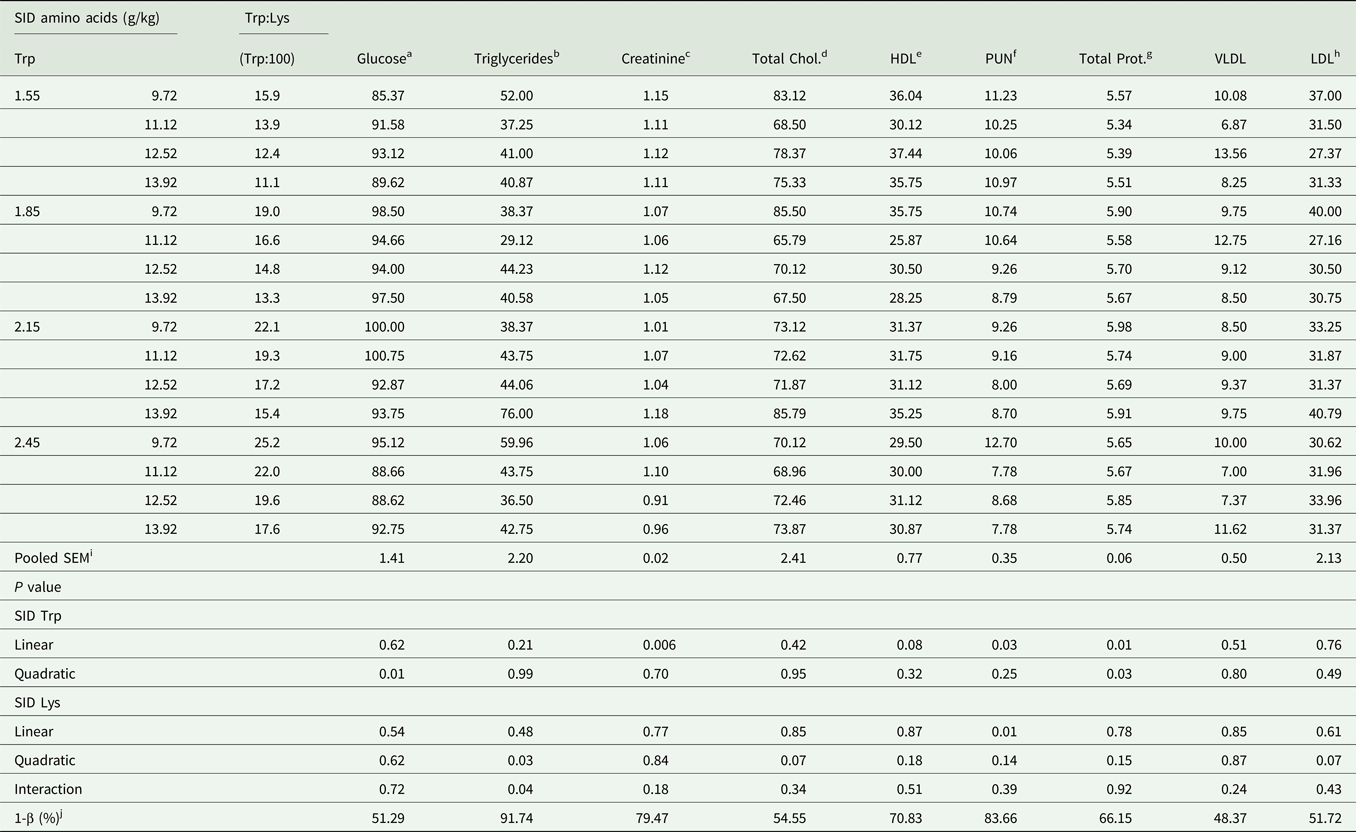
Chol., cholesterol; HDL, high-density lipoprotein; PUN, plasmatic urea nitrogen; VLDL, very-low-density lipoprotein; LDL, low-density lipoprotein.
a Glucose = −36.9461 + 132.598 × Trp–32.7519 × Trp2, R 2 = 1.0.
b Triglycerides = 337.545–51.33649 × Lys + 2.20786 × Lys2, R 2 = 0.98.
c Creatinine = 1.30586–0.116736 × Trp, R 2 = 0.89.
d Total Chol. = 276.15–34.62 × Lys + 1.456 × Lys2; R 2 = 0.74.
e HDL = 39.3268–3.7003 × Trp; R 2 = 0.42.
f PUN = 14.8841–0.444762 × Lys, R 2 = 0.75; PUN = 13.1295–1.75125 × Trp, R 2 = 0.72.
g Total protein: 1.0936 + 4.3906 × Trp–1.0190 × Trp2; R 2 = 1.00.
h LDL = 165.332–22.5135 × Lys + 0.937872 × Lys2; R 2 = 0.98.
i Standard error of the mean.
j Power of statistical test for the interaction considering alpha = 0.05.
Discussion
Performance, longissimus muscle and backfat thickness
Daily feed intake increased according to SID Trp in the diets. There is evidence that Trp regulates feed intake; however, the associated mechanisms are not well understood (Le Floc'h and Seve, Reference Le Floc'h and Seve2007). In the post-weaning period, Zhang et al. (Reference Zhang, Yin, Li, Zhou and Li2007) studied different inclusion levels (1.2, 1.9 and 2.6 g/kg) of Trp in the diet of piglets and observed that Trp increased feed intake and weight gain. Additionally, plasma levels of ghrelin increased in the gastric fundus and duodenum of swine upon the addition of Trp in the diet, which suggests that ghrelin levels are influenced by the Trp amount in the diet, which could regulate feed intake to meet the animal's nutritional requirements. Moreover, there is evidence that Trp increases the feed intake and improves the performance of piglets (Henry et al., Reference Henry, Sève, Colléaux, Ganier, Saligaut and Jégo1992; Eder et al., Reference Eder, Nonn, Kluge and Peganova2003; Ettle and Roth, Reference Ettle and Roth2013; Gonçalves et al., Reference Gonçalves, Nitikanchana, Tokach, Dritz, Bello, Goodband, Touchette, Usry, DeRouchey and Woodworth2015).
A quadratic effect of SID Trp was observed on FBW and ADG of the pigs, and the optimum levels were estimated to be 2.25 and 2.24 g/kg of the diet, respectively. Considering the optimum level obtained for ADG associated with the FI (1.335 kg/day, according to the equation for ADFI), the daily requirement of SID Trp was estimated at 2.99 g/day (2.25/13.51 MJ = 0.166 g of Trp per MJ of ME), may be due to the higher feed intake compared with NRC (2012) and Rostagno et al. (Reference Rostagno, Albino, Donzele, Gomes, de Oliveira, Lopes, Ferreira, Barreto and Euclides2017). In another study, improvements in the ADG of 6-week-old pigs were associated with increased Trp levels in the diet (Shen et al., Reference Shen, Voilqué, Kim, Odle and Kim2012). Jansman et al. (Reference Jansman, van Diepen and Melchior2010) observed an increase in feed intake and ADG of pigs from 9 to 24 kg BW from days 14 to 20 after starting the experiment, thus concluding that the ideal levels of SID Trp to optimize feed intake and ADG were 2.24 and 2.20 g/kg, respectively.
These values are higher than that proposed by the NRC (2012), suggesting 2.0 g/kg (1.8 g/day or 0.143 g/MJ of ME) for 11–25 kg pigs (barrows and gilts), but are close to 2.29 g/kg (2.19 g/day or 0.213 g/MJ of ME) proposed by Rostagno et al. (Reference Rostagno, Albino, Donzele, Gomes, de Oliveira, Lopes, Ferreira, Barreto and Euclides2017) for 15–30 kg gilts. Consequently, the proposed SID Trp:Lys ratios were 19:100 and 18:100, respectively. Apolônio et al. (Reference Apolônio, Donzele, Oliveira, Saraiva, Silva, Ferreira, Lima and Kill2011) determined the optimum SID Trp level for 15–30 kg pigs and found 1.75 g/kg (2.32 g/day) as the best dietary level, which corresponds to the SID Trp:Lys ratio of 18.82:100.
Our results show that the G:F ratio was linearly affected by dietary SID Trp and Lys levels, but the interaction between the AA demonstrate the simultaneous effect of these two AA, estimating 2.15 g/kg as the best SID Trp level. Rossoni et al. (Reference Rossoni, Donzele, Silva, Oliveira, Abreu, Santos, Kill and Carlos2009) observed a quadratic effect of digestible Lys levels on the G:F ratio for gilts (15–30 kg BW), estimating the Lys requirement to be 10.8 g/kg, which correspond to 11.60 g/day of Lys intake. The absence of a quadratic effect of SID Lys on the performance parameters does not allow to recommend a Lys optimum level, but the linear response suggests at least 13.92 g SID Lys/kg in the diet for maximum feed efficiency; the simultaneous effects of Trp and Lys in this study suggest a Trp:Lys ratio of 15.4:100.
Studies regarding the effects of SID Trp and Lys on LM and BF of gilts during the starting phase are scarce. It was observed that BF increased as the SID Trp levels increased in the diets. Salyer et al. (Reference Salyer, Tokach, DeRouchey, Dritz, Goodband and Nelssen2013) reported that BF increased and fat-free lean index decreased in finishing barrows and gilts receiving SID Trp in their diets. On the other hand, Pereira et al. (Reference Pereira, Donzele, Oliveira, Abreu, Silva and Martins2008) did not observe an effect of SID Trp (1.24–1.60 g/kg) on the BF and lean meat yield of finishing pigs (90–125 kg). Guzik et al. (Reference Guzik, Shelton, Southern, Kerr and Bidner2005) reported an increase in the BF of pigs (74–104 kg) as the level of SID Trp was increased (0.6–1.4 g/kg) in the diets. The highest fat deposition can be related to the lipogenic activity of Trp and may be associated with glucose plasma levels, as the highest concentration of glucose was observed at 2.02 g/kg SID Trp. The hypoglycaemic action of Trp and quinolinic acid has been attributed to the inhibition of gluconeogenesis by the enzyme phosphoenolpyruvate carboxykinase (Rosen and Nichol, Reference Rosen and Nichol1964; McDaniel et al., Reference McDaniel, Boshell and Reddy1973). Thus, some researchers have suggested that Trp enhances fatty acid synthesis as the result of activation of the lipogenic enzyme acetyl CoA carboxylase by citrate. The accumulation of this lipogenic enzyme depends on the intra-mitochondrial concentration of oxaloacetate, which increases with phosphoenolpyruvate carboxykinase inhibition (Miyazawa et al., Reference Miyazawa, Sakurai, Shindo, Imura and Hashimoto1975).
There is an inverse relationship between the rates of gluconeogenesis and lipogenesis (Young et al., Reference Young, Shrago and Lardy1964; Sellers et al., Reference Sellers, Bloxham, Munday and Akhtar1974; Reed and Tarver, Reference Reed and Tarver1975). Pharmacological doses of Trp have been associated with hypoglycaemia and hepatic gluconeogenesis inhibition (Gullino et al., Reference Gullino, Winitz, Birnbaum, Cornfield, Otey and Greenstein1955; Smith and Pogson, Reference Smith and Pogson1977). These effects were attributed to the formation and intracellular accumulation of quinolinolate and were supported by the correlation between the extensive reduction of glucose synthesis with the increase in quinolinolate accumulation (Miyazawa et al., Reference Miyazawa, Sakurai, Shindo, Imura and Hashimoto1975).
The increase in BF may also be associated with increased feed intake. It is known that Trp increases insulin secretion (Floyd et al., Reference Floyd, Fajans, Conn, Knopf and Rull1966; Ajdukiewicz et al., Reference Ajdukiewicz, Keane, Pearson, Read and Salmon1968; Ponter et al., Reference Ponter, Sève and Morgan1994), which may increase the activity of fatty acid synthetase (Lakshmanan et al., Reference Lakshmanan, Nepokroeff and Porter1972) and lipoprotein lipase (Wing et al., Reference Wing, Salaman and Robinson1966). According to Fears and Murrell (Reference Fears and Murrellt1980), the effects of Trp on insulin secretion show physiological relevance. Taylor (Reference Taylor1976) observed that Trp and 5-HT reduced the physical activities of mice. As a result, more energy is available for body fat accumulation, which is a process mediated by the enzymes fatty acid synthetase and lipoprotein lipase (Fears and Murrell, Reference Fears and Murrellt1980).
By considering LM, the optimal SID Trp level was estimated to be 2.05 g/kg. Haese et al. (Reference Haese, Donzele, Flávia, Oliveira, Lobão, Abreu, Carlos, Silva and Saraiva2006) and Guzik et al. (Reference Guzik, Matthews, Kerr, Bidner and Southern2006) did not observe differences in carcass traits when evaluating SID Trp levels of pigs from 60 to 95 kg and 106 to 111 kg, respectively. Arouca et al. (Reference Arouca, Fontes, Baião, Silva and Silva2007) found that Lys levels (5, 6, 7, 8 and 9 g/kg of total Lys) had no effect on BF in P1 and P2 position, LM, and lean meat and dressing percentages of barrows (95–122 kg). Moreover, Santos et al. (Reference Santos, Donzele, Silva, Oliveira, Abreu, Saraiva, Haese and Lima2011) observed quadratic and linear effects of SID Lys levels (5.4, 6.42, 7.44, 8.46 and 9.48 g/kg), which led to increased lean meat deposition in barrows (95–125 kg) along with the increase in the SID Lys levels in the diet. Similarly, in our study, a linear effect of Lys was observed on LM, which increased as Lys levels increased in the diets, suggesting that 13.92 g/kg of Lys provided the higher LM.
The absence of an adjusted second-degree model for SID Lys levels on performance, LM and BF may be related to the studied levels in our study, as a linear effect was observed for the G:F ratio. It is convenient to assure that using a higher range of Lys levels (above 13.92 g/kg) should provide an optimal response to estimate the optimum SID Lys level.
However, all of the aforementioned studies evaluated only one AA, Lys or Trp, and this study suggests that higher Trp levels may be associated with higher Lys levels. This response may lead to keeping the same SID Trp:Lys ratio, resulting in small changes, being controversy to the actual trend of a higher SID Trp:Lys ratio, considering that many studies evaluated only Trp levels. In this sense, further studies designed with large factorial arrangements are necessary to simultaneously evaluate two or more AA or nutrients in order to explore the relationship between them.
Blood parameters
The obtained values for plasma glucose and total protein of piglets were within the reference values presented by Friendship and Henry (Reference Friendship, Henry, Leman, Straw, D'Allaire, Mengeling and Taylor1992), in which the proposed values ranged from 63.0 to 133.2 and from 4.4 to 7.4 mg/dl, respectively; however, the obtained creatinine values were below the reference values (1.206–3.096 mg/dl).
A decrease in plasma creatinine concentration was noted due to the increase in SID Trp in the diet. Gómez-Carballar et al. (Reference Gómez-Carballar, Lara, Nieto and Aguilera2013) reported higher plasma creatinine levels in lactating sows compared to pregnant sows, thus indicating an increase in the muscle mobilization in lactating sows, since the creatinine results from the creatine degradation, which is a muscular component. Plasma creatinine was linearly related to N retention (Clowes et al., Reference Clowes, Kirkwood, Cegielski and Aherne2003). Thus, these results may also be associated with the values obtained for the PUN, which was decreased with the increase in SID Trp and Lys levels. This response indicates an adequate AA usage by the pigs, as AA excess implies an increasing PUN, which is related to deamination.
Additionally, it can be inferred that the decreases in plasma creatinine (reduced muscle catabolism) and PUN (increased nitrogen retention) were directly related to the increase in ADG and LM, depending on the SID Trp levels.
Conclusion
Using estimates provided by the response surface methodology, a maximized G:F ratio was obtained at 2.15 g SID Trp/kg of diet, and at least 13.92 g SID Lys/kg of diet is necessary to optimize the G:F for 15–30 kg gilts. The simultaneous effect of the two evaluated AA suggests a Trp:Lys ratio of 15.4:100. Our study also suggests that further studies designed with large factorial arrangements are necessary to simultaneously evaluate two or more AA or nutrients in order to explore the relationship between them.
Acknowledgements
The authors would like to thank the State University of Maringá for all infrastructure and staffs provided.
Financial support
The authors would like to thank the Conselho Nacional de Desenvolvimento Científico e Tecnológico (CNPq/Brasil) for the fellowship award and the Coordenação de Aperfeiçoamento de Pessoal de Nível Superior (CAPES/Brasil) for the scholarship.
Conflict of interest
None.
Ethical standards
The procedures used in the experiment were approved by the Animal Care and Use Committee (CEUA, Protocol no. 050/2011) of the State University of Maringá (UEM)/Brazil.