Implications
The results of the present study can be used as a guideline for the selection program of the herds that have a similar condition to Kivircik sheep. The estimates of genetic parameters (both direct and maternal effects) of some meat quality characteristics of the breed using a multi-trait animal model within Bayesian framework are novel. Skin+backfat thickness (SBFT) could be incorporated in breeding programs aiming to improve backfat thickness (BFT), particularly when the animals are young, and fat on eye muscle is hard to distinguish. The maternal effects were also found to be important, and should be accounted for in selection programs of Kivircik lambs.
Introduction
Raising sheep to meet human requirements, such as need for meat, milk, fiber, power, fuel, fertilizer or pleasure has been an issue for centuries (Rasali et al., Reference Rasali, Shrestha and Crow2006). Being one of the major sheep raising countries of the world, Turkey has a sheep population of about 31 million heads as of 2014, whereas there were about 40 million sheep in 1991 (Turkish Statistical Institute, 2014). Despite the decline in the number of sheep, the advancements in genetic composition and feeding practices have given rise to the meat and milk yield per sheep in the given period. For instance, about eight million sheep were slaughtered in 1991 yielding ~129 000 tons of meat resulting in 16.2 kg meat yield/animal, whereas from only about five million slaughtered animals ~99 000 tons of sheep meat were obtained, and the average yield per animal was 19 kg in 2014. The progress made in sheep raising is, however, not sufficient to compensate the decline in total sheep product as a result of the decrease in the number of sheep population.
In developing countries, the diet of people living in cities is usually characterized by a high intake of red meat, which is a major source of protein and fat. However, the quality and quantity of fat are important to consumers, and lamb meat in particular is considered to be fattier compared with other meats (Sañudo et al., Reference Sañudo, Alfonso, Sánchez, Delfa and Teixeira2000; Cemal et al., Reference Cemal, Karaca, Altin, Gokdal, Yilmaz and Yilmaz2007). Primary objective in many countries has been, therefore, the reduction of fat without compromised taste in order to improve the efficiency of commercial lamb meat production (Cemal et al., Reference Cemal, Karaca, Altin, Gokdal, Yilmaz and Yilmaz2007). Management and nutritional measures may influence carcass fatness, but genetic improvements offer a permanent and usually cost-effective means of matching carcass quality with consumer demand (Simm et al., Reference Simm, Lewis, Collins and Nieuwhof2001). This can be achieved by the selection of animals in terms of carcass characteristics.
Several methods have been developed to determine the composition and quality of lamb carcass. Ultrasonic scanning method is advantageous as it reduces the time and labor costs in addition to its high accuracy, and has been adapted in selection programs in many countries to improve carcass traits for lean meat production (Cemal et al., Reference Cemal, Karaca, Altin, Gokdal, Yilmaz and Yilmaz2007; Maxa et al., Reference Maxa, Norberg, Berg and Milerski2007). An important question that has to be addressed in a breeding program is the choice of the genotypes or breeds that could be improved by selection. In a recent study, it was shown that Kivircik lambs, which are raised mainly in the western Anatolian region of Turkey (Yarali et al., Reference Yarali, Yilmaz, Cemal, Karaca and Taskin2014), have a high quality of meat in terms of several meat quality characteristics (Ekiz et al., Reference Ekiz, Yilmaz, Ozcan, Kaptan, Hanoglu, Erdogan and Yalcintan2009). Knowledge of genetic variation and covariation among traits of interest is required for the design of effective sheep breeding programs, the accurate prediction of genetic progress from these programs and to obtain accurate breeding value estimates (Safari et al., Reference Safari, Fogarty and Gilmour2005).
An offspring’s genotype is composed of inherited genes from sire and dam with equal contribution from both sides. In mammalian species of livestock, dam’s ability to provide an environment for its offspring to grow, survive and adaptation in terms of nourishment has a significant impact on offspring’s phenotype (Mrode, Reference Mrode2014; David et al., Reference David, Bouvier, Banville, Canario, Flatres-Grall, Balmisse and Garreau2015). This is more apparent in sheep as the litter size varies greatly among individuals and a suckling period is crucial (Bradford, Reference Bradford1972). Hence, animal models, which ignore maternal effects, might result in upward bias in predicted response to selection due to the overestimation of direct heritability (Ghafouri-Kesbi and Baneh, Reference Ghafouri-Kesbi and Baneh2012). Several studies have reported the genetic parameter estimates in sheep with direct and maternal effects (Larsgard and Olesen, Reference Larsgard and Olesen1998; Maniatis and Pollott, Reference Maniatis and Pollott2002; Maxa et al., Reference Maxa, Norberg, Berg and Milerski2007; Kushwaha et al., Reference Kushwaha, Mandal, Arora, Kumar, Kumar and Notter2009; Gowane et al., Reference Gowane, Chopra, Prakash and Arora2010).
This study aims at estimation of genetic parameters for some meat quality characteristics of Kivircik lambs in Turkey using a multi-trait animal model and Bayesian method of estimation.
Material and methods
Data set
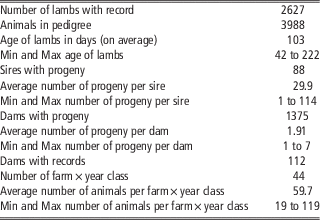
Certificate of Ethics Committee was received through the decision of Local Ethics Committee of Animal Testing in Adnan Menderes University numbered B.30.2.ADU.0.06.00.00/124-HEK/2008/034. Animal material of the present study consisted of 2627 Kivircik lambs raised in 15 private sheep farms. All performance and ultrasound scanning data were obtained in lambing seasons from 2011 to 2014 within the scope of TUBITAK-KAMAG 1007 project (Project No. 109G014). Controlled hand mating was applied in all farms to construct pedigree and all the pedigree data for lambs were checked by paternity testing with microsatellite markers. Details about the data structure are given in Table 1.
The characteristics of Kivircik lambs data set

Min=minimum value of observations; Max=maximum value of observations.
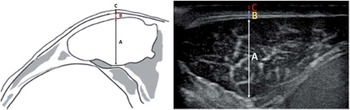
The lambs were monitored from the time of birth to the time of weaning (mean age of 3.5 months). Live weights (LW) of the lambs were determined using electronic scale with a sensitivity of 50 g in the time of marketing. Measurements on the characteristics of Musculus longissimus dorsi (MLD) were performed by an experienced operator in vivo using ultrasound device (Esaote MyLab™ Five, Esaote, Netherlands) with a 6 cm 7.5 MHz linear probe on the muscle area between the 12th and the 13th rib. The characteristics of MLD were determined to be BFT and muscle depth (MD) (Figure 1). Breeding programs differ in the ultrasound scanning day. Sensitivity and accuracy of ultrasonic measurements for fat depth increases with age of lambs. As the ultrasonic measurements were taken at a relatively early age (103±22 days), fat on eye muscle was hard to distinguish, and therefore, SBFT was also measured. Heritabilities and genetic correlations for BFT, SBFT, MD and LW were estimated.
Measured traits belonging to Musculus longissimus dorsi (MLD), and ultrasound imaging of MLD in lambs (A, muscle depth; B, backfat thickness; and C, skin+backfat thickness).

Statistical analysis
Model selection
Initially, a set of models was considered that differs in the random effects included in the model. Model 1 was a purely direct additive model, whereas Model 2 allowed for the inclusion of maternal genetic effects assuming 0 direct maternal genetic covariance. Model 3 was similar to Model 2 with the assumption of non-zero direct maternal genetic covariances. Maternal permanent environmental effects were incorporated into Model 4 in addition to direct genetic effects. Models 5 and 6 corresponded to Models 2 3, respectively, but also included maternal permanent environmental effects. These models can be summarized as follows:
 $$\eqalignno{ & {\rm Model 1\,\colon\,}\quad {\bf y}\,{\equals}\,{\bf Xb}{\plus}{\bf Z}_{d} {\bf d}{\plus}{\bf e} \cr & {\rm Model 2\,\colon\,}\quad {\bf y}\,{\equals}\,{\bf Xb}{\plus}{\bf Z}_{d} {\bf d}{\plus}{\bf Z}_{m} {\bf m}{\plus}{\bf e}\quad \quad {\rm cov}(d,m)\,{\equals}\,0 \cr & {\rm Model 3\,\colon\,}\quad {\bf y}\,{\equals}\,{\bf Xb}{\plus}{\bf Z}_{d} {\bf d}{\plus}{\bf Z}_{m} {\bf m}{\plus}{\bf e}\quad \quad {\rm cov}(d,m)\,{\equals}\,{\bf A}\sigma _{{dm}} \cr & {\rm Model 4\,\colon\,}\quad {\bf y}\,{\equals}\,{\bf Xb}{\plus}{\bf Z}_{d} {\bf d}{\plus}{\bf Z}_{c} {\bf c}{\plus}{\bf e} \cr & {\rm Model 5\,\colon\,}\quad {\bf y}\,{\equals}\,{\bf Xb}{\plus}{\bf Z}_{d} {\bf d}{\plus}{\bf Z}_{m} {\bf m}{\plus}{\bf Z}_{c} {\bf c}{\plus}{\bf e}\quad {\rm cov}(d,m)\,{\equals}\,0 \cr & {\rm Model 6\,\colon\,}\quad {\bf y}\,{\equals}\,{\bf Xb}{\plus}{\bf Z}_{d} {\bf d}{\plus}{\bf Z}_{m} {\bf m}{\plus}{\bf Z}_{c} {\bf c}{\plus}{\bf e}\quad {\rm cov}\left( {d,m} \right)\,{\equals}\,{\bf A}\sigma _{{dm}} $$
where y is the vector of observations for BFT, SBFT, MD and LW; b the vector of fixed effects that includes age at ultrasound scanning (days), sex, farm×year class (44 levels) and type of birth (three levels: singleton, twins, triplets); d the random vector of direct additive genetic effects; m the random vector of maternal additive genetic effects; c the random vector of maternal permanent environmental effects; and e the vector of random residuals. Accordingly, X, Z d , Z m , Z c are known incidence matrixes relating elements of y to elements of b, d, m and c, respectively. A was the numerator relationship matrix, and σ dm was the direct maternal genetic covariance (Mrode, Reference Mrode2014).
In Model 6, the vector of random direct and maternal additive genetic effects, a, was assumed to follow a multivariate normal distribution (MVN):
 $$\left. {\bf a} \right|{\bf G}\,\sim\,{\rm MVN}({\bf 0},{\bf G}\,\otimes\,{\bf A})$$
where 0 denotes a vector of 0s with length equal to the sum of number of additive effects and number of females; and G the 8×8 covariance matrix. Following prior distributions were assumed for the other random effects in the model:
 $$\eqalignno{ & \left. {\bf c} \right|{\bf P}_{{\mib{m}} } \,\sim\,{\rm MVN}({\bf 0},{\bf P}_{{\mib{m}} } \,\otimes\,{\bf I}_{c} ) \cr & \left. {\bf e} \right|{\bf R}\,\sim\,{\rm MVN}({\bf 0},{\bf R}\,\otimes\,{\bf I}_{n} ) $$
where P m is the covariance matrix of random maternal permanent environmental effects; R the covariance matrix of random residual effects; and I c and I n the identity matrices with the orders of the number of dams and animals, respectively. The estimation process within a hierarchical Bayesian context requires the specification of prior distributions for G, P m and R, and an inverted Wishart (IW) distribution is used as it has the property of conjugacy that allows researchers to sample from known distributions through sampling algorithms such as Gibbs sampling. Thus, we assumed IW distributions for each of the covariance matrices
 $$\eqalignno{ & \left. {\bf G} \right|v_{a} ,{\bf V}_{a} \,\sim\,{\rm IW}(v_{a} ,{\bf V}_{a} ) \cr & \left. {{\bf P}_{m} } \right|v_{p} ,{\bf V}_{p} \,\sim\,{\rm IW}(v_{p} ,{\bf V}_{p} ) \cr & \left. {\bf R} \right|v_{r} ,{\bf V}_{r} \,\sim\,{\rm IW}(v_{r} ,{\bf V}_{r} ) $$
where v i and V i (i=a, p, r) are the parameters for the prior distributions (Waldmann and Ericsson, Reference Waldmann and Ericsson2006).
All models were fitted using the MCMCglmm package (Hadfield, Reference Hadfield2010) of R environment (R Development Core Team, 2014). We used the default prior in MCMCglmm for fixed effects, which is a normal distribution with null mean and a large variance (1e+10). For the random effects, we set the scale parameters of IW distributions to I, and degree of belief parameters to 1.002, which induces a marginal prior distribution on the corresponding variances that is equivalent to an inverse gamma distribution with shape and scale parameters equal to 0.001 as frequently used in Bayesian univariate analysis. A single chain of length 50 000 was run, and after discarding the first 5000 as burn-in and saving every 100th sample, 450 samples were stored for each parameter. To evaluate the predictive performances of Models 1 to 6, the deviance information criterion (DIC) provided by the MCMCglmm package (Hadfield, Reference Hadfield2010) was used. A difference greater than 7 units was accepted as strong evidence in favor of the model with the smaller (or more negative) DIC value (Spiegelhalter et al., Reference Spiegelhalter, Best, Carlin and van der Linde2002).
Genetic parameters
Direct and maternal heritabilities for each of four traits (denoted with subscript i) were estimated from the posterior means of diagonal elements of corresponding covariance matrices by
 $$h_{{d_{i} }}^{2} {\equals}\,\sigma _{{d_{i} }}^{2} /\sigma _{{p_{i} }}^{2} $$
and
 $$h_{{m_{i} }}^{2} {\equals}\,\sigma _{{m_{i} }}^{2} /\sigma _{{p_{i} }}^{2} $$
, respectively, where
 $$\sigma _{{d_{i} }}^{2} $$
is the direct additive genetic variance;
 $$\sigma _{{m_{i} }}^{2} $$
the maternal additive genetic variance; and
 $$\sigma _{{p_{i} }}^{2} $$
the phenotypic variance. Similarly, direct and maternal genetic correlations were estimated with
 $$r_{{d_{{i,i'}} }} {\equals}\,\sigma _{{d_{{i,i'}} }} /\sigma _{{d_{i} }} \sigma _{{d_{{i'}} }} $$
and
 $$r_{{m_{{i,i^{'} }} }} {\equals}\,\sigma _{{m_{{i,i^{'} }} }} /\sigma _{{m_{i} }} \sigma _{{m_{{i'}} }} $$
, respectively, where i and
 $${i'}$$
are the traits of interest
 $$\left( {i\,\ne\,i'} \right)$$
, and
 $$\sigma _{{d_{{i,i^{'} }} }} $$
and
 $$\sigma _{{m_{{i,i^{'} }} }} $$
are the direct and maternal genetic covariances between these traits. Furthermore, genetic correlation between direct and maternal effects were estimated with
 $$r_{{dm_{i} }} \,{\equals}\,\sigma _{{dm_{i} }} \,/\,\sigma _{{d_{i} }} \sigma _{{m_{i} }} $$
. Ratio of maternal permanent environmental variance to phenotypic variance was also computed for all traits from the posterior means of corresponding variance components by
 $$c_{i}^{2} \,{\equals}\,\sigma _{{c_{i} }}^{2} \,/\,\sigma _{{p_{i} }}^{2} $$
, where
 $$\sigma _{{c_{i} }}^{2} $$
is the maternal permanent environmental variance for trait i. Total heritabilities for the traits were calculated according to Willham (Reference Willham1972):
 $$h_{{t_{i} }}^{2} \,{\equals}\,{{\sigma _{{d_{i} }}^{2} {\plus}0.5\sigma _{{m_{i} }}^{2} {\plus}1.5\sigma _{{dm_{i} }} } \over {\sigma _{{p_{i} }}^{2} }}$$
Results
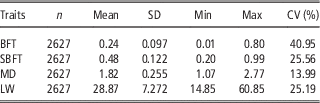
Descriptive statistics for the studied traits are given in Table 2. Overall means for BFT, SBFT, MD and LW were 0.24 cm, 0.48 cm, 1.82 cm and 28.87 kg, respectively. Based on DIC values the Model 6 was the most appropriate model to describe the random effects might affect the traits studied. This indicates that a model including direct and maternal additive genetic effects as well as the covariances among these effects, and maternal permanent environmental effects can therefore predict the genetic parameters more precisely than other competitive models. Thus, we proceeded further with Model 6, and run the model with a single chain of length 250 000, setting the first 25 000 as burn-in and saving every 100th sample. This resulted in 2250 posterior samples for each parameter to be used for genetic parameter estimation, which formed the results presented in this study (Tables 3–5).
Descriptive statistics for ultrasound scanning traits and live weights of Kivircik lambs

Min=minimum value of observations; Max=maximum value of observations; BFT=backfat thickness (cm); SBFT=skin+backfat thickness (cm); MD=muscle depth (cm); LW=live weight at the day of ultrasonic measurement (kg).
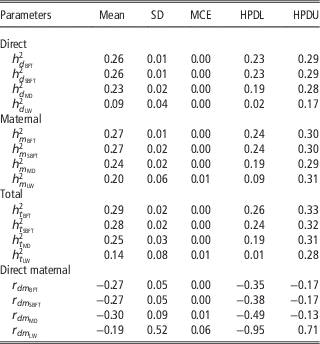
Posterior summary statistics of direct, maternal and total heritabilities with genetic correlations between direct and maternal effects for ultrasound scanning traits and live weights of Kivircik lambs

MCE=Monte Carlo error; HPDL=lower value of highest posterior density; HPDU=upper value of highest posterior density;
 $$h_{{d_{i} }}^{2} $$
,
 $$h_{{m_{i} }}^{2} $$
,
 $$h_{{t_{i} }}^{2} $$
and
 $$r_{{dm_{i} }} $$
(for i denoting the traits BFT, SBFT, MD and LW)=direct, maternal and total heritabilities, and genetic correlation between direct and maternal effects, respectively; BFT=backfat thickness; SBFT=skin+backfat thickness; MD=muscle depth; LW=live weight at the day of ultrasonic measurement.
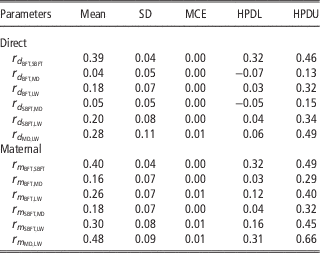
Posterior summary statistics of direct and maternal genetic correlations for ultrasound scanning traits and live weights of Kivircik lambs

MCE=Monte Carlo error; HPDL=lower value of highest posterior density; HPDU=upper value of highest posterior density;
 $$r_{{d_{{i,i'}} }} $$
and
 $$r_{{m_{{i,i'}} }} $$
(for i denoting the traits BFT, SBFT, MD and LW, and
 $$i\,\ne\,i'$$
)=direct and maternal genetic correlations among the traits, respectively; BFT=backfat thickness; SBFT=skin+backfat thickness; MD=muscle depth; LW=live weight at the day of ultrasonic measurement.
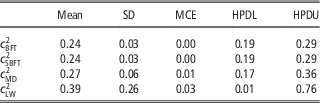
Posterior summary statistics for the ratios of maternal permanent environmental variance to phenotypic variance for ultrasound scanning traits and live weights of Kivircik lambs

MCE=Monte Carlo error; HPDL=lower value of highest posterior density; HPDU=upper value of highest posterior density;
 $$c_{i}^{2} $$
(for i denoting the traits BFT, SBFT, MD and LW)=ratio of maternal permanent environmental variance to phenotypic variance,
 $$\sigma _{{c_{i} }}^{2} \,/\,\sigma _{{p_{i} }}^{2} $$
; BFT=backfat thickness; SBFT=skin+backfat thickness; MD=muscle depth; LW=live weight at the day of ultrasonic measurement.
Summary statistics of the posterior distributions of heritabilities for BFT, SBFT, MD and LW are given in Table 3. The posterior distributions of direct heritabilities, for BFT, SBFT and MD revealed that these traits are moderately heritable, whereas LW is a low heritable trait. The posterior means of maternal heritabilities were higher than the posterior means of their corresponding direct heritabilities, and indicate a moderate degree of heritability for all traits. Posterior means of total heritabilities,
 $$h_{t}^{2} $$
, were slightly higher than their corresponding direct and maternal heritability estimates, except for LW, whose
 $$h_{m}^{2} $$
estimate was about 0.5 times higher than its
 $$h_{t}^{2} $$
estimate.
Correlations were considered significant when estimates of 95% highest posterior density intervals were not overlapped with 0. The genetic correlations between direct and maternal effects, r dm , were found to be significant, except LW (Table 3). Table 4 shows the estimates of direct and maternal genetic correlations among the traits of interest. Significant positive direct and maternal genetic correlations exist among the traits, except the direct genetic correlations for BFT–MD and SBFT–MD pairs. Posterior means of direct and maternal genetic correlations between BFT and SBFT were moderate. Direct genetic correlations for BFT–LW and SBFT–LW pairs were low to moderate, while the maternal genetic correlations were moderate (Table 4). The direct and maternal estimates of genetic correlations between MD and LW were moderate. Mean values of the posterior distributions of c 2 for BFT, SBFT, MD and LW were given in Table 5.
Discussion
The mean of BFT measurements is within the range of values reported by various researchers (Cemal et al., Reference Cemal, Karaca, Altin, Gokdal, Yilmaz and Yilmaz2007; Theriault et al., Reference Theriault, Pomar and Castonguay2009; Slosarz et al., Reference Slosarz, Stanisz, Boniecki, Przybylak, Lisiak and Ludwiczak2011; Esquivelzeta et al., Reference Esquivelzeta, Casellas, Fina and Piedrafita2012; Santos et al., Reference Santos, Neto, Sarmento, Bezerra, Oliveira, dos Santos, Neto and Biagiotti2014). Similar results were reported for SBFT in other breeds (Karya, Karacabey Merino and Kivircik) reared in Turkey (Cemal et al., Reference Cemal, Karaca, Altin, Gokdal, Yilmaz and Yilmaz2007; Yilmaz et al., Reference Yilmaz, Sezenler, Alarslan, Ata, Karaca and Cemal2014). Mean of MD in this study was lower than the mean values reported in some meat-type breeds (Theriault et al., Reference Theriault, Pomar and Castonguay2009; Slosarz et al., Reference Slosarz, Stanisz, Boniecki, Przybylak, Lisiak and Ludwiczak2011). This was most probably due to the fact that measurements were taken at a relatively early age as part of our breeding program compared with other breeding programs. The mean of LW measurements was within the range of values listed in the comprehensive review of Safari et al. (Reference Safari, Fogarty and Gilmour2005) for meat-type breeds.
In agreement with our finding (0.26), Maximini et al. (Reference Maximini, Brown, Baumung and Fuerst-Waltl2012) reported a
 $$h_{d}^{2} $$
of 0.29 for BFT in Austrian meat lambs at, on average, 105 days of age. On the other hand,
 $$h_{d}^{2} $$
and
 $$h_{m}^{2} $$
for BFT at weaning were found to be 0.05 and 0.04 by Larsgard and Olesen (Reference Larsgard and Olesen1998) (144 days of age), 0.19 and 0.05 by Maniatis and Pollott (Reference Maniatis and Pollott2002) (5-month age) and 0.08 and 0.03 by Maxa et al. (Reference Maxa, Norberg, Berg and Milerski2007) (100 days of age), respectively. Our results were well in line with the published results for direct heritability (0.23) of MD, whereas the estimated maternal heritability (0.24) of this study was much higher than estimates given in the literature. Roden et al. (Reference Roden, Merrell, Murray and Haresign2003) reported moderate estimates of
 $$h_{d}^{2} $$
for MD (0.26 to 0.28) for lambs with an average of 171 days of age. Based on the measurements taken at 100 days of age, Maxa et al. (Reference Maxa, Norberg, Berg and Milerski2007) reported the
 $$h_{d}^{2} $$
and
 $$h_{m}^{2} $$
of MD to be 0.16 and 0.04. Maximini et al. (Reference Maximini, Brown, Baumung and Fuerst-Waltl2012), reported a
 $$h_{d}^{2} $$
of 0.28 for MD in Austrian meat lambs at 105 days of age. In a recent study, Mortimer et al. (Reference Mortimer, Swan, Brown and van der Werf2014) estimated the
 $$h_{d}^{2} $$
of MD to be 0.19 to 0.25 for lambs at, on average, 185 days of age. Larsgard and Olesen (Reference Larsgard and Olesen1998) reported
 $$h_{d}^{2} $$
and
 $$h_{m}^{2} $$
of MD to be 0.05 and 0.08 for pre-weaning (47 days of age) and 0.32 and 0.05 for weaning (144 days of age), respectively. Maniatis and Pollott (Reference Maniatis and Pollott2002) estimated the
 $$h_{d}^{2} $$
of MD to be as low as 0.09, where the measurements were taken at 5 months of age. On the other hand, Puntila et al. (Reference Puntila, Maki and Rintala2002) estimated the direct heritability for MD to be high as 0.46 for lambs at about 120 days of age.
Direct heritability for LW was low with an estimate of 0.09, whereas maternal heritability was moderate (0.20). The ranges of published estimates for
 $$h_{d}^{2} $$
and
 $$h_{m}^{2} $$
of LW are wide, partially depending mainly on the day of measurements taken. This is due to the fact that LW measurements taken at an age close to animal’s birth is under influence of dam; however, with increasing age, animal becomes more self-reliant, and
 $$h_{d}^{2} $$
becomes more pronounced. Larsgard and Olesen (Reference Larsgard and Olesen1998) reported a slight decline in
 $$h_{d}^{2} $$
of LW with age. Their estimates were 0.22, 0.20 and 0.12 for birth weight, pre-weaning weight and weaning weight, respectively. Similarly, Roden et al. (Reference Roden, Merrell, Murray and Haresign2003) estimated the direct heritabilities for birth weight, 4-week weight and weaning weight to be 0.22 to 0.23, 0.18 to 0.21 and 0.17 for varying models and analysis (univariate or bivariate), respectively. Puntila et al. (Reference Puntila, Maki and Rintala2002) estimated the direct heritability for LW at scanning day (120 days of age) to be 0.44. Szwaczkowski et al. (Reference Szwaczkowski, Wojtowski, Stanislawska and Gut2006) estimated
 $$h_{d}^{2} $$
and
 $$h_{m}^{2} $$
of LW to be 0.26 and 0.27, whereas Maxa et al. (Reference Maxa, Norberg, Berg and Milerski2007) estimated these parameters to be 0.17 and 0.08, respectively. In Karacabey Merino, a cross of German Mutton Merino and Kivircik sheep, Koyuncu and Duru (Reference Koyuncu and Duru2009) estimated the direct and maternal heritabilities of LW at birth to be 0.08 and 0.05, respectively. Ghafouri-Kesbi and Baneh (Reference Ghafouri-Kesbi and Baneh2012) reported
 $$h_{d}^{2} $$
and
 $$h_{m}^{2} $$
estimates from four measurements of LW: birth weight, weaning weight (100 days of age), 6-month weight and 9-month weight. Direct estimates for these traits obtained by the authors were 0.32, 0.21, 0.22 and 0.28, respectively, whereas maternal heritabilities for weaning weight and 6-month weight were 0.08 and 0.05, respectively (Ghafouri-Kesbi and Baneh, Reference Ghafouri-Kesbi and Baneh2012). Maximini et al. (Reference Maximini, Brown, Baumung and Fuerst-Waltl2012) estimated the
 $$h_{d}^{2} $$
and
 $$h_{m}^{2} $$
of LW to be 0.07 and 0.05, respectively. Tamioso et al. (Reference Tamioso, Filho, Dias and de Almeida Teixeira2013) reported the estimates
 $$h_{d}^{2} $$
and
 $$h_{m}^{2} $$
of LW to be 0.06 and 0.17, and 0.08 and 0.05 for birth weight and weaning weights, respectively. Mortimer et al. (Reference Mortimer, Swan, Brown and van der Werf2014) estimated the direct heritability of LW to be 0.17 and 0.21 from univariate and multivariate analysis, respectively. Table 3 indicates that phenotypic response to selection predicted based on
 $$h_{t}^{2} $$
would be slightly higher than that of
 $$h_{d}^{2} $$
.
The estimated genetic correlations between the traits of interest were lower than the estimates given earlier by various researchers (Puntila et al., Reference Puntila, Maki and Rintala2002; Jones et al., Reference Jones, Lewis, Young and Simm2004; Maxa et al., Reference Maxa, Norberg, Berg and Milerski2007; Mortimer et al., Reference Mortimer, Swan, Brown and van der Werf2014). Puntila et al. (Reference Puntila, Maki and Rintala2002) obtained the direct genetic correlations for BFT–MD, BFT–LW and MD–LW pairs, and reported the estimates of 0.49, 0.50 and 0.54, respectively. Mortimer et al. (Reference Mortimer, Swan, Brown and van der Werf2014) reported the direct genetic correlation for BFT–LW pair to be 0.52. In contrary, Jones et al. (Reference Jones, Lewis, Young and Simm2004) obtained an estimate of 0.23 for the direct genetic correlation between BFT and MD. Maxa et al. (Reference Maxa, Norberg, Berg and Milerski2007) have reported estimates that do not significantly differ from 0 for the direct and maternal genetic correlations between BFT and LW, and also were not be able to estimate the direct and maternal genetic correlations between BFT and MD as their model failed to converge.
The negative genetic correlation between direct and maternal effects indicates the existence of an antagonism between the two effects for all traits, however, it was shown that its value has a negligible effect on genetic evaluation of individuals (David et al., Reference David, Bouvier, Banville, Canario, Flatres-Grall, Balmisse and Garreau2015). In a study that aims to examine the effect of data structure on genetic (co)variance components of early growth in sheep, Maniatis and Pollott (Reference Maniatis and Pollott2003) showed that an increase in the number of progeny per dam as well as the proportion of dams with recorded performance have a significant effect on r dm . When the data set included 10 187 individuals with 10% of dams with records, the r dm for 8-week BW showed a substantial decrease from −0.99 to −0.46 when number of progeny per dam changed from one or two to three or five. In our study, about 8% (112/1375) of the dams had their own performance records and the average number of progeny per dam was 1.91, resulting in modest r dm for BFT, SBFT and MD (Table 3). On the other hand, Larsgard and Olesen (Reference Larsgard and Olesen1998) reported very low but insignificant estimates for r dm of BFT and MD at pre-weaning and weaning. Maxa et al. (Reference Maxa, Norberg, Berg and Milerski2007) have reported the estimates of r dm for BFT, MD and LW as −0.69, −0.63 and −0.60, respectively. Strong direct maternal genetic correlations were reported by Koyuncu and Duru (Reference Koyuncu and Duru2009) for birth weight (−0.70 and −0.83).
The high estimates of c 2 in this study indicated the importance of both maternal environment and maternal care for Kivircik lambs. Larsgard and Olesen (Reference Larsgard and Olesen1998) have reported the estimates of c 2 for BFT and MD as 0.13 and 0.17 at pre-weaning, and 0.13 and 0.08 at weaning, respectively. The authors also reported c 2 values of 0.04, 0.08 and 0.10 for weight at birth, at pre-weaning and at weaning, respectively. For birth weight, Koyuncu and Duru (Reference Koyuncu and Duru2009) reported a c 2 of 0.26. Kushwaha et al. (Reference Kushwaha, Mandal, Arora, Kumar, Kumar and Notter2009) reported values of c 2 ranging from 0.002 to 0.19 for various BW measurements, and using different models. In their study on some growth traits, Ghafouri-Kesbi and Baneh (Reference Ghafouri-Kesbi and Baneh2012) estimated the fraction of maternal permanent environmental variance to phenotypic variance within the range of 0.05 and 0.10.
Conclusions
Estimation of genetic parameters is the key for a breeding program to be successful. Univariate analysis may provide general information for breeders to design selection strategies, however, multi-trait analyses are widely used as they allow taking into consideration the magnitude and direction of the genetic relationships between the traits of interest. Moderate genetic correlations between SBFT and BFT suggest that SBFT can be included in breeding programs aiming to improve BFT, especially when the animals are young, and fat on eye muscle is hard to distinguish. Maternal effects were found to be important, and should be accounted for in selection programs of Kivircik lambs.
Acknowledgments
The authors would like to thank the Scientific and Technological Research Council of Turkey (TUBITAK) for their financial support to the KAMAG project (Project No. 109G017). The authors also thank the sheep breeders who permitted the authors to perform this study in their flocks.