Nomenclature
- FD
-
flow distortion
- L
-
length of the intake
- LS
-
lower surface
- M
-
mach number
- P
-
static pressure
-
 ${P_\infty }$
,
${P_O}$
-
free stream pressure, Outlet pressure
-
${P_0}$
-
total pressure
- SBLI
-
shock wave – boundary layer interaction
- TPR
-
total pressure recovery
- X
-
local distance from ramp tip


Greek symbol
-
$\alpha $
-
cowl angle

1.0 Introduction
Shock waves are characterised by discontinuities in flow properties. They are inevitable in supersonic flows since the flow cannot adjust itself to the varying conditions at the speed of sound. Shock waves have numerous applications, including in the engineering, health and defense sectors. Shock waves, when interacting with boundary layers, result in many interesting and complex flow phenomena. Generally, these interactions are termed shock wave – boundary layer interactions (SBLIs). SBLI was first observed in external flows [Reference Green1]. If the strength of the shockwave is sufficient, a local separation bubble will form near the surface. In external flows, these interactions are influenced by the flow Mach number, nature of the boundary layer and geometry [Reference Matsuo, Miyazato and Kim2]. Neumann and Lustwerk [Reference Neumann and Lustwerk3] observed flow separation inside a supersonic diffuser induced by shock waves. Since that time, numerous studies have been conducted on SBLI in constant-area ducts, pipes, nozzles, intakes and so forth [Reference Tamaki, Tomita and Yamane4–Reference Gnani, Zare-Behtash and Kontis7].
SBLIs inside a supersonic air intake are of huge relevance. Proper design of the intake is crucial to supplying the optimum quantity of air into the combustion chamber at the desired conditions. Intakes employ internal, external, or mixed compression (both internal and external) to convert the high-speed atmospheric flow to subsonic levels suitable for the engine through a single or series of oblique and normal shocks. The performance of an air intake is defined based on different parameters such as total pressure recovery, flow distortion at exit, mass capture ratio, etc. [Reference Soltani, Younsi and Farahani8].
Das and Prasad conducted a numerical investigation to assess how the deflection angle of the cowl influences the performance of a supersonic intake [Reference Das and Prasad9]. Their findings substantiate that a slight adjustment in the cowl angle can yield performance comparable to that achieved with a 2.8% boundary layer bleed at a Mach number of 2.2. Reinartz et al. [Reference Reinartz, Herrmann, Ballmann and Koschel10] conducted a comprehensive investigation involving both experimental trials and numerical simulations to compare intake performance across varying isolator lengths. The study revealed that extending the isolator length can diminish the pressure sensitivity of the inlet; however, there exists a threshold beyond which sustaining a viable back pressure becomes unattainable. Further studies on the various geometric constraints of the intakes have been done by numerous other researchers [Reference Kubota, Tani and Masuya11–Reference Soltani, Younsi, Farahani and Masoud14].
These intakes are often fixed geometry and designed to operate at a particular design condition. Separation bubbles inside the intakes act as a physical obstruction to the flow and can reduce the overall area of the intake at that particular point. This forces the intake to operate in off-design conditions. Reduction of performance (total pressure recovery, flow distortion, mass capture) is associated with flow separation inside the intakes [Reference Hirschen, Herrmann and Gulhan15]. Reardon and Schetz [Reference Reardon, Schetz and Lowe16] developed a computational model for simulating both quasi-steady and transient behaviours in hypersonic intakes. Their research investigated the impact of separation bubbles on intake unstart, with transient analysis revealing that intake restart occurred as the separation bubble notably diminished in size. Kontis [Reference Kontis17] discussed flow separation in supersonic flow inside a supersonic combustor and observed the role of separation on the creation of favourable reactions. Unstarts associated with SBLIs: soft unstarts are common in high-speed air intakes [Reference Calvin, Khobragade, Sasidharan and Kumar18,Reference Tan and Guo19]. Soft unstart occurs when the normal shock is expelled out of the intake and forms a bow shock, diverting the incoming air outside. Boundary layer suction or bleed mechanisms are the widely used mechanism to prevent intake from unstart [Reference Hwang and Im20–Reference Huang, Yue and Chang22]. Kang et al. [Reference Kang, Wermer, Im, Song and Do23] experimented on the transient response of unstart on a scramjet engine to the boundary layer suction quantity and timing. They concluded that unstart can be avoided or delayed depending on the timing and amount of the suction process. A reduction in starting/restarting Mach number of hypersonic intake using the bleed mechanism was reported by Chang et al. [Reference Chang, Yu, Bao, Fan and Shen24]. The study investigated the improvements in intake performances and the broadening of the operation range of the intake with different bleeding rates. In an experimental analysis done by Wang et al. [Reference Wang, Yang, Xue, Kontis and Jiao25], a strong correlation was observed between separation shock oscillations and wall pressure fluctuations inside a hypersonic inlet and unstart condition. Wang et al. [Reference Wang, Wang, Huang, Xie, Liu and Tan26] studied the effect of sudden back pressure change on the unstart and restart of supersonic air intakes through transient simulations. They compared the depressurisation time at different depressurisation values for intake restart and found that lower depressurisation value is best suited for intake restart. Experimental analysis on intakes using fast response pressure sensitive paint done by Khobragade et al. [Reference Khobragade, Gustavsson and Kumar27] found upstream traveling waves communicating through narrow bands, the back pressure rise at intake unstart. The unsteadiness associated with the boundary layers is reflected in SBLI. Shock structures formed inside the intake move the position slightly, causing oscillating loading in the structures. Movement of shock train towards and away from the inlet from its mean position with increase and decrease in back pressure was observed in the experimental study done by Gnani et al. [Reference Gnani, Zare-Behtash, White and Kontis28]. There are numerous studies available on the unsteady effect of SBLI [Reference Fisher, Neale and Brooks29–Reference Grilli, Schmid, Hickel and Adams35].
Control of SBLIs is necessary to limit the performance degradation of intakes. Various control techniques used are broadly categorised into active and passive methods. The most accepted active technique is boundary layer bleed and air jets. Bleeding the boundary layer means taking a part of the boundary layer through a bypass, thus eliminating the extent of interaction. There are studies about the bleed geometry, position, opening area, etc., in relation to the performance of the intakes. Soltani et al. [Reference Soltani, Younsi and Farahani8] found that placing the bleed close to the throat or in the vicinity of the shock can improve the intake performance. Pattnaik and Ranjan [Reference Pattnaik and Rajan36] made a comprehensive study on various bleed geometry at various Mach numbers to understand the effectiveness of bleed in off-design conditions. Another active control mechanism uses micro-air jets to improve the energy of the boundary layer, thus making it resist the unfavourable pressure gradient when the shock wave falls on it [Reference Kumar and Alvi37]. Passive control methods use permanent structures inside the intake to alter the boundary layer and cause an effective mixing of low-momentum and high-momentum regions. However, the size of these structures posed the threat of breaking and entering the combustion chamber under extreme conditions. Babinsky and Ogawa [Reference Babinsky and Ogawa38] suggested the use of minute structures called micro ramps inside as passive control. Performance of the intake in terms of total pressure recovery at different Mach numbers was analysed by Niaz et al. [Reference Niaz, Zia, Masud and Safdar39] using RANS technique. A fixed geometry pod structure was used to change the flow field in intake and subsequent change in performance was noted. They pinpointed minimum performance when the pod was placed in the vicinity of the fuselage. Gahlot and Singh [Reference Gahlot and Singh40] concluded that combining both the active and passive methods improve the efficiency of intakes. New researches on artificial intelligence have equipped researchers with new tools to tackle complex flow problems. Idris et al. [Reference Idris, Saad, Rahman, Hashim and Kontis41] validated experimental results on scramjet inlet using artificial neural network and found good agreement of predicted results with experimental one.
Even though studies are available on the performance of high-speed intakes and SBLIs, a comprehensive study connecting intake performances with the separation zones resulting from SBLI is still limited. Fixed-geometry intakes are designed to work at maximum efficiency at the design Mach number. But these intakes operate in off-design conditions during take-offs, landings, and various manoeuvers. A number of parametric studies discussing the effect of cowl angle on the intake performance are present in the literature. However, the specific influence of changes in cowl angle on the separation zone, and consequently, their impact on the enhancement of intake performance, remains unexplored to the best of the author’s knowledge. The majority of the works claims the loss in performance of the intake to flow separations happening due to shock wave boundary layer interactions. Motivation behind the study is to explore the impact of size and position of these separations to the intake performance. Additionally, this research delves into the effects of off-design conditions, encompassing a range of Mach numbers on both separation size and overall intake performance. The current study exclusively concentrates on unthrottled intakes.
2.0 Numerical methodology
2.1 Intake geometry
The current investigation involves conducting a two-dimensional steady-state simulation of a rectangular supersonic air intake. The study focuses on exploring the effects of varying cowl deflection across a range of Mach numbers. The cowl undergoes deflections of 0
 ${{\rm{\;}}^ \circ }$
, 1
 ${{\rm{\;}}^ \circ }$
, 2
 ${{\rm{\;}}^ \circ }$
, 3
 ${{\rm{\;}}^ \circ }$
and 4
 ${{\rm{\;}}^ \circ }$
under intake conditions characterised by Mach numbers of 1.5, 2, 2.2, 2.5 and 3. Intake geometry is obtained from the experimental works conducted by Neale and Lamb [Reference Neale and Lamb42]. A detailed schematic of the intake having a cowl deflection of 4
 ${{\rm{\;}}^ \circ }$
is given in Fig. 1.
Schematic diagram of the intake geometry (
 ${\rm{\alpha }}$
= 4
 ${{\rm{\;}}^ \circ }$
).

External compression is attained through the utilisation of two compression ramps featuring angles of 7
 ${{\rm{\;}}^ \circ }$
and 14
 ${{\rm{\;}}^ \circ }$
relative to the flow direction. The intake captures the incoming flow through a 15 mm opening. Subsequently, the ramp section is followed by a dual diffuser section. The separation between the diffuser section and the second ramp is 8.25 mm, incorporating both a short curved and straight structure. The first and second diffusers possess divergence angles of 2.3
 ${{\rm{\;}}^ \circ }$
and 6
 ${{\rm{\;}}^ \circ }$
, respectively. The channel area is maintained constant aft of the diffuser section. The cowl is positioned on the top side of the ramp, with the cowl tip offset by a distance of 22.98 mm from the ramp tip. To mitigate flow distortions, both ramp and cowl tips are kept sharp. The cowl tip can be deflected inwards from 0
 ${{\rm{\;}}^ \circ }$
to 4
 ${{\rm{\;}}^ \circ }$
at a distance of 14.36 mm from the tip for present study similar to the previous experimental investigation [Reference Das and Prasad9]. The cowl surface, from the point of deflection onward, is maintained horizontally to the central axis. The overall length of the geometry (L) is 119 mm. To facilitate the description of the separation bubble position in the intake, the lower section, comprising the ramps, diffusers, and constant area section, is termed lower surface (LS), while the upper surface is designated as cowl.
2.2 Governing equations
The physical phenomena of fluid flow are mathematically represented by solving equations that govern continuity, momentum, energy and the equation of state. Actual flow field is turbulent in nature. A two-dimensional compressible Reynolds-averaged Navier-Stokes (RANS) equations have been solved in the present simulation to capture the actual flow physics. The equations solved are:
-
1. Continuity equation
(1)
\begin{align}\frac{{\partial \bar \rho }}{{\partial t}} + \frac{{\partial\! \left( {\bar \rho {{\tilde u}_j}} \right)}}{{\partial {x_j}}} = 0\end{align}
-
2. Momentum equation
(2)
\begin{align}\frac{{\partial\! \left( {\bar \rho {{\tilde u}_j}} \right)}}{{\partial t}} + \frac{{\partial\! \left( {\bar \rho {{\tilde u}_i}{{\tilde u}_j}} \right)}}{{\partial {x_j}}} = - \frac{{\partial \bar p}}{{\partial {x_i}}} + \frac{{\partial\! \left( {{{\bar \tau }_{ji}} - \overline {\rho {u_i}{\rm{'}}{u_j}{\rm{'}}} } \right)}}{{\partial {x_j}}}\end{align}
-
3. Energy equation
(3)
\begin{align}\frac{{\partial\! \left( {\bar \rho \tilde h} \right)}}{{\partial t}} + \frac{{\partial\! \left( {\bar \rho \tilde h{{\tilde u}_j}} \right)}}{{\partial {x_j}}} = \frac{{\partial \bar p}}{{\partial t}} + {\tilde u_j}\frac{{\partial \bar p}}{{\partial {x_j}}} + \overline {u{{\rm{'}}_j}\frac{{\partial p}}{{\partial {x_j}}}} + \frac{{\partial\! \left( { - {{\bar q}_j} - \overline {\rho h{\rm{'}}u{{\rm{'}}_j}} } \right)}}{{\partial {x_j}}} + \overline {{\tau _{ji}}\frac{{\partial u{{\rm{'}}_i}}}{{\partial {x_j}}}} \end{align}


where
 ${u_i}$
and
 ${x_i}$
are velocity and corresponding direction.
 $\rho $
,
 $h$
and
 $p$
are density, enthalpy and pressure. (
 ${\,\bar{}\,}$
),
 $(\,\tilde{}\,)$
and (′) denotes Reynods average, favre average and turbulent fluctuation respectively.
 ${\tau _{ji}}$
and
 ${q_j}$
are molecular shear stress and instantaneous heat flux respectively and are defined by,
 \begin{align}{{\bar \tau }_{ji}} &= \bar \mu \left( {\frac{{\partial {{\bar u}_i}}}{{\partial {x_j}}} + \frac{{\partial {{\bar u}_j}}}{{\partial {x_i}}}} \right) + \frac{1}{3}\frac{{\partial {{\bar u}_j}}}{{\partial {x_j}}}{\delta _{ij}} \end{align}
 \begin{align}{{\bar q}_j} &= - \bar \lambda \frac{{\partial \bar T}}{\partial {x_j}} \\[0pt]\nonumber\end{align}
T is the temperature and
 $\bar \lambda $
=
 $\frac{{{C_p}\bar \mu }}{{{P_r}}}$
is the thermal conductivity with Pr as molecular Prandtl number.
Compressible RANS equations exhibit striking similarity to their incompressible counterparts, with the notable distinction lying in the Reynolds stress component. Here, the Reynolds stress (
 $\overline {\rho {u_i}{\rm{'}}{u_j}{\rm{'}}} $
) includes a fluctuating density component. The simultaneous solution of these three equations, coupled with the incorporation of turbulent kinetic energy (k) and various Reynolds stress equations, constitutes a comprehensive approach in addressing compressible flows in turbulent regimes [Reference Marvin43]. Governing equations are closed using standard k-
 $\omega $
turbulence model where k is the turbulent kinetic energy and
 $\omega $
is its specific dissipation rate as proposed by previous studies [Reference Das and Prasad9].
 \begin{align}\frac{\partial }{\partial t }\left( {\rho k} \right) + \frac{\partial }{{\partial {x_i}}}\left( {\rho k{u_i}} \right) = \frac{\partial }{{\partial {x_j}}}\left( {{{\rm{\Gamma }}_k}\frac{{\partial k}}{{\partial {x_j}}}} \right) + {G_k} - {Y_k} + {S_k}\nonumber\\\frac{\partial }{{\partial t}}\left( {\rho \omega } \right) + \frac{\partial }{{\partial {x_i}}}\left( {\rho \omega {u_i}} \right) = \frac{\partial }{{\partial {x_j}}}\left( {{{\rm{\Gamma }}_\omega }\frac{{\partial \omega }}{{\partial {x_j}}}} \right) + {G_\omega } - {Y_\omega } + {S_\omega }\end{align}
In these equations,
 ${G_k}$
and
 ${G_\omega }$
represents the generation of turbulence kinetic energy and
 $\omega $
respectively. Its effective diffusivity is represented by
 ${{\rm{\Gamma }}_k}$
and
 ${{\rm{\Gamma }}_\omega }$
.
 ${Y_k}$
and
 ${Y_\omega }$
represent the dissipation of
 $k$
and
 $\omega $
due to turbulence.
 ${S_k}$
and
 ${S_\omega }$
are user-defined source terms. Further discussions on the calculation of each term is available in the reference [Reference Wilcox44]. Adaptive time stepping based on the CFL number 0.8 is used with an initial step size of 1
 $ \times {10^{{\rm{\;\;}} - 6}}$
. Simulation is run for 0.45 ms till it attained steady state.
2.3 Pertinent performance parameters
Current study focuses on correlating intake performance with local flow separations occurring inside the intake. Main performance parameters analysed here are:
-
1. Total pressure recovery (TPR)
TPR is a key performance parameter index for supersonic intakes. It quantifies how effectively the intake system recovers total pressure after series of shock deceleration. It is defined as the ratio of total pressure at the outlet to the free-stream total pressure. A perfect value of TPR = 1 means no losses indicating perfect recovery. Any value less than TPR = 1 denotes losses inside the intake resulting from flow separation, improper handling of shock waves, etc.
 \begin{align}TPR = \frac{{{{\bar P}_{{0_O}}}}}{{{P_{{0_\infty }}}}}\end{align}
-
2. Flow distortion (FD)
Flow distortion can be considered as another important metric to analyse the effectiveness of the intake. It defines the uniformity of flow supplied by the intake to the engine. It is defined as the ratio of the difference between maximum and minimum total pressure at exit to average total pressure at exit. For smooth operation, flow from the intake to the engine should be uniform and steady. Distorted flow at the exit can lead to issues such as non-uniform pressure distribution, fluctuating mass flow rates or sudden flow separations, all of which can disrupt engine operation.
 \begin{align}FD = \frac{{{P_{{0_{O,max}}}} - {P_{{0_{O,min}}}}}}{{{{\bar P}_{{0_O}}}}}\end{align}
2.4 Numerical approach
Detailed studies analysing the effect of various modeling decisions like turbulence models, two-dimensional vs three-dimensional formulations etc., are available in the literature [Reference Gnani, Zare-Behtash, White and Kontis45]. Current simulation is carried out in finite volume solver ANSYS-FLUENT(2021 R2). Flowing fluid is air and its density is obtained from ideal gas equations. Viscosity is calculated from Sutherland’s law. Simulation is done using implicit formulation since it is unconditionally stable. Convective flux vector is calculated using the Advection Upstream Splitting Method (AUSM) by Liou and Steffen [Reference Liou and Steffen46]. AUSM method is better at resolving the shockwaves since it uses neighbouring cell velocities to calculate interface Mach number. All terms are discretised using a second-order upwind scheme except in some off-design conditions, where the order of discretisation is reduced to first order. A CFL number of 0.5 is used to reach the steady-state solution.
2.4.1 Grid generation
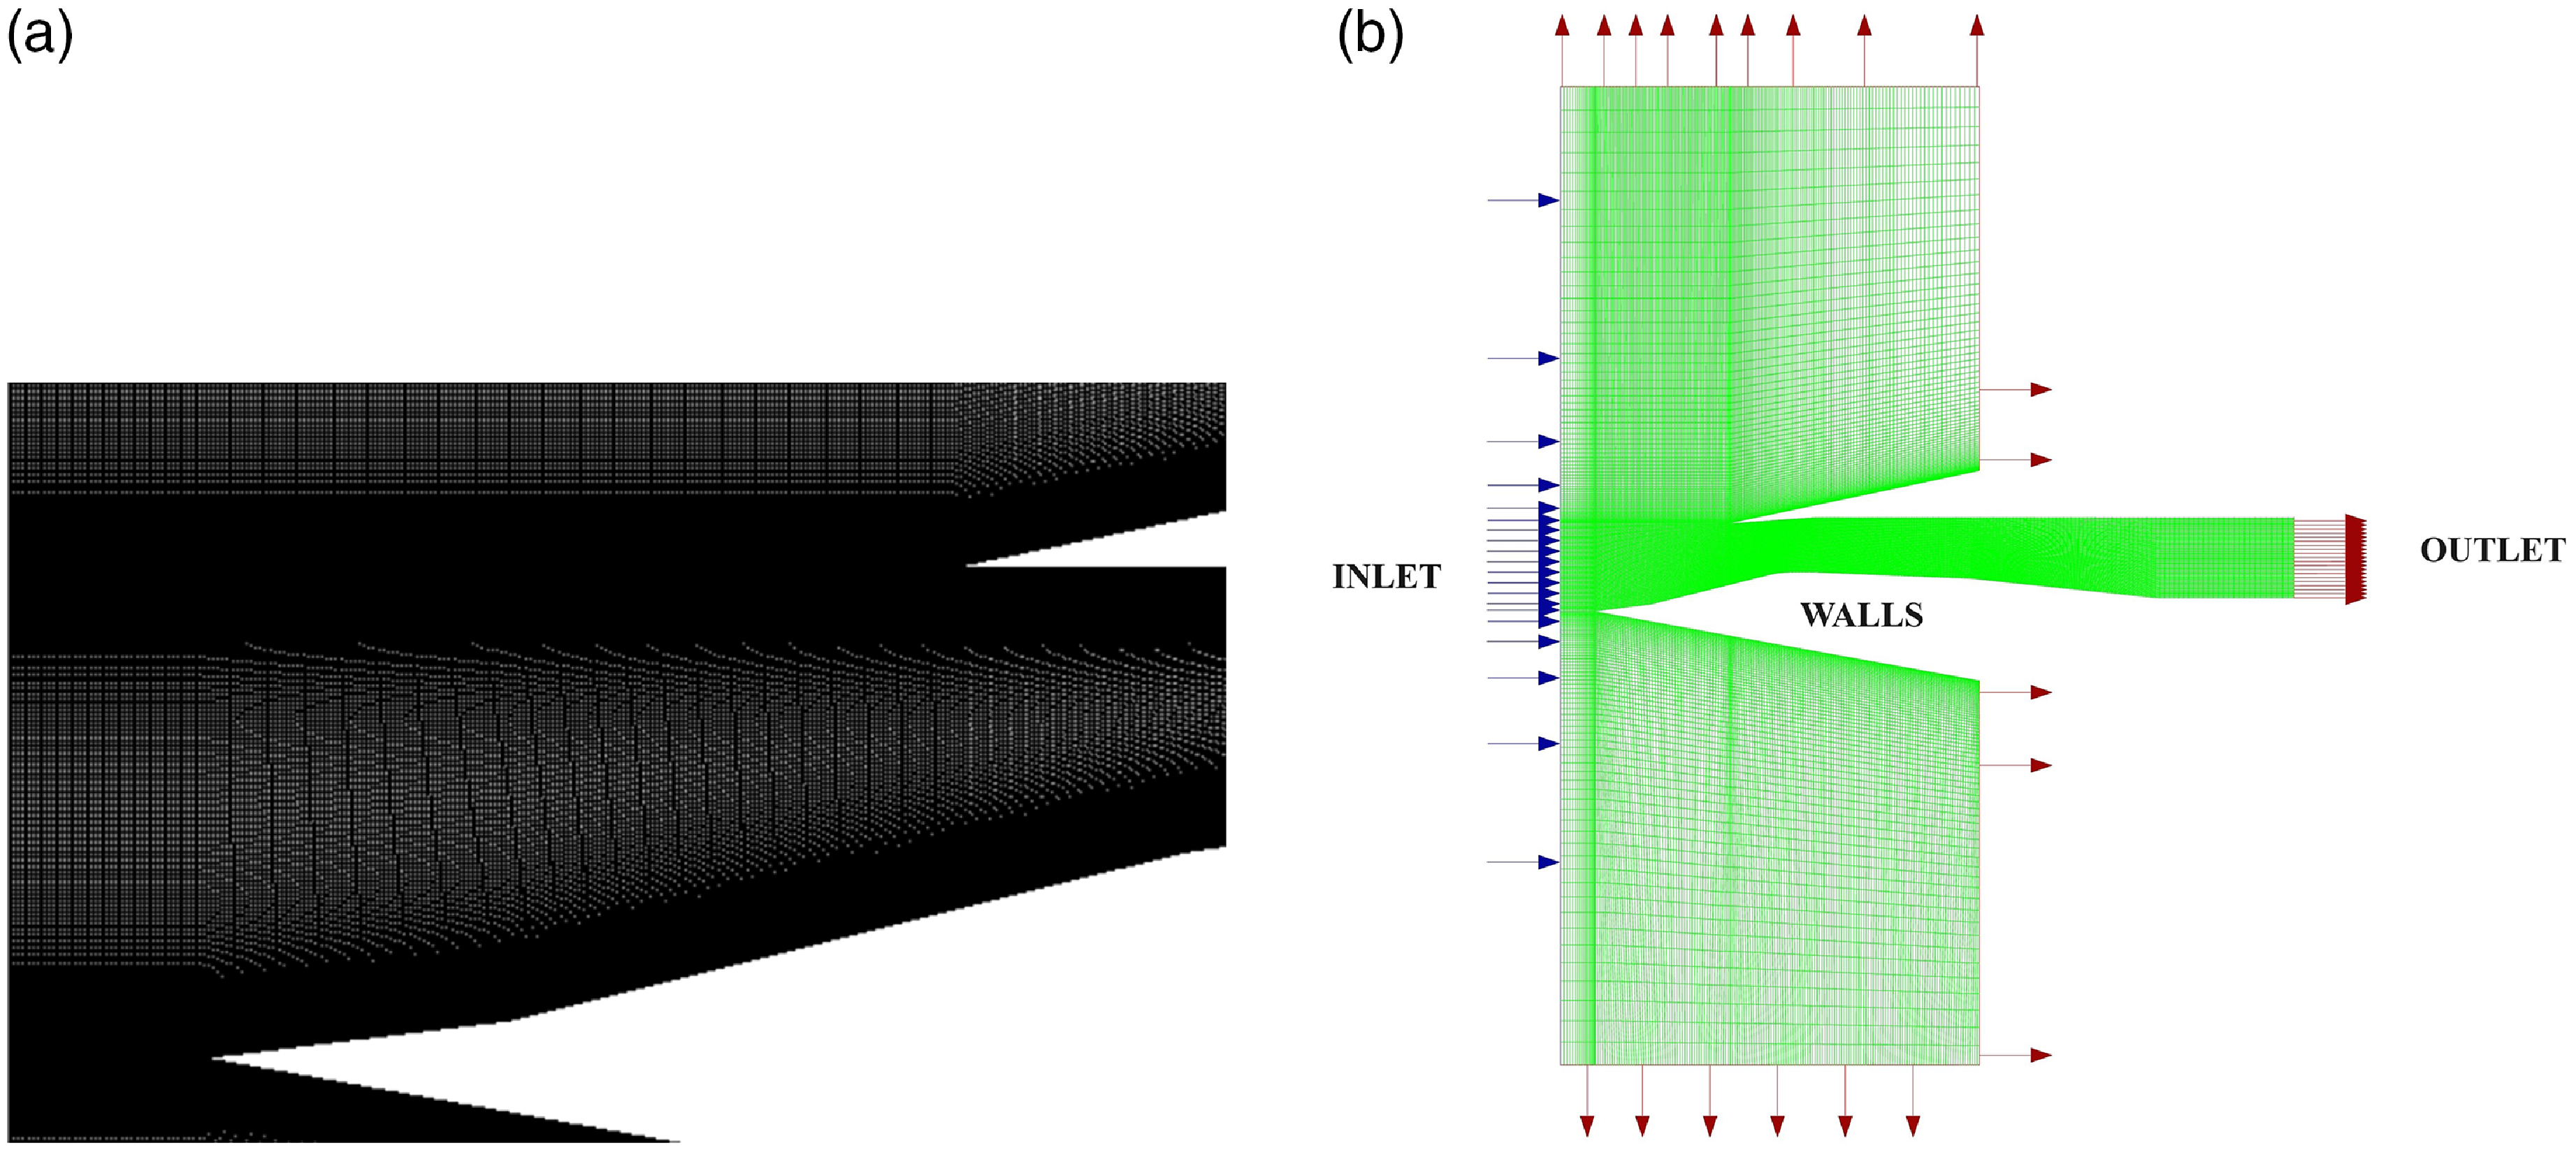
Two-dimensional structured meshing is done with high refinement near the intake inlet, throat and near all walls. Biasing is done near all junctions (Fig. 2(a)). The first cell thickness is given in such a way as to keep the Y+ value near 1. A low Y+ value resolves the boundary layer more realistically than using other near wall functions. Domain surrounding the intake is extended in downstream, top and bottom directions to develop the flow and to make sure that the deflected shock waves escape the domain as shown in Fig. 2(b). Downstream expansion of the computational domain is to ensure that the flow is fully developed and stable after interacting with fixed walls. Meshing inside the intake is fine with a low aspect ratio and skewness values. But outside the intake cell spacing gradually increases.
(a) Zoomed view of the grid near the intake inlet, and (b) computational domain with boundary conditions (not in scale).

2.4.2 Boundary conditions
Boundary conditions are defined based on previous research [Reference Das and Prasad9]. Inlet of the domain is modeled as a pressure-inlet. Stagnation pressure is calculated from isentropic flow equations corresponding to simulated Mach number. Total temperature of the flow is kept at 300K. Outlet is modeled as a supersonic outlet where flow properties are extrapolated from the interior. The flow is allowed to expand freely in all the cases simulated. Walls are adiabatic and satisfy the no-slip condition. Turbulent intensity at inlet and outlet are kept low to a value of 0.5% and the turbulent viscosity ratio is kept at 10.5 (Table 1).
Boundary conditions

2.4.3 Simulation validation
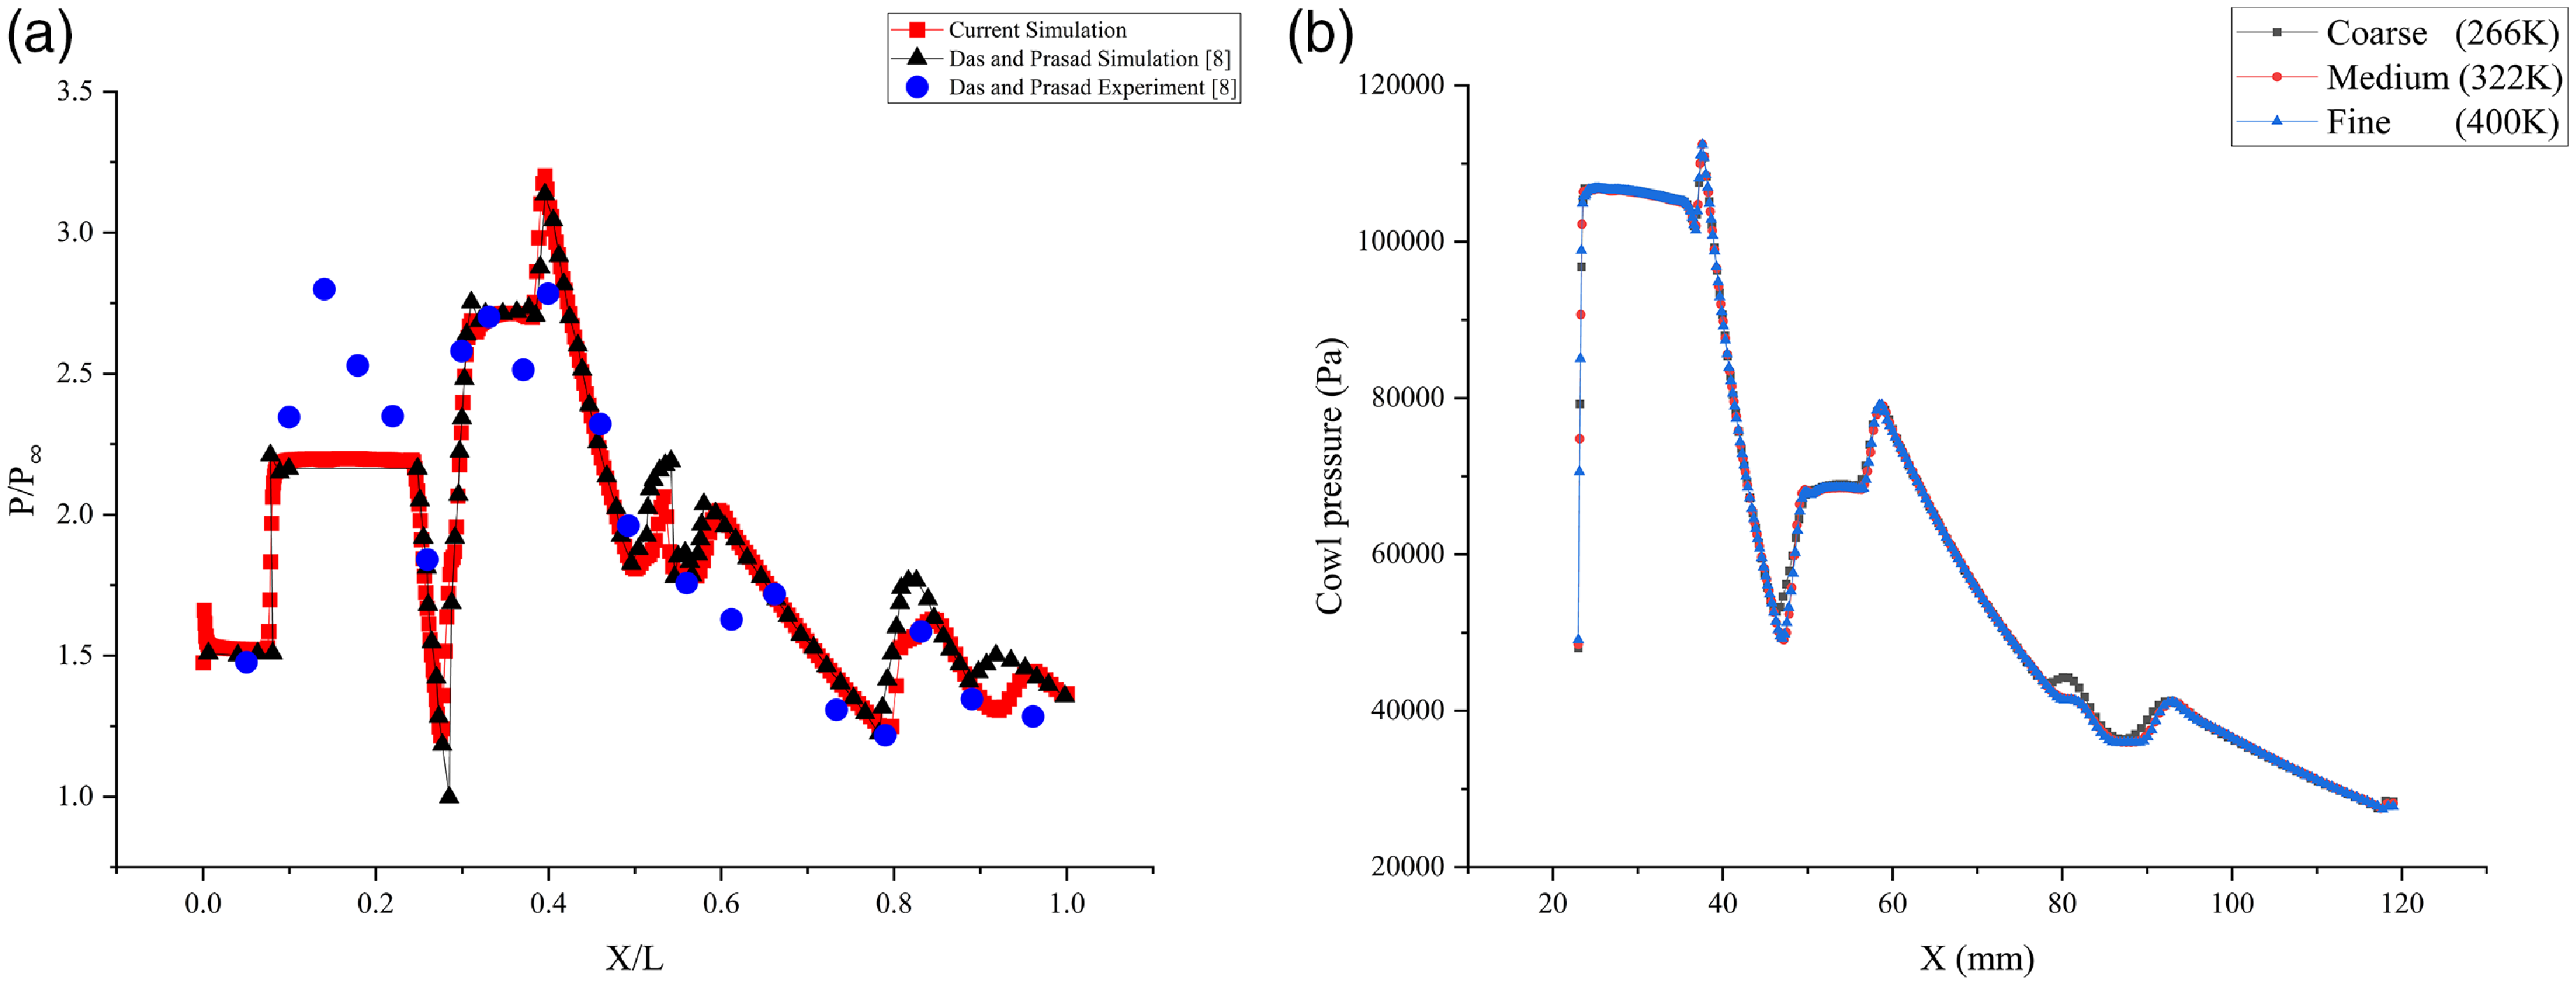
The numerical setup, boundary conditions and turbulence model is first validated against already established results to make sure the setup will be able to reproduce the flow physics accurately. Das and Prasad [Reference Das and Prasad9] conducted both experimental and two-dimensional numerical simulation on a rectangular intake with free-stream conditions at the outlet for understanding the cowl angle at which best performance is shown. Validation of the current setup is achieved by comparing static pressure (P) along the lower surface of the geometry for a cowl angle of 4
 ${{\rm{\;}}^ \circ }$
at M = 2.2 with the results from the experiments and numerical simulations done by Das and Prasad. Static pressure and downstream distance are normalised using the free stream pressure (
 ${P_\infty }$
) and total length of the intake (L), respectively. A good agreement is obtained in the results between the lower surface pressure of the current study with the existing experimental and numerical results presented in the literature as shown in Fig. 3(a). The momentary rise and fall in static pressure corresponding the encounter of flow with shock waves and expansion fans are clearly captured. Slight under prediction in the pressure is observed at the opening of the intake between experimental and numerical results, which is also present in the previous studies [Reference Das and Prasad9]. This may be due to the inability of the solver to predict properties at the immediate interaction of supersonic flow with a sharp object. But further along the intake numerical results are matching with experimental values with average deviation of 10%.
(a) Validation of normalised static pressure against distance along the lower surface, and (b) grid-independence test for cowl pressure aganist distance along the cowl surface.

2.4.4 Grid independence test (GIT)
Grid-independence test (GIT) is conducted to determine the optimal mesh configuration for the study, aiming to minimise computational costs while maintaining solution accuracy, as illustrated in Fig. 3(b). The investigation involves three mesh types: coarse (266K cells), medium (322K cells) and fine (400K cells), each characterised by varying cell counts. The cell density is systematically increased within the intake region to assess its impact on the solution accuracy. Special attention is devoted to mitigating abrupt alterations in cell dimensions during transitions between cells. Sizing adjustments are meticulously applied to each mesh, ensuring a constant first cell thickness and maintaining a consistent Y+ throughout the GIT. These measures are implemented to guarantee solution robustness, rendering it independent of the grid, with subsequent refinements yielding negligible deviations in results. Maximum deviation of cowl pressure between coarse mesh and medium mesh is 12
 ${\rm{\% }}$
and deviation is 2
 ${\rm{\% }}$
between medium and fine mesh. Hence for further analysis medium mesh having 322K cells is selected.
3.0 Results and discussions
3.1 Flow physics inside the intake
A detailed insight into SBLI inside a supersonic intake is possible only after a proper understanding of various flow phenomena occurring inside the intake. For this pressure contour inside the intake with 3
 ${{\rm{\;}}^ \circ }$
cowl deflection at the design Mach number is reviewed in Fig. 4. Shocks inside the intake can be visualised by the abrupt change in color. Gradual change is denoting a gradual change in static pressure, which depicts expansion fans. The presence of an expansion fan is prominent near the throat shown in between the two dotted lines in the figure.
Static pressure contour inside the intake at
 ${\rm{\alpha }}$
= 3
 ${{\rm{\;}}^ \circ }$
, M 2.2.

Incoming air is guided inside the intake through the dual ramp structure. The ramp shocks are meeting at the cowl tip. An oblique shock from the cowl tip is falling on the lower surface near the throat. Air is expanding near the throat region forming the expansion fans. Here the intake is operating in the design Mach number of 2.2. The strength of the oblique shock is high enough to impart flow separation at the point of impact. The compression of the supersonic stream tube by the separation bubble leads to the development of separation shock. The cowl shock gets reflected from the LS as reflection shock. Another shock is forming from point A (Fig. 1), which also moves downstream through further reflection. The oblique shocks progress towards the exit by reflecting off at lower and cowl surfaces, creating the structure known as shock train [Reference Matsuo, Miyazato and Kim2]. Local flow separation can form at the point of impact of the shock wave at either surfaces. The size of the separation bubble varies as SBLIs strengthens. Compression and deceleration of the incoming supersonic flow is achieved through these shock trains.
3.2 Shock structure inside the intake
Shock waves inside the intake can be better visualised through numerical schlieren contour plots on the intake. Modulus of density gradient plots on the intake is used to compare the shock structure at various Mach numbers for the intake with different cowl deflections.
A detached bow shock is present at M = 1.5 in front of the ramp tip in Fig. 5(a). Flow immediately right to the shock is in a subsonic state and later accelerates inside the intake owing to the exit boundary condition. An entirely different flow structure is observed at M = 2 (Fig. 5(b)). The ramp tip oblique shocks meet together at a point upstream from the cowl tip. The interaction between the cowl shock and LS boundary layer causes a separation bubble to form at the point of impact. A feeble separation shock originating from the point of separation is fading out through further reflections and the expansion fan near the throat is not prominent due to the low Mach number. Both the ramp shocks are meeting the cowl tip and the cowl shock is falling on the LS farther downstream near the throat at M = 2.2 (Fig. 5(c)). Here also the oblique shock is strong enough to make a small separation on the throat. The reflected and separation shocks originating from the point of impact is evident and advance towards the nozzle exit by reflecting off from the LS and cowl surfaces. As airflow speed is increased to M = 2.5 and M = 3, the shock structure inside the intake changes dramatically (Fig. 5(d), (e)). Ramp shocks are converging earlier and imparting on the cowl at a more downstream location from the tip, resulting in significant separations in the cowl. The location where the cowl shock impacts the LS is also shifting deeper inward. The existence of robust expansion fans in the vicinity of the throat causes oblique shocks to curve, with the curvature intensifying as the Mach number increase. These irregular shock structures can be the possibility of deterioration in the intake performance. Numerical schlieren plots inside the intake for cowl angles of 0
 ${{\rm{\;}}^ \circ }$
–3
 ${{\rm{\;}}^ \circ }$
are shown in Figs. 6 and 7.
Numerical schlieren contour plot on the intake with
 ${\rm{\alpha }}$
= 4
 ${{\rm{\;}}^ \circ }$
for Mach numbers: (a) M = 1.5, (b) M = 2, (c) M = 2.2, (d) M = 2.5, and (e) M = 3. Contour levels used are between 0 and 150, with 100 levels (frame(a)), and in all other cases, they are between 0 and 500, with 100 levels.

Numerical schlieren contour plots for
 ${\rm{\alpha }}$
= 0
 ${{\rm{\;}}^ \circ }$
and 1
 ${{\rm{\;}}^ \circ }$
at different Mach numbers. Similar contour levels are used as mentioned in Fig. 5.

Numerical schlieren contour plots for
 ${\rm{\alpha }}$
= 2
 ${{\rm{\;}}^ \circ }$
and 3
 ${{\rm{\;}}^ \circ }$
at different Mach numbers. Similar contour levels are used as mentioned in Fig. 5.

A detached bow shock is observed in front of the ramp at M = 1.5 for all cowl angles. This deflects the main flow from the intake. Flow immediate to this bow shock is subsonic and later accelerate to supersonic velocities after the diffuser. At M = 2, a large separation bubble is seen on the ramp surface for the cowl angles 0
 ${{\rm{\;}}^ \circ }$
–3
 ${{\rm{\;}}^ \circ }$
which results in unstart of the intake. The incident shock from the cowl tip interacts with the boundary layer on the ramp surface creating a large separation bubble. This thickens the net boundary layer thickness and reduces the net area inside the throat. Thus shock gets out from the intake and forms the bow shock which results in subsonic flow inside the intake. Van Wie et al. [Reference Van Wie, Kwok and Walsh12] studied these types of unstart and described them as soft unstart. Start of the separation bubble seems to shift inward towards the throat when angle increases (0
 ${{\rm{\;}}^ \circ }$
–3
 ${{\rm{\;}}^ \circ }$
) at M = 2. For Mach number 2.2, intake is in unstart condition at cowl angle 0
 ${{\rm{\;}}^ \circ }$
but restarts when cowl is deflected by 1
 ${{\rm{\;}}^ \circ }$
–4
 ${{\rm{\;}}^ \circ }$
. Here separation between separated shock and reflected shocks reduces as the angle increases and is minimum at the cowl angle 4
 ${{\rm{\;}}^ \circ }$
, which shows reduction in separation bubble size at that location. Quantitative analysis on the reduction in this bubble size is discussed in the following sections. It has been observed that the curvature of the cowl shock increases with an increase of both the Mach number and cowl angle. This could be attributed to the combined effect of the inward movement of the separation bubble with an increase in cowl angle and the formation of stronger expansion fans with increase in the Mach number.
3.3 Effect of cowl angle and operating condition on separation bubbles
The primary drawback of SBLIs is the occurrence of local separations on surfaces caused by the adverse pressure gradient induced by shock waves. The performance of the intake is adversely impacted by these separations. A qualitative study is done by plotting the velocity vector on the intake along with Mach contour in Fig. 8.
Mach contour and velocity vector (enlarged at the separation points) inside the intake with
 ${\rm{\alpha }}$
= 4
 ${{\rm{\;}}^ \circ }$
for Mach numbers: (a) M = 2, (b) M = 2.2, (c) M = 2.5, (d) M = 3.

Mach contour inside the intake with cowl angle 4
 ${{\rm{\;}}^ \circ }$
is compared for different Mach numbers. The exclusion of plots for M = 1.5 is due to the absence of separation bubbles, as the primary goal is to visualise these bubble. Only separations with a minimum size of 1 mm are included in the plots. Additionally, M = 3 has a fourth separation bubble of size 0.5 mm, which is shown in Fig. 8(d) as point 4. Correlation between performance of the intake and SBLIs cannot be attempted without quantifying these separations. The extent of the interaction between shock wave and boundary layer is quantified using separation bubble width formed at different locations. A better understanding of the position and extend of these bubbles are obtained by plotting the wall shear stress along LS and cowl surfaces. Wall shear stress at a point depends on the gradient of flow velocity along the perpendicular direction. Wall shear stress along the surfaces becomes negative when separation bubbles are formed.
The point where wall shear stress becomes negative from positive is considered to be the starting of separation bubble and point where the negative value again becomes positive is considered as the end of separation bubble. The number of separation bubbles also quantifies the extent of SBLIs.
Figure 9 depicts the wall shear stress along the LS and cowl surfaces for a cowl without any deflection (0
 ${{\rm{\;}}^ \circ }$
) at various Mach numbers. At M = 1.5, there are no SBLIs occurring within the intake, regardless of the changes in cowl angle. Therefore, in the current study, any further discussions regarding the position and size of the separation bubble exclusively pertain to Mach numbers of 2 and above. The largest separation bubble for
 $\alpha $
= 0
 ${{\rm{\;}}^ \circ }$
is observed at M = 2 on the ramp surface (Fig. 9(a)). In Fig. 9(b) wall shear stress at M = 2.2 is depicted. Similar to M = 2, M = 2.2 also has a large separation on the ramp associated with the intake unstart. The role of these separation bubbles on intake unstart will be discussed in subsequent section. Further increase of Mach number is associated with a started intake with separation size on the LS suddenly dropping (Fig. 9(c) and (d)). Cowl separation bubbles are observed only at M = 2.5 and M = 3. The bubbles are moving in the direction of the exit as Mach number increases from 2.5 to 3. This is due to the overall shift of the shock structure further downstream with an increase in the Mach number. When compared with the LS separations, cowl separation bubbles are smaller in size.
Quantification of wall shear stress along the lower and cowl surfaces for = 0
 ${{\rm{\;}}^ \circ }$
and different Mach numbers: (a) M = 2, (b) M = 2.2, (c) M = 2.5, (d) M = 3.

Figures 10–13 are associated with the wall shear stresses for cowl angle 1
 ${{\rm{\;}}^ \circ }$
, 2
 ${{\rm{\;}}^ \circ }$
, 3
 ${{\rm{\;}}^ \circ }$
and 4
 ${{\rm{\;}}^ \circ }$
, respectively. Similar to Fig. 9, large separation on the ramp surface is observed at M = 2 for all the cowl configurations in Figs (10–12(a)). Figure 13(a) has small separation size near the throat when compared with other cowl angles at M = 2, which suggest intake is in started condition on 4
 ${{\rm{\;}}^ \circ }$
cowl configuration from M = 2. Compared with Fig. 9 of
 $\alpha $
= 0
 ${{\rm{\;}}^ \circ }$
, all other cowl angles also have two separation bubbles on the cowl surface only at M = 2.5 and M = 3. The position of the two cowl shocks are not changing with
 $\alpha $
for a particular Mach number.
Quantification of wall shear stress along the lower and cowl surfaces for
 ${\rm{\alpha }}$
= 1
 ${{\rm{\;}}^ \circ }$
and different Mach numbers: (a) M = 2, (b) M = 2.2, (c) M = 2.5, (d) M = 3.

Quantification of wall shear stress along the lower and cowl surfaces for
 ${\rm{\alpha }}$
= 2
 ${{\rm{\;}}^ \circ }$
and different Mach numbers: (a) M = 2, (b) M = 2.2, (c) M = 2.5, (d) M = 3.

Quantification of wall shear stress along the lower and cowl surfaces for = 3
 ${{\rm{\;}}^ \circ }$
and different Mach numbers: (a) M = 2, (b) M = 2.2, (c) M = 2.5, (d) M = 3.

Quantification of wall shear stress along the lower and cowl surfaces for
 ${\rm{\alpha }}$
= 4
 ${{\rm{\;}}^ \circ }$
and different Mach numbers: (a) M = 2, (b) M = 2.2, (c) M = 2.5, (d) M = 3.

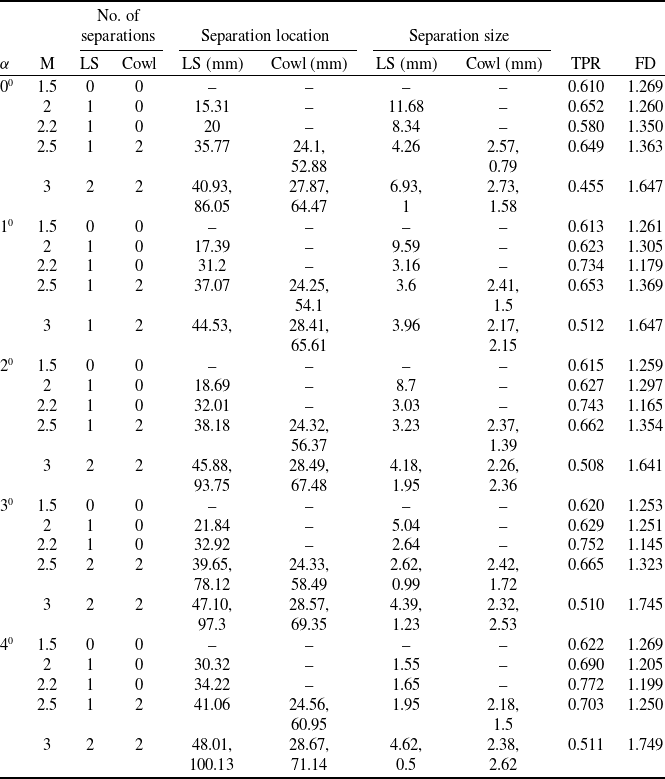
Table 2 summarises all the cases analysed during the current study. It encompasses the number of separation bubbles on the cowl and lower surfaces (LS), the corresponding position where it starts, size of the separation for various cowl angles (
 $\alpha $
), and Mach numbers along with the total pressure recovery (TPR) and flow distortion (FD) for each of these cases. Intake unstart is observed at M = 2 for cowl configurations 0
 ${{\rm{\;}}^ \circ }$
–3
 ${{\rm{\;}}^ \circ }$
. Soft unstart is characterised with the large separation on the ramp surface (Figs. 6 and 7). Separation is diminishing and moving towards the throat section as cowl deflection increase. At
 $\alpha $
= 4
 ${{\rm{\;}}^ \circ }$
separation size is 1.55 mm for M = 2 and the intake restart is observed. Intake unstart at M = 2.2 is observed only for
 $\alpha $
= 0
 ${{\rm{\;}}^ \circ }$
, with a separation bubble of size 8.34 mm on the ramp. However intake starts with a small deflection of 1
 ${{\rm{\;}}^ \circ }$
where separation bubble size reduces to 3.16 mm and position is shifted to the throat from ramp. (Further increase in
 $\alpha $
is also associated with started intake.)
Number of separations, separation bubble position, size, TPR and FD for various parameters under study

Figure 14 plots net separation size against Mach number and cowl angles, respectively. Since there are a number of local separations on lower and cowl surfaces, net separation bubble size is calculated as the sum of local separation bubble sizes on cowl and LS for a particular configuration and operating condition. At M = 1.5 no separation is present due to the absence of SBLI owing to the bow shock in front of the ramp tip. The correlation between separation size and performance of the intake in terms of TPR can be understood by comparing Fig. 14 with Fig. 15. Maximum and minimum separation sizes are characterised by minimum and maximum TPR except at M = 1.5. Maximum separation size is for
 $\alpha $
= 0
 ${{\rm{\;}}^ \circ }$
at M = 3. For all Mach numbers, intake with 4
 ${{\rm{\;}}^ \circ }$
cowl deflection has the least separation bubble size except at M = 3 (Fig. 14(b)). For M = 3 minimum separation is for
 $\alpha $
= 1
 ${{\rm{\;}}^ \circ }$
. Figure 14(a) shows that for each cowl angle, minimum net separation sizes are observed at M = 2.2 which is the design Mach number. Only deviation in this trend is observed at
 $\alpha $
= 0
 ${{\rm{\;}}^ \circ }$
where separation size is minimum at M = 2.5. As Mach number deviates from M = 2.2, separation size is increasing. A general trend of reduction in separation size can be seen when cowl angle increases for a particular Mach number (Fig. 14(b)). Higher Mach numbers lead to the formation of stronger shock waves, causing more instances of separation at various points within the intake system. This phenomenon is contributing to the increase in net separation size.
Variation of net separation bubble size with respect to (a) Mach number and (b) cowl angle.

Variation of TPR aganist net separation bubble size for Mach numbers: (a) M = 2, (b) M = 2.2, (c) M = 2.5, (d) M = 3.

Correlating separation bubble with TPR provides insight into the dependency of performance on separation bubble size. A general trend is found to be a decrease in TPR with increase in separation size except in some cases (Fig. 15(a)–(d)). At M = 2, intake is in soft unstart for cowl configurations 1
 ${{\rm{\;}}^ \circ }$
–3
 ${{\rm{\;}}^ \circ }$
, hence TPR for these angles are comparable (Fig. 15(a)). A prominent improvement in TPR is observed when cowl angle changes from 3
 ${{\rm{\;}}^ \circ }$
to 4
 ${{\rm{\;}}^ \circ }$
, where intake starts. In Fig. 15(b) TPR of
 $\alpha $
= 1
 ${{\rm{\;}}^ \circ }$
is suddenly rising from
 $\alpha $
= 0
 ${{\rm{\;}}^ \circ }$
which is denoting the restart of intake when cowl deflection increase from
 $\alpha $
= 0
 ${{\rm{\;}}^ \circ }$
. TPR at M = 2.2 is larger than that of M = 2. Gradual change in TPR with net separation size is again observed in Fig. 15(c) at M = 2.5 where intake is in started condition for all cowl configurations. Deviation in the general trend (higher
 $\alpha $
having higher TPR) is observed in Fig. 15(d) at M = 3. Here
 $\alpha $
= 1
 ${{\rm{\;}}^ \circ }$
has the minimum net separation size. There is a 12% increase in net separation size between
 $\alpha $
= 1
 ${{\rm{\;}}^ \circ }$
and
 $\alpha $
= 4
 ${{\rm{\;}}^ \circ }$
accompanied by less than 1% change in TPR. Influence of net separation size on TPR is observed to be less significant at higher Mach number (M = 3).
Figure 16(a) and (b) plots FD against Mach number and cowl angle. FD is an important parameter to consider while analysing the performance of an intake. Intake exit should provide uniform, non-distorted flow to the combustion chamber for maximum efficiency [Reference Sepahi-Younsi and Forouzi Feshalami13]. FD is minimum at M = 2.2 for most of the cowl configurations except for cowl angles 0
 ${{\rm{\;}}^ \circ }$
and 4
 ${{\rm{\;}}^ \circ }$
(Fig. 16(a)). These configurations has minimum FD at M = 2 (For
 $\alpha $
= 4
 ${{\rm{\;}}^ \circ }$
FD between M = 2 and M = 2.2 are almost same). Variations in the position and number of separation bubbles may be the reason for obtaining minimum FD at other Mach numbers other than the design Mach number. Observations from Fig. 16(b) show minimum FD for all cowl angles at M = 2.2 with slight deviation for
 $\alpha $
= 0
 ${{\rm{\;}}^ \circ }$
due to intake unstart. Small deviations in FD from expected results may be attributed to the unsteady effects of SBLIs.
Variation of FD with respect to (a) Mach number and (b) cowl angle.

4.0 Concluding remarks
Shock waves have crucial roles in deccelerating supersonic flows to subsonic speeds inside an intake. Interaction of these shock waves with the boundary layer on the walls of intake is unavoidable and can result in separation bubble. Performance of the intake depends on the nature, size and position of these bubbles. Hence it is helpful to have better understanding of the separation bubble properties and its influence on the performance while designing the intake.
An extensive numerical investigation has been performed to compare the variation of separation bubble size with the supersonic intake performance at different Mach numbers and cowl angles. Local separation bubbles are formed inside the intake when incoming shock waves interact with the boundary layers on the intake surfaces. The main flow physics inside the supersonic intake operating at design condition (M = 2.2) is illustrated using pressure contour plots. Numerical scheliren contour plots at different Mach numbers rather than the operating conditions have been used to visualise the shock structure inside the intake. Flow separations have been analysed both qualitatively and quantitatively using velocity vector plots and variations in wall shear stress along the intake surface, respectively. The net separation size is plotted against the Mach number and various cowl deflections, and it has been observed that the minimum separation size is obtained at M = 2.2 (i.e., the designed operating condition) for various cowl angles. Separation size is decreasing with an increase in cowl deflection, except at a higher Mach number (M = 3). Similarly, flow distortion is also improving when intake is operating at the design condition except for cowl 0
 ${{\rm{\;}}^ \circ }$
. Total pressure recovery reduces with an increase in separation bubble size and gives us a thorough insight into the intake performance. Local deviations are present at certain Mach numbers and cowl angles, which may be resulting from the unsteady effects of SBLI and a reduction in accuracy.
Intake unstart is observed at M = 1.5 on all cowl configurations. It is observed that intake is in started condition at higher cowl angles when Mach number increases. Unstart is observed for M = 2 on cowl angles 0
 ${{\rm{\;}}^ \circ }$
–3
 ${{\rm{\;}}^ \circ }$
and for the designed Mach number (M = 2.2) only at 0
 ${{\rm{\;}}^ \circ }$
cowl angle. Further increase in Mach number resulted in started intake at all cowl configurations. Unstart observed at M = 2 and above for all configurations is associated with a large separation bubble on the ramp and these unstarted conditions are characterised by low TPR. Interestingly maximum separation size and minimum pressure recovery is not observed at an unstarted condition but at M = 3 with 0
 ${{\rm{\;}}^ \circ }$
cowl deflection. At a fixed Mach number, a reduction in net separation bubble size is observed as cowl deflection increases, and correspondingly, TPR improves. When it comes to fixed cowl angle, the net separation size seems to increase as the Mach number deviates from M = 2.2 (the designed operating condition). At a higher Mach number (M = 3), total pressure recovery seems to be independent of net separation size. A consistent correlation hasn’t been reached in case of flow distortion. The variation of flow distortion with changes in net separation bubble size is complex, which denotes that FD is not only characterised by net separation size but also by the number of separation bubbles and their relative positions. Current study reinforces the importance in understanding the position, size, shape and number of separation bubbles formed from shock wave – boundary layer interactions on a supersonic intake.
The effect of positions and number of separations with unsteady effects on intake performance is contemplated to be carried out in the near future.
Data availability
Data will be made available on request.
Acknowledgements
One of us (A.A.) acknowledges his gratitude to the Master’s programme offered by Department of Applied Mechanics, MNNIT Allahabad. The authors acknowledge the financial support received from Anusandhan National Research Foundation (ANRF), India through Core Research Grant (CRG) with project file number CRG/2023/000943.
Competing interest
The authors declare that they have no known competing financial interests or personal relationships that could have appeared to influence the work reported in this paper.