I. INTRODUCTION
Investigations into strengthening mechanisms in metals have demonstrated many different pathways in which the same elemental material can increase its strength. In large systems, standard examples include work hardening, whereby the strength increases due to the evolving dislocation density through the Taylor relation  ,Reference Taylor1 and decreasing grain size to ∼100 nm, whereby strengthening occurs via dislocation pile-ups against grain boundaries, known as the Hall–Petch mechanism.Reference Hall2, Reference Petch3 In addition, in the last ∼5 years it has been demonstrated that strengthening in metals can be achieved by reducing sample dimensions to the micro- and nanoscale.Reference Dehm4–Reference Greer and De Hosson7 Specifically, single crystalline metals containing initial dislocations have been shown to attain much greater strengths compared with bulk as a result of one or more of their external dimensions decreasing to the micron and below dimensions.Reference Nix, Greer, Feng and Lilleodden8 At these small length scales, the strength of cylindrical metallic pillars under uniaxial compression and tension scales with their critical dimensions as σ ∝ Dn, where σ is the pillar flow stress at some characteristic strain, D is the pillar diameter, and n is a value found to lie between −0.5 and −1.0 for face-centered cubic (FCC) metal.Reference Dehm4–Reference Greer and De Hosson7, Reference Dimiduk, Uchic and Parthasarathy9–Reference Volkert and Lilleodden12 In addition to these “1-dimensional” samples, single crystalline metallic thin films on flexible substrates exhibit similar size-dependent mechanical properties, whereby their flow strength scales with the film thickness in a power-law fashion, with the exponent of approximately −0.5.Reference Gruber, Solenthaler, Arzt and Spolenak13, Reference Oh, Legros, Kiener, Gruber and Dehm14
At both the sub-micron and micron scales, several groups have proposed that collective dislocation behavior is responsible for the size effect, with the principal mechanism arising from the operation of truncated dislocation sources, also known as single arm sources, whose strength scales as  , where L is their pinned segment length.Reference Uchic, Shade and Dimiduk5–Reference Greer and De Hosson7, Reference Dimiduk, Uchic and Parthasarathy9, Reference Parthasarathy, Rao, Dimiduk, Uchic and Trinkle15–Reference Norfleet, Dimiduk, Polasik, Uchic and Mills18 The average pinned segment length has been shown by several authors to decrease with decreasing pillar diameter or film thickness leading to higher strengths in smaller-sized structures.Reference Parthasarathy, Rao, Dimiduk, Uchic and Trinkle15, Reference von Blanckenhagen, Arst and Gumbsch19 This mechanism has been demonstrated through analytical models,Reference Dimiduk, Uchic and Parthasarathy9, Reference Parthasarathy, Rao, Dimiduk, Uchic and Trinkle15, Reference Norfleet, Dimiduk, Polasik, Uchic and Mills18 dislocation dynamics simulations in two and three dimensions,Reference Kraft, Gruber, Mönig and Weygand6, Reference Tang, Schwarz and Espinosa20–Reference Senger, Weygand, Gumbsch and Kraft23 and in situ transmission electron microscopy (TEM) testing of Au thin filmsReference Oh, Legros, Kiener, Gruber and Dehm14 and Al wires.Reference Oh, Legros, Kiener and Dehm24
Few works have been published on assessing metallic strengths with critical sample dimensions on the order of ∼100 nm and below, and those that exist reveal a relatively size-independent response of flow strength in both pillarReference Jennings, Li and Greer25, Reference Richter, Hillerich, Gianola, Mönig, Kraft and Volkert26 and thin film geometries,Reference Gruber, Solenthaler, Arzt and Spolenak13, Reference Oh, Legros, Kiener, Gruber and Dehm14 sometimes deforming at nearly theoretical strengths.Reference Richter, Hillerich, Gianola, Mönig, Kraft and Volkert26 In situ TEM investigations have postulated a plasticity mechanism transition from single arm source operation to partial dislocation nucleation from free surfaces and interfaces near ∼100 nm in size.Reference Oh, Legros, Kiener, Gruber and Dehm14, Reference Zheng, Cao, Weinberger, Huang, Du, Wang, Ma, Xia and Mao27 Also, several groups have noticed a transition from size-dependent strength above ∼100 nm to relatively size-independent strength below ∼100 nm,Reference Gruber, Solenthaler, Arzt and Spolenak13, Reference Jennings, Li and Greer25 a transition predicted by Zhu et al.Reference Zhu, Li, Samanta, Leach and Gall28 as a result of the emergence of partial dislocation nucleation as the dominant plasticity carrier. These experiments are corroborated with the results of molecular dynamics (MD) simulations, which also suggest that at these very small length scales, dislocation nucleation from surfaces and interfaces controls deformation.Reference Zhu, Li, Samanta, Leach and Gall28, Reference Deng and Sansoz29 Although numerous computational studies addressing nanowire (NW) deformation exist, the focus of this article is to present our experimental findings on the deformation of sub-600-nm single crystalline Cu nanopillars and then relate these results in the context of reported experimental investigations of NW and thin film deformation. The state of the art overview concerning plasticity in small-scale metallic systems can be found in four recent reviews on small-scale plasticity.Reference Dehm4–Reference Greer and De Hosson7
Here, we examine heterogeneous dislocation nucleation, i.e., nucleation of dislocations from imperfections, in plastically deforming single crystalline pillars with diameters below 600 nm and compare our results with those reported for similar-thickness thin films on compliant substrates. We discuss this deformation behavior in the framework of previously reported in situ TEM investigations, which clearly illustrate that in these small structures, partial dislocations preferentially nucleate from local stress concentrations. We highlight the variety of nanomechanical testing sample fabrication routes reported to date and their resulting initial microstructures, which have been found to have a significant impact on deformation behavior.Reference Dehm4–Reference Greer and De Hosson7, Reference Jennings, Li and Greer25–Reference Zheng, Cao, Weinberger, Huang, Du, Wang, Ma, Xia and Mao27, Reference Burek and Greer30–Reference Dietiker, Buzzi, Pigozzi, Loffler and Spolenak37 We compare our experimental results to the existing models that attempt to explain heterogeneous dislocation nucleation in pillar and thin film geometries. Further, we measure the experimental activation volumes as a means to test the applicability of these models to the deformation of our Cu nanopillars.
II. EXPERIMENTAL
To investigate size effects in pillar geometries, several fabrication routes have been utilized: focused ion beam (FIB) fabrication,Reference Dehm4–Reference Greer and De Hosson7 vapor–liquid–solid growth,Reference Richter, Hillerich, Gianola, Mönig, Kraft and Volkert26 directional solidification,Reference Bei, Shim, George, Miller, Herbert and Pharr33–Reference Shim, Bei, Miller, Pharr and George35 nanoimprinting,Reference Buzzi, Dietiker, Kunze, Spolenak and Loffler36, Reference Dietiker, Buzzi, Pigozzi, Loffler and Spolenak37 cold welding,Reference Zheng, Cao, Weinberger, Huang, Du, Wang, Ma, Xia and Mao27 and electroplatingReference Jennings, Li and Greer25, Reference Burek and Greer30–Reference Jennings and Greer32. FIB-fabricated pillars have been studied most extensively, with average pillar diameters ranging from ∼100 nm up to several microns. This fabrication technique has limitations in that the smallest pillar sizes ∼100 nm are extremely cumbersome to produce and often suffer from FIB damage and substantial vertical taper.Reference Kiener and Minor38, Reference Lowry, Kiener, LeBlanc, Chisholm, Florando, Morris and Minor39 Some of the alternative fabrication routes do not suffer from these limitations. For example, two different sets of single crystalline copper pillars have been produced without the use of FIB,Reference Richter, Hillerich, Gianola, Mönig, Kraft and Volkert26, Reference Burek and Greer30–Reference Jennings and Greer32 creating nearly taper-free samples with diameters as small as 75 nm.
In our studies, single crystalline copper pillars were prepared through a combination of electron beam lithography and electroplating.Reference Burek and Greer30, Reference Jennings, Burek and Greer31 In this procedure, cylindrical holes, with the aspect ratio of the desired pillar geometry, are first patterned on a polymethylmethacrylate (PMMA) substrate via electron beam lithography. This template is then used as the cathode in the electroplating of copper into the prepatterned pores.Reference Jennings, Li and Greer25, Reference Burek and Greer30–Reference Jennings and Greer32 The resulting cylindrical ∼[111] oriented copper pillars are single crystalline and have a non-zero initial dislocation density and a non-negligible surface roughness.Reference Jennings, Burek and Greer31 TEM investigations of the microstructure indicate that the dislocation densities in these pillars are on the order of 1014 m−2 in 100-nm-diameter samples.Reference Jennings, Burek and Greer31 These dislocation densities would be considered as large in bulk samples; however, they are reasonable considering the very small pillar volumes. For example, in a typical ∼100-nm-diameter pillar, a single 2-nm-long dislocation loop results in a dislocation density of ∼1012 m−2, whereas two 100-nm-long dislocation loops give the dislocation density of 1014 m−2.
We perform uniaxial compression tests at a constant nominal strain rate in two different instruments: (i) Agilent G200 nanoindenter (Agilent, Santa Clara, CA) with a 7-μm flat punch in the Dynamic Contact Module and (ii) SEMentor, a custom-built in situ nanomechanical deformation instrument fitted with a ∼10-μm diamond flat punch.Reference Greer, Jang, Kim and Burek40 Although both machines are inherently load controlled, in our experiments a custom-written software method utilizing a feedback loop controls the applied load to maintain a constant displacement rate, and therefore a constant nominal strain rate. We conducted the compression tests at a series of strain rates, ranging between ∼10−4 and ∼100 s−1, which correspond to a displacement rate range of ∼0.1 to ∼1000 nm/s. Although the lower bound of attainable displacement rates of 0.1 nm/s seems unphysical, the load and displacement versus time response is quite robust. Examples of the load and displacement versus time response can be found in Fig. 2 of Ref. Reference Jennings, Li and Greer25, which shows a constant average slope at the measured displacement marked by rapid displacement bursts. Displacement rate of 0.1 nm/s was the smallest displacement rate attempted, and as a result limits the strain rates accessible in the smallest diameter samples.
III. RESULTS
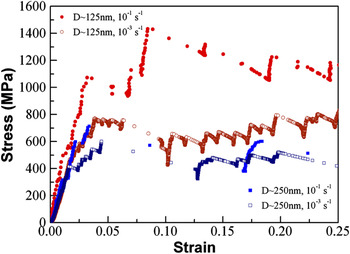
Representative stress–strain curves for the compressions of pillars with diameters of 125 and 250 nm can be seen in Fig. 1. There are two stress–strain curves for each pillar diameter, corresponding to compression tests at two different strain rates: 10−3 and 10−1 s−1. These four curves have a typical stochastic signature with intermittent strain bursts and are examples of two global trends found in Figs. 2 and 3. The first is that at a constant strain rate, smaller pillars reach higher strengths, and the second is that for a constant diameter, faster strain rates result in higher strengths. Further examples of these curves can be found in Ref. Reference Jennings, Burek and Greer31. The stress–strain behavior in these pillars is similar to that reported in other literature on pillar compressions in similar instruments.Reference Uchic, Shade and Dimiduk5–Reference Greer and De Hosson7
Representative stress–strain curves for two different electroplated Cu pillars with diameters 125 and 250 nm. Two different strain rates: 10−1 and 10−3 s−1 are shown for each pillar diameter.Reference Jennings, Li and Greer25 (Reproduced from Ref. Reference Jennings, Li and Greer25 with permission from Elsevier.)

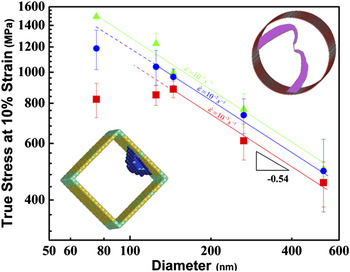
True stress at 10% strain versus pillar diameter at three different strain rates: 10−3, 10−2, and 10−1 s−1. Bottom left inset is an atomistic image for surface source nucleation from a free surface in a square pillar (from Ref. Reference Zhu, Li, Samanta, Leach and Gall28). Top right inset is an atomistic image of two single arm sources in a circular pillar (from C. Weinberger and W. Cai, personal communication). (Reproduced from Ref. Reference Jennings, Li and Greer25 with permission from Elsevier.)

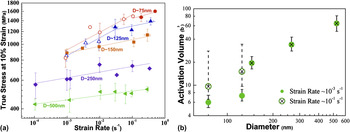
(a) Log–log plot of stress at 10% strain versus strain rate for five different pillar diameters: ∼500, 250, 150, 125, and 75 nm. Lines are fits to the strain rate sensitivity, m. Data replotted from Ref. Reference Jennings, Li and Greer25 with permission from Elsevier (b) Log–log plot of activation volume versus diameter at two different strain rates denoting the change in activation volume for the smallest diameters.

Figure 2 shows a log–log plot of the strength at 10% strain versus pillar diameter for five different samples with diameters between 75 and 525 nm, deformed at different constant strain rates spanning four orders of magnitude. Examining the strength as a function of pillar diameter at the slowest strain rate accessible for all pillar diameters, 10−3 s−1, we find that the largest pillar diameters D ≥ 150 nm obey a power law with the slope of −0.54 similar to ubiquitous reports in the literature on the size dependence of FIB-fabricated pillars.Reference Dehm4–Reference Greer and De Hosson7 Furthermore, at small sizes D < 150 nm, the strength versus size appears to flatten out relative to diameter, power-law slope ≪ −0.5, suggesting that there is a transition to a different deformation mechanism. The transition diameter is defined here as the smallest pillar diameter whose strength can be accurately defined through the power-law scaling seen in larger pillars. At the strain rate of 10−3 s−1, this transition diameter is ∼150 nm. We find that this transition diameter is a strong function of strain rate, with faster strain rates resulting in smaller transition diameters.Reference Jennings, Li and Greer25 For example, for strain rates between 10−3 and 10−1 s−1, the transition diameter shifts from D ∼150 to D ∼75 nm or smaller as seen in Fig. 2 and Ref. Reference Jennings, Li and Greer25.
Data analysis: Measurement of activation volumes
To explore the strain rate dependence, the current authors measured the strain rate sensitivity, m, from the phenomenological dependence of stress on strain rate:  . The results at each pillar diameter can be seen in Fig. 3(a), a log–log plot of flow stress at 10% strain versus applied strain rate, where the lines correspond to the fits of m. There is considerable scatter in the measured strength of small volume pillars.Reference Dehm4–Reference Greer and De Hosson7 As a result, we assume here that each type of stress versus diameter signature seen in Fig. 2, either size-dependent behavior in larger pillars or relatively size-independent behavior in smaller pillars, corresponds to a single strain rate sensitivity regime, taking into account this inherent scatter in these types of measurements. The three largest pillar diameters consistently have strengths well described by power-law behavior and as a result, a single value of m is measured across the range of strain rates tested. This value of m increases from ∼0.027 at 500 nm to ∼0.04 at 150 nm. At the two smallest diameters, two fits for the strain rate sensitivity are plotted, with the transition diameter inferred from Fig. 2. At slow strain rates, the strain rate sensitivity dramatically increases from 0.04 in 150-nm-diameter pillars to ∼0.11 in both 125- and 75-nm pillars. At high strain rates, the increase in strain rate sensitivity is more subdued, corresponding to again ∼0.04 at 150 nm and ∼0.057 at 125 and 75 nm.
This strength versus strain rate data can be used to estimate experimental activation volumes associated with nanoscale plasticity in these structures. The activation volume measured by assuming the shear strain rate is controlled through a dislocation nucleation process, consistent with previous reports in the literature,Reference Zhu, Li, Samanta, Leach and Gall28, Reference Kocks, Argon and Ashby41–Reference Ng and Ngan43 and can therefore be described by an Arrhenius form:

where  is a constant prefactor, Q is the energy barrier, τ is the resolved shear stress, k B is Boltzman’s constant, and T is the temperature. The activation volume, Ω(τ,T), is defined as a change in the activation energy with applied stress. We assume here that the resolved shear stress dominates the deformation mechanism such that the activation volume can be described as
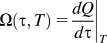 . Rearranging this equation for activation volume results in:

which can be measured from the stress dependence on strain rate at a constant temperature.
The data in Fig. 3(a) represent ∼150 successful compression tests with each point having error bars containing on average approximately five data points. The activation volumes as a function of diameter can be found in Fig. 3(b), where they are plotted for two different strain rates, 10−1 and 10−3 s−1 represented by “X”s and “O”s, respectively. At faster strain rates, 10−1 s−1, the activation volume scales linearly with diameter, as recently reported by Jennings et al.Reference Jennings, Li and Greer25 and as might be expected for single arm sources.Reference Jennings, Li and Greer25 It should be noted that while the observed linear trend is in reasonable agreement with this theory, the predicted and observed magnitudes are substantially different implying the need for further improvements in theoretical investigations. Slower strain rates demonstrate a drop in the activation volumes for the two smallest pillar diameters to below 10b3.Reference Jennings, Li and Greer25 These two diameters, 75 and 125 nm, also experience a deviation from the commonly observed power law, transitioning to a size-independent strengthening regime, suggesting a deformation mechanism transition.
IV. DISCUSSION
A. Experiments on NW deformation
Electroplating copper pillars is not the only fabrication route developed to study size effects in FIB-less geometries. For example, Buzzi et al.Reference Buzzi, Dietiker, Kunze, Spolenak and Loffler36 and Dietiker et al.Reference Dietiker, Buzzi, Pigozzi, Loffler and Spolenak37 both used an embossing method on Ag and Au, respectively, whereby a patterned Si template was pushed into a square platelet of the desired material at elevated temperatures. The metal is then formed into the mold, producing pillars with diameters ranging from ∼150 nm up to several microns.Reference Buzzi, Dietiker, Kunze, Spolenak and Loffler36, Reference Dietiker, Buzzi, Pigozzi, Loffler and Spolenak37 The resulting pillars had different crystallographic orientations, with the smallest pillars D < 200 nm in Au and D < 500 nm in Ag being single crystalline. Larger pillars were a mix of single crystals and polycrystals. The results of these experiments show a clear size effect similar to FIB-fabricated pillars.Reference Buzzi, Dietiker, Kunze, Spolenak and Loffler36, Reference Dietiker, Buzzi, Pigozzi, Loffler and Spolenak37 In fact, Dietiker et al.Reference Dietiker, Buzzi, Pigozzi, Loffler and Spolenak37 shows no substantial difference between Au pillars produced by the FIB and those produced through the embossing method.
Richter et al.Reference Richter, Hillerich, Gianola, Mönig, Kraft and Volkert26 grew pristine [110]-oriented copper NWs through vapor–liquid–solid method with diameters between 75 and 400 nm. In contrast to pillars produced through electroplating, these NWs result in an equilibrium Wulff shape, with atomically smooth side surfaces and virtually nonexistent initial dislocations, resulting in a similar microstructure as the micron-sized wires originally investigated by Brenner.Reference Brenner44 Similar to Brenner’s now-classical results on Cu whiskers, these NWs were pulled in tension and exhibited very large strengths: 2–6 GPa and failed predominantly via brittle fracture.Reference Richter, Hillerich, Gianola, Mönig, Kraft and Volkert26 The size dependence of these wires has been described through Weibull statistics, calculating the probability of finding a defect on the surface or in the wire volume, which would lead to brittle failure.Reference Kraft, Gruber, Mönig and Weygand6 Stress–strain behavior demonstrating the large strengths and subsequent fracture in Richter et al.’s NW experiments can be found in Fig. 4.
Stress–strain curves from tensile tests of pristine single crystalline copper nanowires (NWs) performed by Richter et al.Reference Richter, Hillerich, Gianola, Mönig, Kraft and Volkert26 Stress–strain curves show very high strengths, on the order of 2–6 GPa. (Reproduced from Ref. Reference Richter, Hillerich, Gianola, Mönig, Kraft and Volkert26 with permission from American Chemical Society.)

Uniaxial compression experiments were also performed on Mo–alloy pillars, also produced without the FIB through eutectic solidification.Reference Bei, Shim, George, Miller, Herbert and Pharr33–Reference Shim, Bei, Miller, Pharr and George35 As grown, these square pillars contain zero initial dislocation densities and scanning electron microscopy micrographs appear to have pristine surfaces. As a result, these pillars have a size-independent strength under compression as they all attain nearly theoretical strengths at all sizes.Reference Bei, Shim, George, Miller, Herbert and Pharr33–Reference Shim, Bei, Miller, Pharr and George35
What emerges is that in the pillar and NW tests, there is a clear distinction in the mechanical behavior and deformation between the initially pristine samples and those that contain defects: dislocations and nonatomically smooth surfaces. The truly and nearly pristine samples attain strengths that are very high and nearly size independent, whereas those with defects have lower strengths, with considerable scatter in their measured values. In the former, the failure is catastrophic at near theoretical strengths. In contrast, pillars with initial defects show a mechanism transition: larger samples deform at strengths according to the widely observed power law, and samples with smaller diameters deform at a relatively size-independent strength that is significantly lower than the ideal strength.
Several groups have performed in situ TEM investigations to understand the origins of the deformation mechanisms unique to one-dimensional nanopillar and NW geometries. These investigations revealed two different mechanisms: the operation of single arm sourcesReference Oh, Legros, Kiener and Dehm24 in larger pillars and wires and partial dislocation nucleation in smaller pillars.Reference Zheng, Cao, Weinberger, Huang, Du, Wang, Ma, Xia and Mao27 In the former, 460-nm-wide single crystalline Al wires with rectangular cross-sections were cut by the FIB from nonpristine single crystalline Al films on polyimide substrates. An unobstructed view of the Al wire was obtained by selectively fracturing the polyimide around the viewing area. Tensile straining of these wires unambiguously demonstrated the sequential nucleation of concentric dislocation half-loops emanating from an operating single arm source. Tests at higher strain rates revealed a build up of dislocation density as the dislocation generation rate exceeded their annihilation rate.Reference Oh, Legros, Kiener and Dehm24 Investigations into thinner wires were limited due to the stability of the samples after processing.
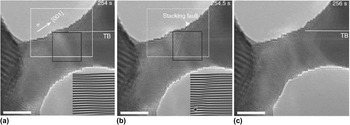
On the opposite end of the size spectrum, in very small Au NWs with diameters of 10 nm and below, high resolution transmission electron microscopy (HRTEM) investigations revealed neck formation and partial dislocation emission under tensile loading.Reference Zheng, Cao, Weinberger, Huang, Du, Wang, Ma, Xia and Mao27 These NWs were produced through the reduction of AuCl (oleylamine) complex on the TEM holder. The Au NWs were loaded into the TEM and attached to an Au substrate through compression cold welding,Reference Zheng, Cao, Weinberger, Huang, Du, Wang, Ma, Xia and Mao27 a process whereby two crystals of the same material bond together without the introduction of external heat such that no interface exists at the “weld” site.Reference Lu, Huang, Wang, Sun and Lou45 These Au NWs have a very complex surface composed of low energy {111} facets.Reference Zheng, Cao, Weinberger, Huang, Du, Wang, Ma, Xia and Mao27 During tensile tests on [001] oriented wires, partial dislocations were noticed to nucleate at local stress concentrators like slip offsets along the wire surface. A series of HRTEM images showing the time progression of these partial dislocation emissions can be found in Fig. 5. Figure 5(a) shows that the initial atomic structure contains surface steps and a twin boundary (TB) intersecting the surface. Figure 5(b) shows the stacking fault left behind after the leading partial dislocation has nucleated, and Fig. 5(c) displays the disappearance of the stacking fault after the trailing partial dislocation is nucleated. NWs with [110] loading orientations were also tested and favored twinning as their deformation mechanism. The authors ascribe this preference for twinning to the large Schmid factor difference in the leading versus trailing partials in [110] tension. The result may be the preference for the repeated nucleation of leading partials on adjacent slip planes as opposed to the nucleation of trailing partials.
High resolution transmission electron microscopy image of a [001] gold NW in tension. (a) Before and (b) after leading partial dislocation nucleation. Inset in (a) and (b) show Fourier-filtered images of the stacking sequence highlighting the stacking fault. (c) After trailing dislocation nucleation. Scale bar is 3 nm. (Reproduced from Ref. Reference Zheng, Cao, Weinberger, Huang, Du, Wang, Ma, Xia and Mao27 with permission from Nature Publishing Group.)

Analyzing the HRTEM images, the authors were able to capture local stress and strain information at the specific site the partial dislocation nucleates. Significantly, the authors find that the local stress at the nucleation site is generally higher than the rest of the pillar demonstrating the important role that stress concentrations have in the nucleation of partial dislocations. For example, the leading partial dislocation shown in Fig. 5(b) nucleated at the intersection of the surface and the TB. Furthermore, in contrast to bulk materials, the dislocations nucleated in these small wires immediately pass through the wire diameter and escape at the opposite surface. This type of dislocation starvation has also been shown in other in situ TEM investigationsReference Kiener and Minor38, Reference Shan, Mishra, Syed Asif, Warren and Minor46 and also in MD simulations of circular gold NWs.Reference Weinberger and Cai47
B. Experiments on thin film deformation on flexible substrates
As described above, the unique deformation mechanisms found in one-dimensional pillar and NW geometries arise due to the reduced sample sizes. It is useful to discuss the deformation mechanisms in two-dimensional structures, i.e., thin films, whose thicknesses are reduced to nanoscale dimensions. Most mechanical tests on single crystalline, as opposed to polycrystalline thin films, have been conducted for samples on stiff substrates, which have been shown to greatly influence the observed mechanical response.Reference Nix48, Reference Freund49 To discuss the deformation mechanisms inherent to small-scale single crystals with minimal added constraining effects of the substrates, here we focus on tensile tests of single crystal Au thin films on flexible polyimide substrates.Reference Gruber, Solenthaler, Arzt and Spolenak13, Reference Oh, Legros, Kiener, Gruber and Dehm14 These thin gold films were prepared by first growing an epitaxial Au film on a single crystal of NaCl followed by the deposition of polyimide on top of the Au layer. Subsequently, the seed NaCl layer was dissolved in water, resulting in the “upside-down” Au film on a flexible substrate. The resulting test samples were [001] oriented, 5-mm wide, 8-mm long, and ranged from 30 nm to nearly 1-μm thick. These samples were not pristine, but contained several initial dislocations, as well as a small number of growth twins and pores in samples with thicknesses below 50 nm as a result of the growth process. Further details of the sample preparation procedure can be found in Refs. Reference Gruber, Solenthaler, Arzt and Spolenak13 and Reference Oh, Legros, Kiener, Gruber and Dehm14.
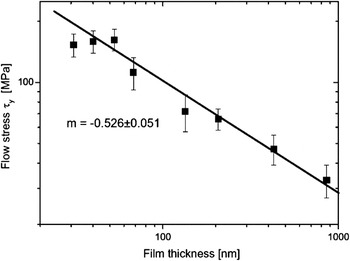
Films with thicknesses ranging from ∼30 to ∼868 nm were tested in tension along the [001] direction. Tensile tests were performed by applying a displacement in steps from 30 to 90 μm up to a total length of 1000 μm, and the total strain was measured via a laser extensometer. In between each extension, Laue patterns were obtained with an exposure time between 15 and 120 s to determine the complete stress state in the films. As a result of the different testing methodology, constant strain rate comparisons are difficult. In contrast to pillar compressions, the resulting stress–strain curves of the films are quite smooth and exhibit no noticeable bursts, likely due to the film’s much larger length and width as compared to pillars.Reference Gruber, Solenthaler, Arzt and Spolenak13 The resulting flow stresses at 0.5% strain are plotted as a function of film thickness in Fig. 6, which shows a log–log plot of stress as a function of thickness. The flow stress reported here is the resolved shear stress on the perfect dislocation slip direction (111)[1-10]. These authors find that for larger film thicknesses, t > 60 nm, the strength follows a power law with the exponent n ∼−0.53, similar to that seen in FIB-fabricated pillars and quite close to that seen in larger electroplated copper pillars. Similarly to the electroplated copper pillars, when the film thickness decreased below a critical value, in this instance t ∼60 nm, the films’ strengths remained constant or even decreased with decreasing film thickness.Reference Gruber, Solenthaler, Arzt and Spolenak13
Resolved shear stress for flow stress at 0.5% strain for single crystalline gold thin films on polyimide substrates. (Reproduced from Ref. Reference Gruber, Solenthaler, Arzt and Spolenak13 with permission from Elsevier.)

To understand the origins of the deformation mechanisms in thin films, Oh et al.Reference Oh, Legros, Kiener, Gruber and Dehm14 performed in situ TEM tensile tests on similar single crystalline gold samples supported by polyimide substrates. In those experiments, five different film thicknesses between 160 and 40 nm were tested and the resulting size-dependent behavior is also measured outside the TEM via x-ray diffraction and the results are similar to that seen in Fig. 6.Reference Oh, Legros, Kiener, Gruber and Dehm14 In these experiments, thicker films, t ≥ ∼80 nm obey a power law with the exponent ∼−0.5, whereas thinner films deform at a relatively size-independent flow stress. In contrast to the ex situ experiments discussed above, these films are subject to additional thermal effects due to the polyimide layer heating up during electron beam exposure.Reference Oh, Legros, Kiener, Gruber and Dehm14 These researchers found that samples with the larger film thicknesses, t > 80 nm, deformed via multiplication and glide of perfect dislocations. Frequently though not always, these perfect dislocations were observed to deposit interfacial segments at the Au/polyimide interface, a deformation mechanism characteristic of thin films on stiff substrates as demonstrated in the Matthews, Blakeslee, Freund, and Nix model.Reference Nix48, Reference Freund49 At large strains, this deposition of threading segments leads to the so-called “cube glide” or glide of [001] dislocations. Also, the authors see evidence of ample dislocation emission from single arm sources pinned at grown-in defects, in this instance growth twins or epitaxial gold nanoparticles. Single arm sources are also seen through in situ tests of pillar geometriesReference Oh, Legros, Kiener and Dehm24 and have been shown to manifest in a size-dependent yield stress.Reference Uchic, Shade and Dimiduk5, Reference Dimiduk, Uchic and Parthasarathy9, Reference Parthasarathy, Rao, Dimiduk, Uchic and Trinkle15, Reference Norfleet, Dimiduk, Polasik, Uchic and Mills18, Reference Tang, Schwarz and Espinosa21, Reference Weygand, Poignant, Gumbsch and Kraft22
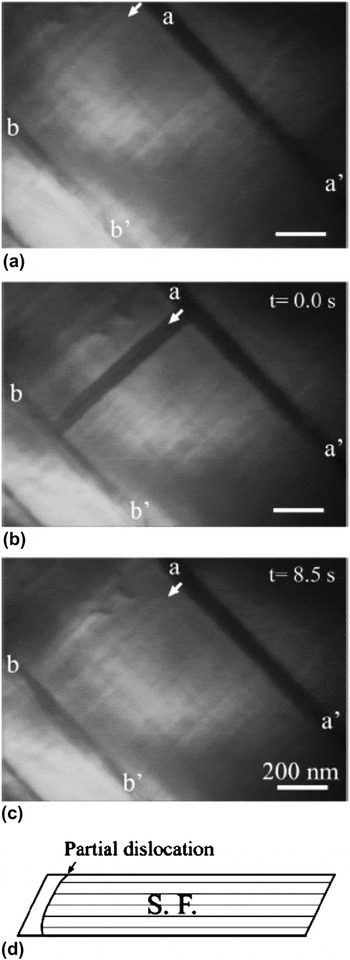
In thinner films, t ≤ ∼80 nm, the glide of threading dislocations still contributes to deformation; however, these dislocations no longer deposit interfacial segments. Furthermore, the authors note that partial rather than perfect dislocation nucleation becomes the dominant deformation mechanism, whereby these partial dislocations predominantly nucleate at stress concentrations at the internal interfaces: square pores, twins, and surfaces defects, produced during film growth. An example of partial dislocation emission at a TB is shown in Fig. 7. Figure 7(a) shows the crystal prior to dislocation emission, whereas Fig. 7(b) shows the stacking fault after the leading partial has nucleated and passed through. The time difference between Figs. 7(a) and 7(b) is 1 frame or 0.4 s, an amount of time sufficient to obscure the mechanistic details. Figure 7(c) shows the trailing partial emitted from the same location 8 s later and the subsequent annihilation of the stacking fault.Reference Oh, Legros, Kiener, Gruber and Dehm14
(a)–(c) Successive transmission electron microscopy images of partial dislocation nucleation. (a) Initial state. (b) 0.4 s after initial state showing a stacking fault extending between twins a-a’ and b-b’. (c) 8.5 s later the stacking fault closes. (d) Schematic of nucleation process. (Reproduced from Ref. Reference Oh, Legros, Kiener, Gruber and Dehm14 with permission from Elsevier.)

C. Dislocation starvation
These and several other in situ TEM investigations in pillars and thin films have provided insight into how the behavior of individual dislocations changes as a function of size.Reference Kiener and Minor38, Reference Shan, Mishra, Syed Asif, Warren and Minor46 Separate in situ investigations have shown that not only does the individual dislocation behavior change but also the collective dislocation behavior changes with critical thickness. As the critical length scale decreases, dislocations no longer tend to form substructures; instead they readily escape at free surfaces, which result in the crystal becoming starved of dislocations.Reference Kiener and Minor38, Reference Shan, Mishra, Syed Asif, Warren and Minor46 This concept of dislocation starvation was first introduced by Greer and NixReference Greer and Nix50 to explain the deformation behavior of nanoscale Au pillars, and post-deformation TEM behavior on nanoscale samples has suggested its operation.Reference Jennings, Burek and Greer31, Reference Greer and Nix50 Most convincingly, this phenomenon was demonstrated during in situ TEM compressions of Ni pillars with diameters at or below ∼200 nm.Reference Shan, Mishra, Syed Asif, Warren and Minor46 In those experiments, the dislocations likely produced by the FIB damage and escape the sample resulting in a significant reduction of the dislocation density in a process coined as “mechanical annealing.”Reference Shan, Mishra, Syed Asif, Warren and Minor46 A similar set of in situ TEM compressions performed by a subset of the same team of researchers also observed this phenomenon in smaller [001] oriented copper pillars.Reference Kiener and Minor38 In these experiments, strengthening after the yield point was associated with a decreasing dislocation density. The authors postulate that as a result of fewer dislocations being present in the pillar, higher strength dislocation sources are required to sustain deformation. The lack of dislocation multiplication via double cross-slip processes and substructure formation, as would be the case in bulk crystal deformation, is unique to this nanometer length scale and increases the likelihood that dislocation nucleation from alternative sources contributes substantially to deformation. In pillars and thin films, a prime candidate as an alternative source of dislocation becomes heterogeneous dislocation nucleation as the surface to volume ratio increases with decreasing pillar diameter or film thickness.
Thin film geometries have only one dimension reduced to the nanometer scale, their thicknesses, and therefore might be expected to also experience dislocation starvation; however, the constraints imposed by the supporting substrates lock the mobile dislocations into the film, thereby hindering starvation effects.Reference Gruber, Solenthaler, Arzt and Spolenak13, Reference Oh, Legros, Kiener, Gruber and Dehm14 In addition, extensive cross-slip has been observed during in situ experiments on thin films, which may further effect starvation.
Dislocation starvation model
A model based on the balance between nucleation and annihilation rates of dislocations at surfaces in circular pillars was recently developed by Nix and Lee.Reference Nix and Lee42 This relatively simple phenomenological model describes the physics of pillar compressions through a kinetic law:

where  is the shear strain rate, μ corresponds to the shear modulus,
 is the shear loading rate, b is the Burgers vector,
 is the average dislocation velocity, and ρ m is the mobile dislocation density. Equation (3) describes the shear strain rate as composed of two terms corresponding to the elastic loading term and the subsequent plastic deformation term. Through the comparison of the rates of dislocation nucleation and annihilation at a free surface, these authors derive an equation for the stress required to maintain a constant shear strain rate as:

where τ ss corresponds to the steady state applied shear stress, τ th is the theoretical shear stress, D is the pillar diameter, and ω o is the nucleation frequency at the theoretical shear stress.Reference Nix and Lee42 Notably, the stress here depends on both the pillar diameter through D −m and on the strain rate as  suggesting that as pillar diameter becomes smaller or the strain rate increases, higher stresses will be required to maintain steady state deformation. Further, the size-dependent strength and strain rate dependence are linked through the exponent m. In larger pillars, where the size-dependent strength obeys a power law with exponent between −0.5 and −1.0 the resulting value of the strain rate sensitivity is of 0.5–1, unreasonably large values for FCC metals.
Applying this analytical framework to our experiments on Cu nanopillars, we see good agreement in regard to the expected strain rate sensitivity and diameter-dependent strength. Substituting our experimentally determined strain rate sensitivity of ∼0.1 for the 125- and 75-nm pillar diameters at the slowest strain rates of 10−3 s−1 into Eq. (4), we find the corresponding strength dependence on diameter of ∼−0.1 a reasonably weak strength dependence on diameter, which compares favorably with our smallest samples, as well as with the results of investigations presented here and other theoretical works.Reference Gruber, Solenthaler, Arzt and Spolenak13, Reference Oh, Legros, Kiener, Gruber and Dehm14, Reference Jennings, Li and Greer25, Reference Zhu, Li, Samanta, Leach and Gall28 Although this phenomenological model accurately captures the correlation between strain rate dependence, size, and strength, it cannot explore the details of dislocation nucleation. Therefore, we next discuss atomistic models that attempt to capture the physics and the stresses required for partial dislocation nucleation.
D. Partial dislocation nucleation models
Two different models for heterogeneous nucleation of dislocations in FCC metallic thin films and pillars have been reported.Reference Gruber, Solenthaler, Arzt and Spolenak13, Reference Oh, Legros, Kiener, Gruber and Dehm14, Reference Zhu, Li, Samanta, Leach and Gall28 Despite the differences in sample geometries between these models and our samples, it is reasonable to expect that the governing mechanisms in both small-scale structures are similar.
1. Classical dislocation source model
The model recently published by Chen et al.Reference Chen, Ma, Hemker, Sheng, Wang and Cheng51 provides an estimate for the transition diameter between perfect and partial dislocation nucleation at grain boundaries in nanocrystalline Al. The shear stress to expand a partial dislocation with the Burgers vector b p and the stacking fault energy γ SF is correspondingly written as:

The stress to expand a perfect dislocation loop is:

Here, τ p is the resolved shear stress to operate a partial dislocation source, α is a coefficient, between 0.5 and 1.5, reflecting to the orientation dependence of the line energy, μ is the shear modulus, bN is the perfect Burgers vector, and D/2 is the critical radius for this dislocation source where D is the critical length scale, originally grain sizeReference Chen, Ma, Hemker, Sheng, Wang and Cheng51 but recently extended to film thickness.Reference Gruber, Solenthaler, Arzt and Spolenak13, Reference Oh, Legros, Kiener, Gruber and Dehm14 This simple model compares the strength to operate a Frank–Read source emitting a perfect dislocation loop versus a partial dislocation and an accompanying stacking fault as function of the critical length scale. By setting Eqs. (5) and (6) equal to each other, these authors find the critical length scale for the transition.

This model has been extended more recently to single crystalline Au filmsReference Kraft, Gruber, Mönig and Weygand6, Reference Gruber, Solenthaler, Arzt and Spolenak13, Reference Oh, Legros, Kiener, Gruber and Dehm14 to explain the observed transition in strength as a function of film thickness, as seen in Fig. 6. This partial dislocation nucleation model captures the trend in observed strength reasonably well.Reference Kraft, Gruber, Mönig and Weygand6, Reference Gruber, Solenthaler, Arzt and Spolenak13, Reference Oh, Legros, Kiener, Gruber and Dehm14, Reference Chen, Ma, Hemker, Sheng, Wang and Cheng51 However, in the case of Au thin films on polyimide this model overpredicts the stresses by a factor of >2 which the authors hypothesize may be due to defects enabling lower strengths for partial dislocation nucleation.Reference Gruber, Solenthaler, Arzt and Spolenak13 Frank–Read and single arm source operation requires the existence of a pinned dislocation segment; however, in single crystals, partial dislocation nucleation appears to operate in the absence of such sessile dislocation segments. In fact, as shown previously, the existing in situ TEM studies suggest that partial dislocations nucleate at external surfaces or internal interfaces.Reference Oh, Legros, Kiener, Gruber and Dehm14, Reference Zheng, Cao, Weinberger, Huang, Du, Wang, Ma, Xia and Mao27 In the absence of a pinned dislocation segment, the critical length scale, D, is not necessarily associated with the film thickness. Rather, atomistic and analytical models studying homogeneous nucleationReference Aubry, Kang, Ryu and Cai52 and heterogeneous dislocation nucleationReference Zhu, Li, Samanta, Leach and Gall28, Reference Beltz and Freund53, Reference Weinberger, Jennings, Kang and Greer54 showed much smaller critical dislocation loops, with the critical radius on the order of a few nanometers. Such a small critical radius further suggests an important contribution from thermal effects. Including thermal effects would result in lowering the strength necessary for dislocation nucleation, an effect possibly manifested as the larger transition diameter found in in situ thin film studies versus ex situ tests.
2. Heterogeneous dislocation nucleation
Zhu et al.Reference Zhu, Li, Samanta, Leach and Gall28 recently investigated the probabilistic nature of thermally activated surface dislocation nucleation through the development of a general analytical model. This model requires the knowledge of the thermal activation parameters: activation energy and activation volume, to make predictions regarding specific nucleation processes. These activation parameters were then determined through fixed end nudged elastic band (FENEB) method, in square Cu nanopillars.Reference Zhu, Li, Samanta, Leach and Gall28 In their analytical model, the nucleation frequency, v, of a given site is taken to have an Arrhenius form as in Eq. (1) where v is substituted for shear strain rate,  . Then, to describe the probabilistic nature of thermal activation, they define a survival probability, f(t), as the fraction of a set of pillars that have not nucleated a dislocation by a time t. The change in f(t) is related by the nucleation frequency, v, through:
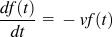 . The most probable time that a NW will nucleate a dislocation can then be found by finding the maximum of
 . The resulting equation describes the most likely time at which a pillar will nucleate a dislocation; however, in experiments, a more relevant measure is applied stress. The survival probability analysis can be re-written in terms of the applied stress by relating time and stress through the elastic modulus and applied strain rate:
 . Rearranging the above and linearizing the result for clarity, we find that the activation stress can be represented as:

Here, the first term, σ athermal, corresponds the athermal stress or the stress required to nucleate a dislocation at zero temperature. The second term comprises the thermal contribution to nucleation stress where k B is Boltzman’s constant, T is temperature, N is the number of equivalent nucleation sites, ν o is the atomic vibration frequency, E is the Young’s modulus, and  is the applied strain rate. This term is dominated by the constant prefactor outside the logarithm and will be large at high temperatures and small activation volumes.
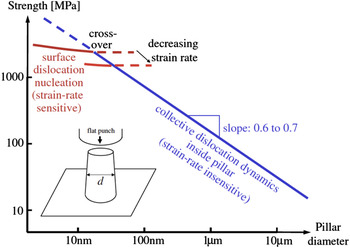
Zhu et al.Reference Zhu, Li, Samanta, Leach and Gall28 determined the activation parameters for surface source nucleation in an initially perfect square [001] Cu wire through an atomistic FENEB calculations. The predicted size-dependent stresses are shown in Fig. 8. The expected size effect due to partial dislocation nucleation is quite weak with the exponent of ∼0.1–0.2 related to the number of equivalent sites N inside the logarithm. This weak size effect reflects well the observed trend in experimental literature on thin filmsReference Kraft, Gruber, Mönig and Weygand6, Reference Gruber, Solenthaler, Arzt and Spolenak13, Reference Oh, Legros, Kiener, Gruber and Dehm14 and, more recently, in pillar compressions.Reference Jennings, Li and Greer25 Furthermore, they estimate the transition diameter to be between 10–100 nm and to depend on strain rate, both of which are in reasonable agreement with our experiments on pillars and those discussed on thin films. These authors’ calculations find the activation volumes for surface source nucleation to be within the range of 1–10b3, which extends a range from nucleation at a sharp corner (∼1b3) to the flat side of the NW (∼10b3).Reference Zhu, Li, Samanta, Leach and Gall28 These small activation volumes correlate well with the ones we find in our pillar experiments as seen in Fig. 5 in Ref. Reference Jennings, Li and Greer25 and result in a large thermal contribution to strength as seen in Eq. (8).
Log–log plot of strength versus diameter showing the predicted transition from collective dislocation dynamics to surface source nucleation. (Reproduced from Ref. Reference Zhu, Li, Samanta, Leach and Gall28 with permission from American Physical Society.)

The two models above, the classical source model and heterogeneous dislocation nucleation model, differ in their assumption of the state of the crystal prior to partial dislocation nucleation. The classical source model assumes the pre-existence of a pinned dislocation segment, whereas the heterogeneous nucleation model does not. As a result of this assumption, the expected activation volumes of the two processes are drastically different. The classical source model is Frank–Read type model and would therefore likely result in an activation volume on the order of 100–1000b3,Reference Estrin, Kim and Nabarro55–Reference Zhu and Li58 whereas the heterogeneous nucleation model results in activation volumes between 1 and 10b3 is in good agreement with our pillar compressions.Reference Jennings, Li and Greer25 This discrepancy between the activation volumes of the classical source model and the measured activation volumes suggests that the heterogeneous dislocation model may be a more accurate depiction of the nucleation physics during pillar compressions.
E. Effects of imperfections on dislocation nucleation
TEM studies on partial dislocation nucleation have highlighted the role that various defects play in dislocation nucleation. This is most obvious in the case of thin films where dislocations preferentially nucleate at square voids as they serve as sites of stress concentrations during tensile experiments.Reference Gruber, Solenthaler, Arzt and Spolenak13, Reference Oh, Legros, Kiener, Gruber and Dehm14 Furthermore, partial dislocation nucleation at TBs has also been observed in both thin films and NWs.Reference Oh, Legros, Kiener, Gruber and Dehm14, Reference Zheng, Cao, Weinberger, Huang, Du, Wang, Ma, Xia and Mao27 This preference for nucleation at stress concentrations has also been observed in recent MD simulations of bulk nanotwinned copperReference Li, Wei, Lu, Lu and Gao59 and twinned NWs.Reference Deng and Sansoz29 In large-scale MD simulations of a bulk nanotwinned sample, dislocation emission is strongly preferred at the intersection of TBs and grain boundaries, which are characterized by local stress concentrations.Reference Li, Wei, Lu, Lu and Gao59 Similar results were found in MD simulations of twinned nanopillars, where partial dislocations preferentially nucleate at the intersection of the TB and the NW surface.Reference Deng and Sansoz29 This last type of stress concentration has been observed experimentally in gold NWs, as shown in Fig. 5. Further, in these in situ experiments, the pillar surface is characterized by the intersection of distinct {111} planes resulting in a faceted surface along the NW length promoting nucleation through stress concentrations at the kinks in NW surface and surface steps.Reference Zheng, Cao, Weinberger, Huang, Du, Wang, Ma, Xia and Mao27 All this evidence for the preference of heterogeneous dislocation nucleation at inhomogeneities also corroborates the work of Richter et al.Reference Richter, Hillerich, Gianola, Mönig, Kraft and Volkert26 In the absence of surface defects or internal dislocations, failure via brittle fracture is more energetically favorable than dislocation nucleation from a pristine surface.
In our pillar tests, the surface roughness also likely affects the local surface stress state. In tension, surface roughness may be expected to create stress concentrations similar to a crack tip with the initial crack length controlled by the local roughness; however, the experiments presented here were performed in compression, likely posing a more subtle influence of surface roughness on the local stress state. Tensile tests on similar electroplated copper pillars showed deformation through immediate necking.Reference Jennings and Greer32 Comparisons of these same pillars under both tension and compression did not demonstrate a tension–compression asymmetry suggesting that in these pillars the surface roughness did not act as a crack tip, further emphasizes the subtle influence the surface roughness may play.Reference Jennings and Greer32
It should be noted that the strengths of these pillars always showed size-dependent strength; however, the effects of a constant displacement rate, as opposed to a constant strain rate, and the relatively few samples tested precludes a definitive conclusion. Further, as the critical dislocation nucleation radius is on the order of a few nanometers,Reference Zhu, Li, Samanta, Leach and Gall28, Reference Beltz and Freund53, Reference Weinberger, Jennings, Kang and Greer54 variations over these small distances such as individual surface steps may play a key role in determining a material’s resistance to heterogeneous dislocation nucleation.
F. Partial versus perfect dislocation nucleation
Our discussion up to this point has been dominated by heterogeneous partial dislocation nucleation at internal surfaces or interfaces. The preference for partial dislocation nucleation as opposed to perfect dislocation nucleation is primarily due to the low stacking fault energy of the materials tested so far: Au and Cu. In single crystals of low stacking fault materials, perfect dislocations readily split into ribbons bounded by the leading and trailing partials as this configuration has a lower energy. In metals with high stacking fault energies, perfect dislocations dominate deformation as the energy does not decrease through the separation of partials. The details of this preference for perfect versus partial dislocation nucleation have been discussed in the MD simulations of nanocrystalline materials, where it has been shown that the choice between perfect and partial nucleation depends critically on the complete generalized stacking fault curve.Reference Van Swygenhoven, Derlet and Froseth60 As Au and Cu both have low stacking fault energies, it is not surprising that partial rather than perfect dislocation nucleation has been experimentally observed. Further experimental and theoretical investigations into FCC metals with high stacking fault energies, like Al or Ni, will help elucidate the specific role stacking fault energy plays in nanoscale plasticity.
V. SUMMARY
We discuss the role of heterogeneous nucleation of partial dislocations at local stress concentrators found on the surfaces and interfaces of nanosized pillars and films on plastic deformation. Our experiments on single crystalline Cu nanopillars, as well as other experimental studies on thin films demonstrate a transition in size-dependent strength when the critical length scale dips below ∼100 nm. At this size, the strength becomes independent of size and deviates from the commonly observed power law. In situ TEM tests on thin films and NWs reveal the likelihood that this observed transition results from a change in preference from perfect dislocation multiplication through internal source operation to partial dislocation nucleation from local inhomogeneities on the surfaces and interfaces like voids, TBs, and surface roughness. These findings help explain the lower strengths for pillars and thin films containing initial defects in contrast with the much higher strengths exhibited by pristine and nearly pristine small-scale geometries. We finally discuss the combined strain rate and size-dependent experimental data in the context of several models concerning partial dislocation nucleation and combined through comparisons of activation volumes.
ACKNOWLEDGMENT
The authors gratefully acknowledges the financial support of the National Science Foundation through ATJ's NSF Graduate Research fellowship and JRG's CAREER grant (DMR-0748267).