
I. INTRODUCTION
Magnesium alloys are attractive for applications in automobile and aerospace industries due to their high specific strength. Reference Antion, Donnadieu, Perrard, Deschampa, Tassin and Pisch1–Reference Li, Fu, Peng, Wang and Jiang9 However, further uses of conventional Mg alloys are limited due to the challenge in meeting the requirements of room temperature mechanical properties, creep resistance, and strength. To enhance the strength of pure Mg, alloying and subsequent heat treatment are generally used. The rare earth (RE) elements, Nd, Gd, Sm, Dy, and Y, for example, can enhance the mechanical properties of the Mg alloys because of the solid solution and precipitation hardening. Reference Antion, Donnadieu, Perrard, Deschampa, Tassin and Pisch1–Reference Li, Fu, Peng, Wang and Jiang9 Therefore, Mg–RE alloys generally present high performance both at room temperature and high temperature. Among them, Mg–Gd and Mg–Nd system alloys are widely studied and used, while the former system alloys are expensive with a high content of heavy RE elements and the latter system alloys are relatively cheap with low content of RE elements. In addition, with addition of Zn, Mg–Nd–Zn alloys show higher strength, good biocompatibility, good ductility, and creep resistance. Reference Fu, Peng, Jiang, Chang and Zhai3–Reference Qin, Zhao, An, Cheng, Wang, Cheng, Wang, Wang, Jiang, Zhang and Yuan8 Therefore, Mg–Nd–Zn alloys are also a potential biodegradable material.
Generally, Mg–Nd–Zn alloys were produced by permanent mold casting (PMC) and low-pressure sand mold casting. However, previous studies indicated that the resulting alloys fabricated by permanent mold casting contained a few porosities, and the grain size of the alloys fabricated by sand mold casting was coarser than that cast by permanent mold. Reference Fu, Peng, Jiang, Ma and Zhai6 By contrast, rheoforming can significantly decrease the porosities and grain size compared with the traditional casting techniques. Reference Flemings10,Reference Canyook, Wannasin, Wisuthmethangkul and Flemings11 Moreover, a uniform distribution of intermetallic eutectic compounds can be obtained after rheoforming. It is a promising casting technology for forming near-net–shaped components of high integrity and performance.
For the rheoforming process, one key topic is the preparation of ideal nondendritic semisolid slurries. The semisolid slurry can be obtained by using external fields such as twin screw shearing, Reference Xia, Huang, Cassinath and Fan12 gas bubble stirring, Reference Wannasin, Canyook, Wisutmethangoon and Flemings13,Reference Zhang, Wu, Liu, Zhang, Pang and Ding14 ultra-sonic vibration, Reference Wan, Yan and Xu15 and electromagnetic stirring (EMS). Reference Lu, Wu, Wan and An16–Reference Chen, Zhang, Liu, Wu and Ding19 Among them, EMS is widely used and it is also suitable for the preparation of Mg–RE alloy semisolid slurry such as Mg–Gd–Zn alloy Reference Wang, Chen, Zhang, Wu and Ding18 and Mg–Nd–Zn alloy. Reference Chen, Zhang, Liu, Wu and Ding19 Another key procedure is the subsequent shaping process. Comparing with the commonly used rheo-die casting process, the rheo-squeeze casting (RSC) process can decrease porosities because of the slower mold filling and solidification under high applied pressure. For example, Zhang et al. Reference Zhang, Wu, Liu, Zhang, Pang and Ding14 prepared the AZ91-2 wt% Ca (AZX912) alloy semisolid slurry by using the gas bubbling process, and then shaping by squeeze casting. The resultant showed that the grain was well refined and the porosity was reduced, thus the mechanical properties of the alloy were improved. Fang et al. Reference Fang, Lü, Zhao, Wang, Liu and Wu20 found that high performance Mg–3RE–6Zn–1.4Y alloys could be obtained by RSC process combining with direct ultrasonic vibration. The microstructure of the alloy was fine and uniform. Guo et al. Reference Guo, Zhang, Yang, Liu and Jin21 reported that high performance Mg–9Al–Zn alloys with fine and compact microstructure were obtained after RSC process. It is expected that further heat treatment can significantly enhance the mechanical properties of the RSC alloys due to the solid solution and precipitation hardening. However, the related investigations about this were very scarce.
In the present work, EMS and squeeze casting were combined together for rheoforming of the Mg–3Nd–0.2Zn–0.4Zr (NZ30K) alloy. Semisolid slurry of the alloy was produced by EMS process and then shaping by direct squeeze casting. The purpose of this study was to study the effects of applied pressure on the microstructure and mechanical properties of the RSC NZ30K alloy and to investigate the different strengthening contributions between the PMC and RSC alloys. Furthermore, the influence of applied pressure and undercooling on the nucleation rate was discussed on the basis of the Clausius–Clapeyron equation.
II. EXPERIMENTAL PROCEDURE
The Mg–3Nd–0.2Zn–0.4Zr (nominal composition, wt%) alloy was produced by using high-purity Mg and Zn ingots (≥99.9%), Mg–30 wt% Zr, and Mg–90 wt% Nd master alloys. The Mg ingot was melted in a steel crucible which is heated in an electrical resistance furnace under the protection of a mixed atmosphere of CO2 and SF6. When the Mg alloy melt temperature reached 680 and 730 °C, the high-purity Zn ingot and Mg–Nd master alloy were put into the steel crucible, respectively, followed by manual stirring for three min. To allow the RE element to completely dissolve, the alloy melt was then maintained at 780 °C for 30 min. At the temperature of 760–780 °C, the Mg–Zr master alloy was added into the melt. After it was purified by 1.5% JDMJ flux (main compositions of 40–50% MgCl2, 15–25% KCl, 3–5% BaCl2, 15–20% NaCl, and 5–10% CaF2), the melt was maintained at 780 °C for 30 min before casting. The molten metal was poured into a steel mold preheated to 200 °C. The actual chemical compositions of the alloy (Mg–3.3Nd–0.21Zn–0.41Zr) were analyzed by Inductively Coupled Plasma Atomic Emission Spectroscopy (ICP-AES).
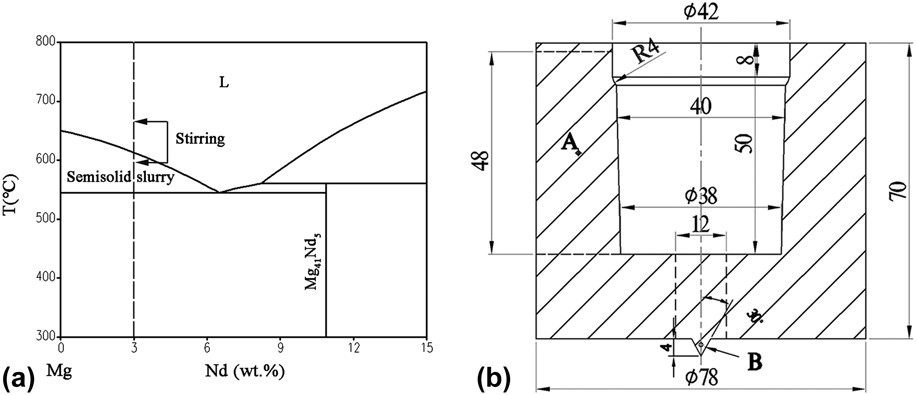
EMS was used to prepare NZ30K alloy semisolid slurry. Reference Chen, Zhang, Liu, Wu and Ding19 The melt was cool down to 670 °C each time, and then the crucible was put into the preheated EMS furnace (maintained at 500 °C) to be treated using rotational magnetic field. The Mg–Nd binary phase diagram is presented in Fig. 1(a) to help understand the preparation of semisolid slurry. The stirring time, applied voltage, and rotational frequency were 120 s, 350 V, and 20 Hz, respectively. To observe the microstructure of semisolid slurries, samples with sizes of Φ10 × 50 mm3 were obtained from the 1/2 radius of the crucible and then quickly quenched into water at room temperature. After being treated by EMS, the semisolid slurry was subsequently shaped by direct squeeze casing process under different applied pressures (0, 40, 80, and 120 MPa) at a mold temperature of 300 °C. For comparison, the slurry without EMS treatment was obtained and the NZ30K alloy was also prepared by PMC technique at a pouring temperature of 740 °C.
(a) Schematic of the Mg–Nd binary phase diagram; (b) schematic of the components produced by RSC process. The tensile test samples were cut from the dotted line position (unit: mm).

The schematic of component produced by RSC process is shown in Fig. 1(b). To obtain the solid fraction and identify the primary particles and secondarily solidified particles (solidified from residual liquid phase in semisolid slurry), a tip part was designed at the bottom center of the component. Specimens cut from the RSC alloys were solution-treated at 530 °C for 10 h and quenched, followed by aging at 200 °C for 16 h in an oil bath. The PMC samples were solution treated at 540 °C for 6 h, quenched, and then aged at 200 °C for 16 h. Rectangular tensile samples with dimensions of 10 mm width, 1.5 mm thickness, and 18 mm gauge length were prepared by using an electric-sparking wire-cutting machine. Tensile testing was carried out on a Zwick/Roell Z100 (Zwick Roell Group, Ulm, Baden–Württemberg, Germany) material test machine at a cross-head speed of 0.5 mm/min. One cross-section of each sample was ground and polished, followed by etching using a nital solution. Subsequently, the microstructure characterization was observed with an optical microscope (OM; ZEISS Axio Observer A1, ZEISS, Oberkochen, Germany), a scanning electron microscope (SEM; Phenom XL, Phenom, Shanghai, China), and a transmission electron microscope (TEM; JEOL-2100F, JEOL Ltd., Tokyo, Japan) operating at 200 kV. Phase analyses were examined by using an X-ray diffractometer (XRD; D/max 2550V, Rigaku Corporation, Tokyo, Japan) with a detected speed of 4°/min. Density of the samples was measured based on Archimedes’ principle. Quantitative metallographic analysis was carried out by quantitative image analysis software. The grain size was measured from the obtained OM micrographs, and it was determined by the linear intercept method using the equation D = L/(NV), where L is the total length of test line, N is the number of intercepts, and V is the magnification of the photomicrograph. The shape factor (defined as c 2/4πS, where S is the area of the particle and c is the perimeter) was used to describe the roundness of the solid particles. If the particles are perfectly spherical, the shape factor has a value of 1; it increases for less spheroidal particles. At least three typical images on each sample were measured.
III. RESULTS
A. Microstructure of semisolid slurry
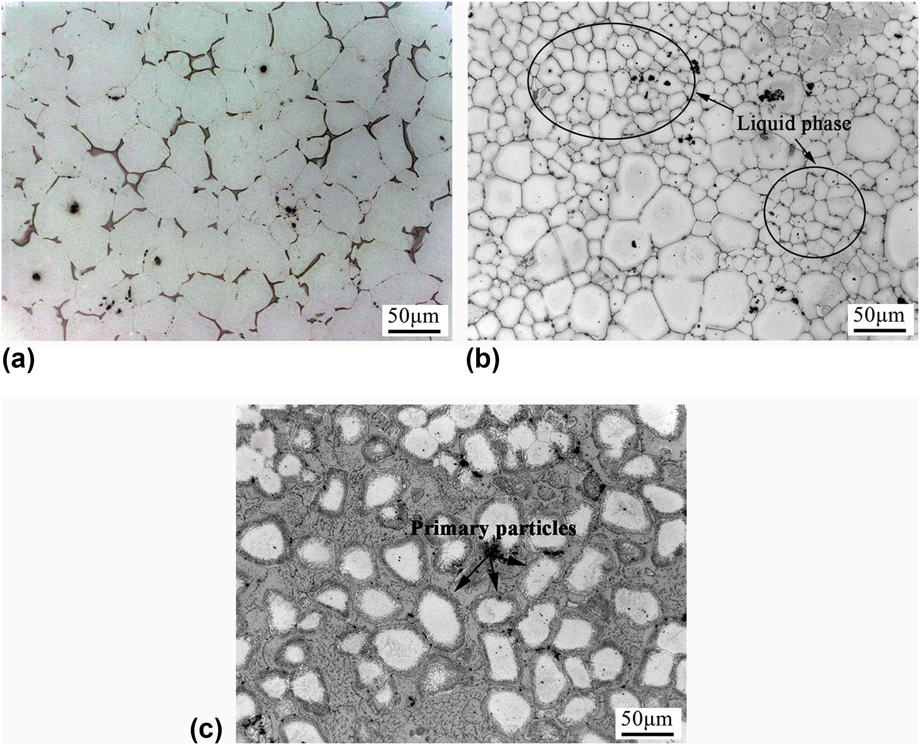
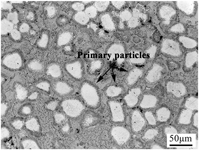
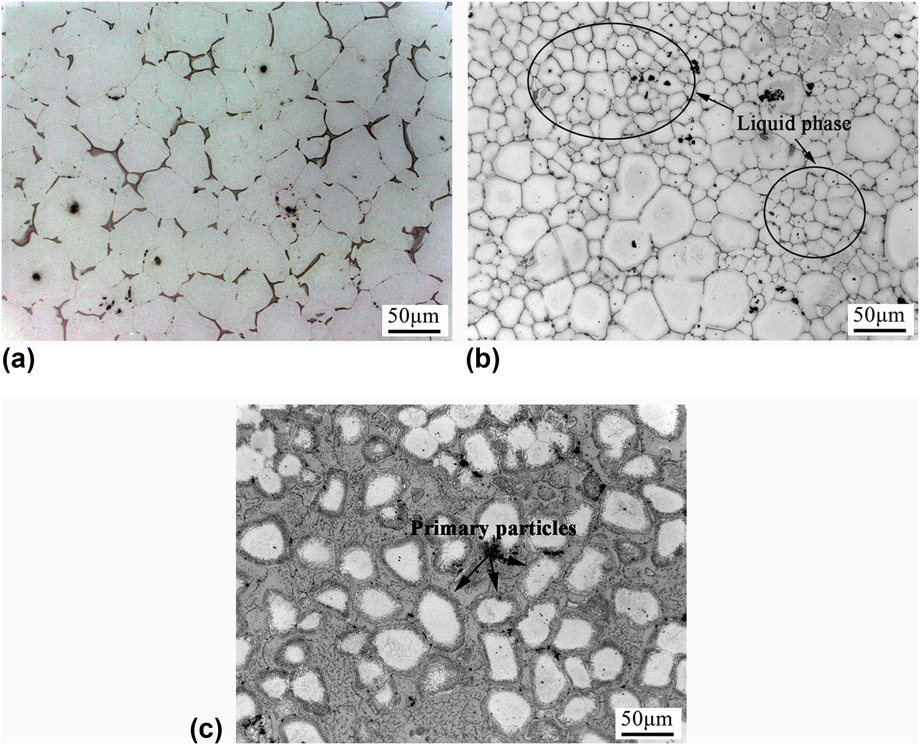
It is known that an ideal semisolid microstructure with small and spheroidal primary particles surrounded by liquid phase is the origin of semisolid forming. Reference Flemings10 Thus, it is necessary to verify that if the NZ30K alloy used in this work can obtain such a semisolid microstructure after EMS treatment. Figures 2(a) and 2(b) show representative micrographs of quenched NZ30K alloy slurries without and with EMS treatment, respectively. The particles are small and spheroidal due to the addition of powerful grain refiner of Zr, and the primary α phase is dispersed in a matrix of finer particles and eutectic structure [Figs. 2(a) and 2(b)]. Without EMS treatment [Fig. 2(a)], the primary particles and secondarily solidified grains (solidified from residual liquid phase in slurry) are connected together, and it is difficult to identify them. With EMS treatment [Fig. 2(b)], the nearly spherical primary α-Mg particles are suspended in the liquid phase (smaller particles), and they are expected to grow up through ripening during stirring. Reference Chen, Zhang, Liu, Wu and Ding19 The average particle size is much smaller than that without EMS treatment, which indicates that EMS has a remarkable influence on grain refinement. In addition, the particles with size smaller than 30 μm can be regard as those ones solidified from the residual liquid phase in the semisolid microstructure. After RSC, the solidification of the semisolid slurry is quite fast in the position B in Fig. 1(b), and the microstructure almost kept unchanged [Fig. 2(c)]. It can be obtained that the solid fraction is about 50.4% at the beginning of squeeze casting, and it is suitable for RSC.
Representative micrographs of NZ30K alloy slurries: (a) without EMS; (b) with EMS; (c) as-cast semisolid microstructure in the position B in Fig. 1(b).
B. Microstructure and mechanical properties of as-cast RSC alloys
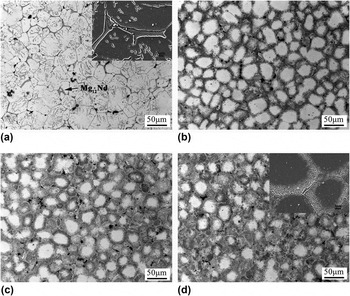
Figure 3 presents the as-cast microstructures of NZ30K alloys prepared by RSC process under different applied pressures. When the pressure is not applied [Fig. 3(a)], some grains are visible within particles (gray needle-like Mg12Nd phase) and they disappear with the application of pressure [Figs. 3(b)–3(d)]. With the increase of pressure, the primary particles connect with each other and the secondarily solidified particles gradually transform to irregular ones. This reveals that the plastic deformation occurred between the neighboring particles became more severe with the increase of pressure. In addition, the amount of secondarily solidified particles and eutectic structure is decreased with increasing pressure. This indicates that the residual liquid phase in the semisolid slurry flows toward the edge of the component [Fig. 1(b)] and the primary particles approach to each other along the direction parallel to the pressure during RSC, which is also found in the semisolid forming of Mg and Al alloys. Reference Chen, Chen, Zhang and Li22 It is well known that during the deformation process of a nondendritic semisolid slurry under pressure, four steps are included: liquid flow (LF), flow of liquid incorporating solid particles (FLS), sliding between solid particles (SS), and plastic deformation of solid particles (PDS). Reference Chen, Chen, Zhang and Li22 The former two steps are dominant when the solid particles are surrounded by liquid phase while the latter two operate when the solid particles are in contact with each other. During the initial stage of squeeze casting of the semisolid slurry, the LF and FLS should operate in succession because the primary particles are always surrounded by liquid phase at this stage. The LF regime can generate constituent segregation, the liquid phase flows toward the edge of the component, and the primary particles approach to each other along the direction parallel to the pressure. Simultaneously, solidification of the liquid phase occurs. Due to these two reasons, the liquid phase between the primary particles is decreased. With the increase of applied pressure, the flow velocity of the liquid is enhanced and more liquid phase flows to the edge, resulting in the decrease of secondarily solidified particles and eutectic structure. In addition, the plastic deformation occurred between the neighboring particles became more severe.
Microstructures of NZ30K alloys rheoformed under different applied pressures: (a) 0 MPa, (b) 40 MPa, (c) 80 MPa, and (d) 120 MPa.

Figures 3(a) and 3(d) also present SEM micrographs of NZ30K alloys rheoformed under 0 and 120 MPa. The massive eutectic phase (second phase) along the boundaries of particles can be found in the alloy formed under 0 MPa [Fig. 3(a)]. As shown by the result of EDS (Table I), the compositions of eutectic phase are mainly composed of Mg, Nd, and a small amount of Zn element. The eutectic phase becomes much finer as the applied pressure increases from 0 to 120 MPa, and some lamellar eutectic phases within the particles are observed [Fig. 3(d)]. In addition, the contents of Nd and Zn elements in the eutectic phases are significantly decreased under 120 MPa. It reveals that the solid solubility of Nd and Zn in α-Mg particles is increased.
EDS result and volume fraction of the eutectic phases, lattice constants a and c of α-Mg, and dislocation density in the NZ30K alloy rheoformed under different applied pressures.

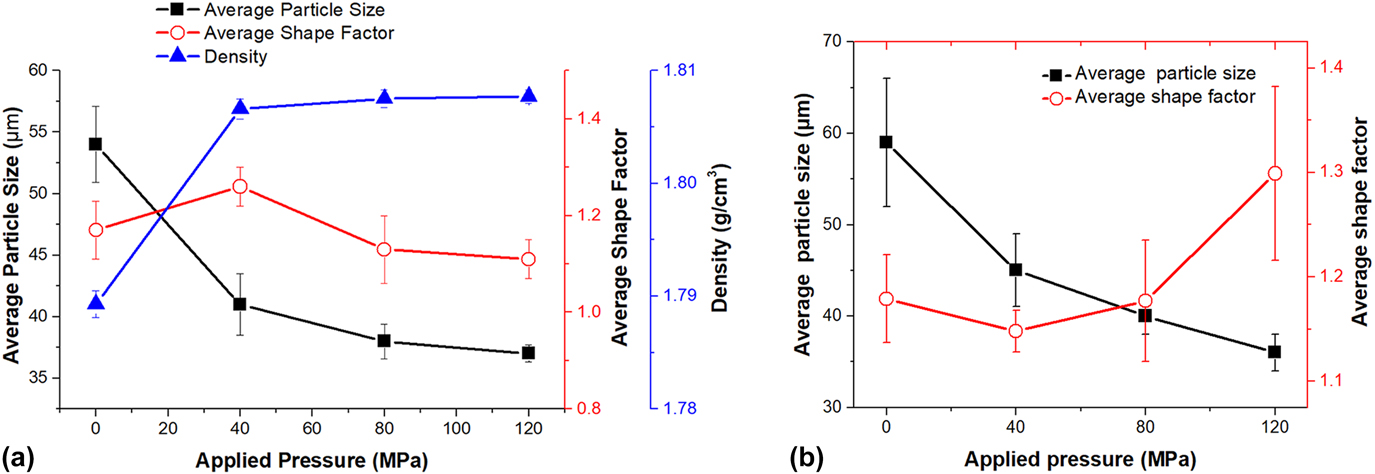
Figure 4(a) shows the variations of average primary particle size, average shape factor, and density of the as-cast RSC alloys. The average primary particle decreases remarkably from 58 μm to 42 μm when the pressure increases from 0 MPa to 40 MPa, and it slightly decreases to 41 μm and 39 μm when the pressure is increased to 80 MPa and 120 MPa, respectively. The average shape factor initially increases and then decreases with the increase of applied pressure. It is basically within the range of 1.11–1.26, which indicates that the particles almost retain their spherical morphology previously formed in the semisolid slurry (the average shape factor is about 1.23). The alloy density increases markedly from 1.7893 to 1.8066 g/cm3 with increasing the applied pressure from 0 to 40 MPa, and it gradually increases to 1.8075 and 1.8077 g/cm3 with increasing the applied pressure to 80 and 120 MPa.
(a) Variations of average primary particle size, average shape factor, and density of the as-cast RSC alloys. (b) Variations of average primary particle size and average shape factor of the T6-treated RSC alloys under different applied pressures.

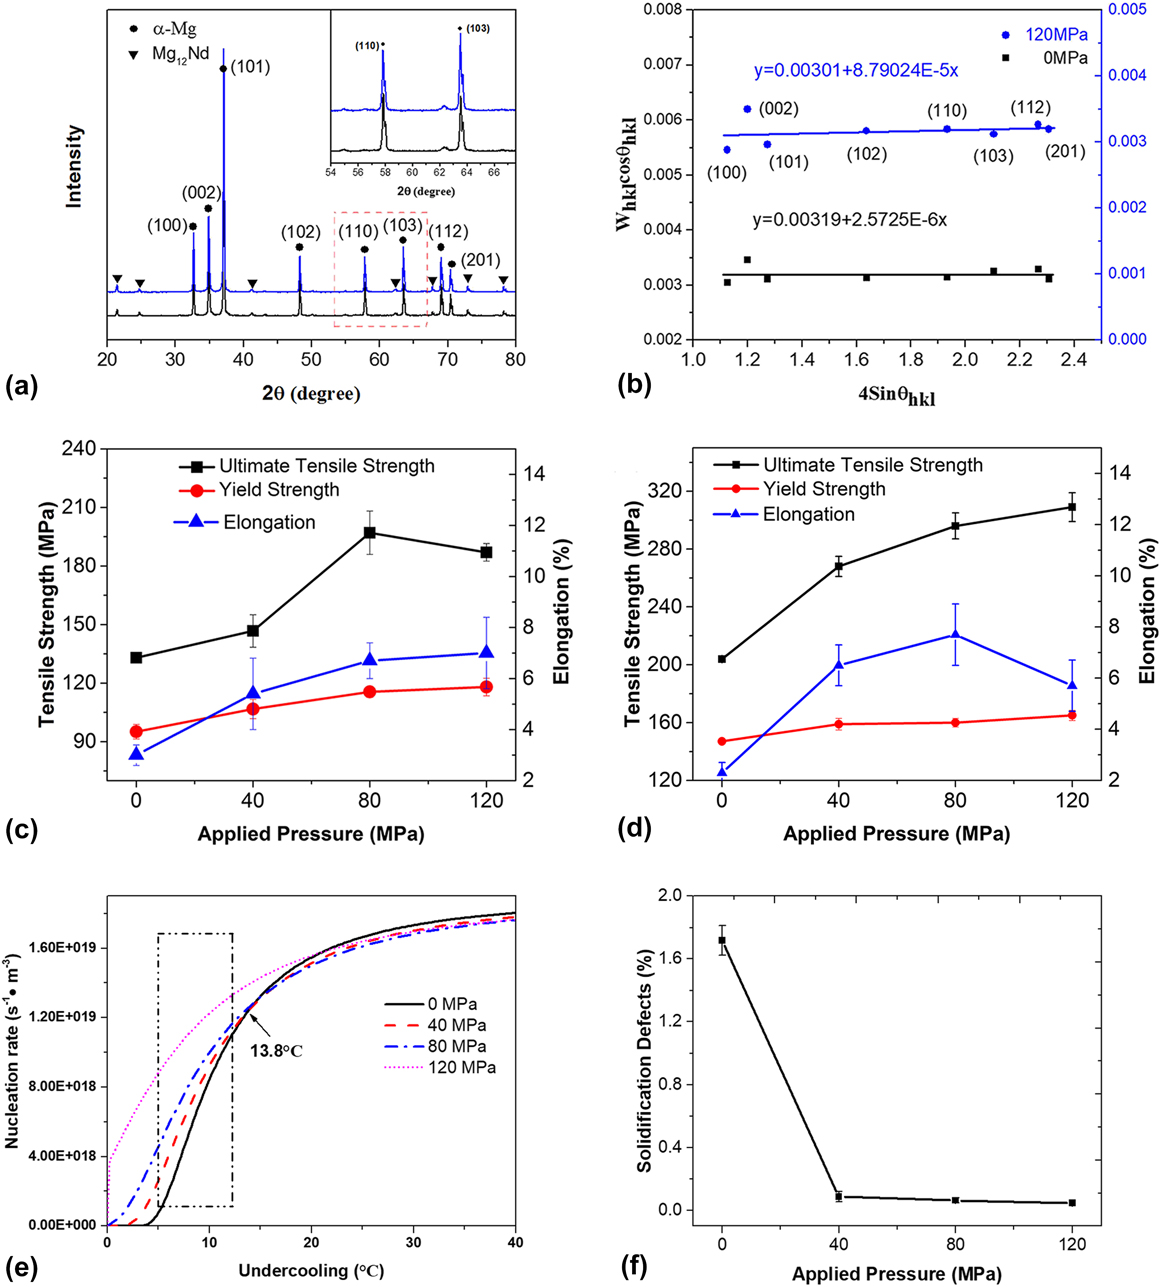
The XRD patterns of RSC samples rheoformed under 0 and 120 MPa are shown in Fig. 5(a). As seen, this alloy is mainly consisted of α-Mg matrix and Mg12Nd eutectic phase, and these phases remain unchanged under various pressures. Furthermore, as mentioned above, plastic deformation occurs between the neighboring particles during RSC of the NZ30K alloy. And it is expected that the dislocation density is increased with increasing pressure due to the more severe deformation. In addition, plastic deformation should induce lattice strain. According to Williamson and Hall, the XRD diffraction line broadening is owing to crystallite size and strain contribution. Reference Bindu and Thomas23 To analyze the strain effect, the instrumental corrected broadening is calculated using Eq. (1), Reference Bindu and Thomas23
 $${W_{hkl}} = {\left[ {{{\left( {{W_{hkl ‐ {\rm{M}}}}} \right)}^2} - {{\left( {{W_{hkl ‐ {\rm{I}}}}} \right)}^2}} \right]^{1/2}}\quad ,$$
where W hkl-M and W hkl-I are the measured and instrumental broadening, respectively. The average crystallite size of the eutectic phase can be obtained according to the Debbye–Scherrer equation, Reference Bindu and Thomas23
 $$D = {{M\lambda } \over {{\beta _{hkl}}\cos {\theta _{hkl}}}}\quad ,$$
where M is a constant equal to 0.9, λ is the wave length (0.1540 nm), D is the crystallite size of eutectic phase, and θ is the Bragg angle. In addition, the volume fraction of the eutectic phases can be obtained by Rietveld refinement. The calculated volume fraction is presented in Table I and the results show that it is decreased with increasing applied pressure. Furthermore, the α-Mg lattice constants analyzed by XRD show that the change of α-Mg lattice constants with pressure presents a same tendency. In the present work, the change of Zn content is much smaller than that of Nd (Table I); thus, the variation of lattice constants should reflect the dissolution trend of Nd. However, though the radius of Nd (∼0.185 nm) is larger than Mg (∼0.150 nm), the dissolution of Nd leads to decrease of α-Mg lattice constants according to the above analysis. This result is in accordance with the investigations of Fang et al. Reference Fang, Lü, Zhao, Wang, Liu and Wu20 and Li et al. Reference Li, Li, Jing, Chen, Zhang and Zhang24 With the increase of pressure, the solid solubility of RE (Ce and La) or Sm in the α-Mg is increased and the lattice constants are decreased.
(a) and (b) show XRD patterns and the corresponding Williamson–Hall plots of the as-cast NZ30K alloys rheoformed under 0 and 120 MPa, respectively; (c) and (d) show mechanical properties of as-cast RSC samples and T6-treated RSC samples under different applied pressures, respectively. (e) Shows the dependence of nucleation rate of the NZ30K alloy on undercooling under different applied pressures. (f) Shows the change of solidification defects with applied pressure.

In addition, according to the Williamson–Hall (W–H) equation, the relationship between crystallite size (d) and lattice strain (ε) is Reference Bindu and Thomas23
 $${W_{hkl}}\cos {\theta _{hkl}} = \left( {{{M\lambda } / d}} \right) + 4\varepsilon \sin {\theta _{hkl}}\quad .$$
The corresponding W–H plots of the NZ30K alloy rheoformed under different pressures are presented in Fig. 5(b). Based on the plots of W hkl cos θ hkl as a function of 4 sin θ hkl , the crystalline size d and the strain ɛ can be estimated from the y-intercept and slope of the linear fit. Thus the dislocation density (ρ) can be calculated by the following equation:
 $$\rho = {{2\sqrt 3 \varepsilon } / {\left( {{\rm{d}}b} \right)}}\quad ,$$
where b is the Burgers vector (b = 3.21 × 10⁻¹⁰ m). By substituting d and ɛ, the dislocation densities in the alloys are obtained. For the alloy rheoformed under 0 and 120 MPa, the dislocation densities are 6.41 × 10¹¹ m−2 and 2.07 × 10¹³ m−2, respectively, indicating that the plastic deformation surely occurs during rheoforming and the deformation degree increases with the pressure. Comparing with the ρ value of the Mg–1.1Y–Zn alloy after creep deformation (with a value of 6 × 10¹² m−2), Reference Suzuki, Kimura, Koike and Maruyama25 the calculated value of the NZ30K alloy rheoformed under 0 MPa is smaller, and that one rheoformed under 120 MPa is larger. It should be noted that the dislocation density obtained by the XRD is an average value over the probed area. It does not account for the spatial distribution of dislocations in individual phases in the material. The plastic deformation between the presolidified particles may result in high dislocation density and therefore affect the mechanical properties.
Figure 5(c) shows the mechanical properties of RSC NZ30K alloys under different pressures. The yield strength (YS) and elongation both increase with the increase of pressures, while the ultimate tensile strength (UTS) initially increases when the pressure increases from 0 to 80 MPa, and then decreases when the pressure further increases to 120 MPa. The YS, UTS, and elongation can be up to 116 MPa, 197 MPa, and 6.7%, respectively, which are 48.1, 21.4, and 123.3% higher than the corresponding values of the specimens prepared under the pressure of 0 MPa.
C. Microstructure and mechanical properties of T6-treated RSC alloys
Figure 6 presents the microstructure of T6-treated NZ30K alloys prepared by RSC technology under various pressures. It is found that the primary particle size is continuously decreased from 59 to 36 μm with increasing pressure [Figs. 6 and 4(b)]. The shape factor of the primary particle keeps almost unchanged as the pressure increases from 0 to 80 MPa, and then increases from 1.18 to 1.30 with the pressure further increases to 120 MPa. In addition, a long rod-like phase is observed in the T6-treated alloys and its amount is decreased with the increase of pressure (Fig. 6). The long rod-like phase is Zn-rich and Zr-rich phase according to the element map distributions [Fig. 6(e)]. It is expected to be Zn2Zr3 phase with a tetragonal structure (a = 0.768 nm, c = 0.699 nm, space group P42/mnm). Reference Liu, Yang, Luo and Jie26 The Zn2Zr3 phase is not observed in the as-cast microstructure, and its amount is decreased with increasing pressure in the T6-treated alloy. Therefore, the formation of this phase should be attributed to the reaction of Zr particles with dissolved Zn atoms during solution treatment, and the reaction of undissolved Zr particles with segregation of Zn atoms during aging treatment.
SEM micrographs of the T6-treated NZ30K alloy rheoformed under different applied pressures: (a) 0 MPa; (b) 40 MPa; (c) 80 MPa; (d) 120 MPa. The insets in (b) and (d) are the high-magnification showing the long rod-like phase. (e) Shows SEM micrographs with element map distributions of the long rod-like phase.

Figure 7 shows the TEM images and corresponding selected area electron diffraction (SAED) patterns of the T6-treated NZ30K alloy rheoformed under 120 MPa. According to the
 $\left[ {01\bar{1}1} \right]$
image [Fig. 7(a)] and the
 $\left[ {01\bar{1}0} \right]$
images [Figs. 7(c)–7(e)], two types of precipitates are observed. The long rod-like precipitates [Figs. 7(a), 7(c), and 7(d)] should be β′ phase and the small plate-like precipitates [Fig. 7(e)] should be β″ phase according to the previous studies
Reference Fu, Peng, Jiang, Chang and Zhai3,Reference Li, Lv, Liang, Qi, Zhu and Zhang27
and the SAED patterns [Fig. 7(f)]. These β-type precipitates are believed to play an important role in the enhancement of alloy’s mechanical properties.
TEM images and corresponding SAED patterns of the T6-treated NZ30K alloy rheoformed under 120 MPa. (a) and (b) Bright field image along the
 $\left[ {01\bar{1}1} \right]$
zone axis and corresponding SAED pattern; (c) bright field image, (d) and (e) dark field image along the
 $\left[ {01\bar{1}0} \right]$
zone axis, and (f) corresponding SAED pattern.

Figure 5(d) presents the mechanical properties of T6-treated RSC NZ30K alloys under different pressures. With the pressure increases from 0 to 120 MPa, the UTS is significantly increased from 204 to 309 MPa and the YS is increased from 147 to 165 MPa. The elongation initially increases from 2.3 to 7.7% when the pressure increases from 0 to 80 MPa and then decreases to 6.7% as the pressure further increases to 120 MPa. It is found that the T6-treated alloy rheoformed under 120 MPa shows higher properties than the alloy rheoformed under 80 MPa, which may be attributed to the smaller particle size obtained [comparing Figs. 6(c) and 6(d)] and the stress release during heat treatment.
IV. DISCUSSION
A. Effect of pressure on microstructure and mechanical properties of RSC alloys
Preparation of semisolid slurry and subsequent squeeze casting are the two key processes during RSC. As shown in Figs. 2(b) and 2(c), semisolid slurry with fine and spherical primary particles can be obtained by EMS treatment. During solidification under stirring, a uniform distribution of solute and temperature in the alloy melt could be obtained and the nucleation rate and number were increased due to the high undercooling within the alloy melt. Reference Chen, Zhang, Liu, Wu and Ding19 Therefore, the particles in the slurries treated by EMS are much finer than those without EMS treatment.
The subsequent squeeze casting of the semisolid slurry can be divided into three stages: delay time before pressuring, rising pressure time, and maintaining pressure time. Reference Yang, Peng, Fu, Hu and Ding28 Generally, the application of pressure during solidification would lead to microstructure refinement, which should be partly attributed to the increase in the heat transfer coefficient by eliminating air gaps between alloy slurry and mold wall surface. The higher the pressure, the higher the heat transfer coefficient and the higher cooling rate are. Therefore, increasing applied pressure would contribute to a larger influence of the growth restricted of primary particles and secondarily solidified structures.
However, the specific effect of pressure on the nucleation rate NZ30K alloy is still unclear. The presence of pressure during solidification may affect the phase diagram of alloys, and the increase in freezing temperature can be estimated by the Clausius–Clapeyron equation, Reference Zhang, Wu, Liu, Zhang, Pang and Ding14
 $${{{\rm{d}}{T_{\rm{m}}}} \over {{\rm{d}}P}} = {{{T_{\rm{m}}}\Delta V} \over {{Q_{\rm{m}}}}}\quad ,$$
where P is the applied pressure, T m is the melting point temperature in the standard atmosphere, ΔV is the volume change from liquid to solid, and Q m is the latent heat of solidification, thus the change of undercooling can be obtained from the following equation:
 $$\Delta {T_{\rm{m}}} = \int_{{P_0}}^P {{{{T_{\rm{m}}}\Delta V} \over {{Q_{\rm{m}}}}}{\rm{d}}p} \quad ,$$
where P 0 is the atmospheric pressure and T mΔV/Q m can be regarded as the constant under the applied pressure in this work and one can be obtain Eq. (7) as follows:
 $$\Delta {T_{\rm{m}}} = {{{T_{\rm{m}}}\Delta V} \over {{Q_{\rm{m}}}}}\left( {P - {P_0}} \right)\quad .$$
Therefore, the undercooling under pressure can be expressed as
 $$\Delta T = \Delta {T_0} + \Delta {T_{\rm{m}}} = \Delta {T_0} + {{{T_{\rm{m}}}\Delta V} \over {{Q_{\rm{m}}}}}\left( {P - {P_0}} \right)\quad ,$$
where ΔT 0 is the undercooling under atmospheric pressure. In addition, it is well known that the heterogeneous nucleation rate N can be written as
 $$N = {{nkT} \over h}\exp \left( {{{ - \Delta {G^ * }} \over {kT}}} \right) \cdot \exp \left( {{{ - Q} \over {kT}}} \right)\quad ,$$
where n is the number of atoms in unit volume, k is the Boltzmann’s constant, h is the Planck constant, and ΔG* is the heterogeneous nucleation activation energy and it can be obtained as follows:
 $$\Delta {G^ * } = {{16\pi f\left( \theta \right){\sigma ^3}{T_{\rm{m}}}^2} \over {3{{\left( {{Q_{\rm{m}}} \cdot \Delta T} \right)}^2}}} = {{16\pi f\left( \theta \right){\sigma ^3}} \over {3 \cdot {{\left[ {{{\Delta {T_0}{Q_{\rm{m}}}} / {{T_{\rm{m}}} + \left( {P - {P_0}} \right)\Delta V}}} \right]}^2}}}\quad ,$$
where f(θ) = (2 − 3 cos θ + cos3 θ)/4, its value is about 1.7 × 10⁻⁵ under present conditions. σ is the surface tension. The relationship between σ and pressure P is given by Reference Pan, Yao, Zhuang and Wang29
 $${\sigma _{\rm{p}}} = {\sigma _0}\left( {1 + {{2\varepsilon P} / 3}} \right)\quad ,$$
where σ0 is the interfacial energy at atmosphere pressure, and ε is the isothermal compressibility and it can be obtained as Reference Kleppa30
 $$\varepsilon = {{{C_{\rm{P}}}} \over {{C_{\rm{V}}}}} \times {1 \over {\rho {\mu ^2}}}\quad ,$$
where C P is the specific heat at constant pressure, C V is the specific heat at constant volume, ρ is the density, and μ is the velocity of sound.
In addition, Q is the diffusion activation energy, and the relationship between Q and P is given by Reference Yamane, Mori, Minamino, Miyamoto, Koizumi and Takahashi31
 $${Q_{\rm{p}}} = {Q_0} + P\Delta {V_2}\quad ,$$
where Q 0 is the activation energy at a pressure of 0 and ΔV 2 is the activation volume. Based on the above analysis, the heterogeneous nucleation rate for pressurized solidification can be obtained,
 $$N = {{nkT} \over h}\exp \left\{ { - {{16\pi f\left( \theta \right){\sigma _0}^3{{\left[ {{{1 + 2{C_{\rm{P}}}P} / {\left( {3{C_{\rm{V}}}\rho {\mu ^2}} \right)}}} \right]}^3}} \over {3kT \cdot {{\left[ {{{\Delta {T_0}{Q_{\rm{m}}}} / {{T_{\rm{m}}}}} + \left( {P - {P_0}} \right)\Delta V} \right]}^2}}} - {{{Q_0} + P\Delta {V_2}} \over {kT}}} \right\}\quad .$$
Form Eq. (14), it can be known that the nucleation rate N depends on the applied pressure and undercooling. Based on the parameters (for Mg) shown in Table II, the dependence of the nucleation rate on undercooling under different pressures can be obtained and the result is presented in Fig. 5(e). It is found that when the undercooling is less than 13.8 °C, the nucleation rate of the NZ30K alloy increases with increasing pressure. The nucleation in the melt is accelerated with the application of pressure during solidification, resulting in a remarkable effect in grain refinement. The applied pressure is lower than 120 MPa, which would correlate to an undercooling less than 13.8 °C in this work. Therefore, the nucleation rate under RSC process can be described by the curves denoted by the rectangle in Fig. 5(e), and the particle size of the secondarily solidified structure is decreased with the increase of pressure (Figs. 3 and 4).
Parameters used in this work.

As shown in Fig. 3 and Table I, the application of pressure during solidification also affect the morphology and compositions of the eutectic phase besides the grain refinement. The eutectic phases within the particles almost completely dissolved and the amount of the Nd and Zn elements is decreased with the pressure increase from 0 to 120 MPa, which should be attributed to the increase of solid solubility. Therefore, the eutectic phases become finer and the lattice constants of α-Mg particles are reduced. In addition, the impurity diffusion coefficient of Nd in Mg solid solution is lower than that of Zn, Reference Paliwal, Das, Kim and Jung34 thus more percentage of Zn dissolved under the pressure of 40 MPa. And it almost completely dissolved into the particles when the pressure is increased to 80 MPa.
The mechanical properties of the as-cast alloys are increased with the pressure increases from 0 to 80 MPa [Fig. 5(c)]. Based on the above analysis, the improvement of the mechanical properties should be partly attributed to the grain refinement, including the growth restriction of primary α-Mg particles and refinement in secondarily solidified structures. Another factor that should not be ignored is the densification due to the reduction in shrinkage porosities and inclusions when solidified under applied pressure. The pressure of 0 MPa is the lowest pressure used in the present work, and the flow velocity of the semisolid slurry during RSC is the minimum. Thus mold-filling ability and shrinkage-feeding ability are the lowest. Solidification shrinkage and porosities thereby easily generate in the last solidified zones, i.e., the secondarily solidified structures are the week points in the RSC alloys. Therefore, the density of the alloy is the lowest [Fig. 4(a)]. In addition, oxidation and burning of the slurry occurred when the pressure was not applied. Cracks generally develop along the secondarily solidified structures Reference Chen, Chen, Zhang and Li22 and thus the properties of this alloy (YS of 95 MPa, UTS of 133 MPa, and elongation of 3.0%) are the lowest under this condition. As the pressure increases to 40 MPa, the flow velocity of the slurry is increased and the feeding ability to shrinkage porosities is improved. The density of the alloy is increased [Fig. 4(a)]. In addition, the solidification defects including the shrinkage porosities and the inclusions were significantly decreased [Fig. 5(f)]. Therefore, the tensile properties are increased (YS of 107 MPa, UTS of 147 MPa, and elongation of 5.4%) due to the reduction of solidification defects. When the pressure is increased to 80 MPa, the density of the alloy is further increased and a more compact microstructure is obtained. In addition, the secondarily solidified structures among the particles are decreased. Therefore, the mechanical properties of the alloy are the highest in this work. While further increasing the applied pressure to 120 MPa showed little effect on the density, which is consistent with the result published for squeeze casting of AZX912 alloys. Reference Zhang, Wu, Liu, Zhang, Pang and Ding14 In addition, the plastic deformation occurs at a great extent [Fig. 3(d)] with a large value of dislocation density (Table I). Under this condition, local residual stress concentration generally exists and cracks seem to preferentially propagate across the deformed regions or primary particles, which are commonly found in other semisolid forming alloys. Reference Zhang, Chen, Cheng and Li35,Reference Chen, Huang, Huang, Ma and Hao36 Therefore, the UTS of the alloy is decreased to 187 MPa [Fig. 5(c)]. However, owing to the refinement in the microstructure, the YS and elongation are increased (YS of 118 MPa and elongation of 7.0%).
B. Effect of aging treatment on microstructure and mechanical properties of RSC and PMC alloys
Figures 8(a) and 8(b) present the SEM micrograph and TEM images of the T6-treated PMC-NZ30K alloy. The grain size of the alloy is about 69 μm [Fig. 8(a)], which is much larger than that of the RSC alloy (rheoformed under 120 MPa, 27 μm). In addition, the long rod-like Zn2Zr3 phase is also found around the Zr-containing particles within the α-Mg grains. The TEM dark field image and the corresponding SAED pattern show that the precipitates in the PMC alloy are mainly composed of rod-like β′ phase [Fig. 8(b)]. The small plate-like β″ phase in the RSC sample is not found in the PMC sample. Furthermore, the representative HRTEM images of the two types of alloys are shown in Figs. 8(c) and 8(d). The size of the β′ phase in the RSC sample is larger than that in the PMC sample [also can be found by comparing Figs. 7(a) and 6(b)], which indicates that the strengthening contribution of the precipitates in the PMC sample is larger than that in the RSC sample because the β′ phase is the main strengthening phase. Reference Fu, Peng, Jiang, Chang and Zhai3
(a) SEM micrograph; (b) TEM dark field image and corresponding SAED pattern with
 ${\rm{B//}}\left[ {01\bar{1}1} \right]$
of the T6-treated PMC sample. (c) and (d) show the HRTEM images of the T6-treated PMC sample and RSC sample.

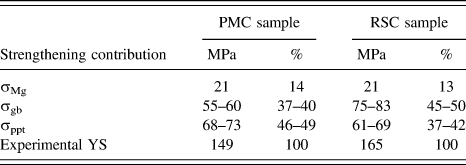
However, the PMC specimen shows lower mechanical properties (YS-149MPa, UTS-283 MPa, and elongation-7.7%). To investigate the various strengthening contributions in the T6-treated PMC sample and RSC sample, the grain boundary strengthening (σgb) and precipitation strengthening (σppt) are discussed and the YS of the alloys can be obtained as
 $${\sigma _{{\rm{ys}}}} = {\sigma _{{\rm{Mg}}}} + {\sigma _{{\rm{gb}}}} + {\sigma _{{\rm{ppt}}}}\quad ,$$
where σMg is the YS of the pure Mg (σMg = 21 MPa). The grain boundary strengthening (σgb) can be calculated by Hall–Petch relationship, Reference Li, Lv, Liang, Qi, Zhu and Zhang27
 $${\sigma _{{\rm{gb}}}} = {\sigma _{{\rm{Mg}}}} + k{d^{ - 1/2}}\quad ,$$
where k (280–320 MPa μm−1/2 for Mg Reference Tang, Liu, Chen, Liu and Deng37 ) is a constant related to the material. Therefore, the calculated contribution of grain boundary strengthening is 55–60 MPa for the PMC sample and 75–83 MPa for the RSC sample. The σppt can be calculated according to the present experimental results and the different strengthening contributions are listed in Table III. The σppt of the PMC sample offers higher strengthening properties (61–69 MPa for the RSC sample and 68–73 MPa for the PMC sample), which should be attributed to the smaller β′ phase obtained. However, the final properties of the RSC sample are higher than those of the PMC sample due to the much larger grain boundary strengthening contribution obtained.
Strengthening contributions in the T6-treated NZ30K alloy prepared by PMC and RSC techniques.

Moreover, the dislocation in the RSC alloys will affect the mechanical properties of the alloy through interacting with each other and impeding their own movement. Based on the Bailey and Hirsch’s investigation, the strengthening contribution caused by dislocation can be calculated by Reference Bailey and Hirsch38
 $$\Delta {\sigma _{{\rm{dis}}}} = M\partial Gb{\rho ^{1/2}}\quad ,$$
where M is the mean Taylor factor of random polycrystalline Mg (M = 4.5) Reference Cáceres and Lukáč39 ; α is a constant related to the dislocation–dislocation interaction constant, its value is about 0.7 for random polycrystalline Mg Reference Bailey and Hirsch38 ; G (G Mg = 16.6 GPa) is the shear modulus of the Mg matrix, b is the magnitude of Burgers vector, and ρ is the dislocation density. Based on the experimental results and Eq. (17), the calculated Δσdis is about 0.08 MPa. The value in this study is also small and thus the contribution of dislocation strengthening can be ignored.
V. CONCLUSIONS
The effects of applied pressure and aging treatment on microstructure and mechanical properties of NZ30K alloy components prepared by RSC combined with EMS have been investigated. The following conclusions can be made:
-
(1) After being treated by EMS, the particles of the NZ30K alloy are effectively refined and an ideal semisolid slurry can be obtained. The secondarily solidified structures are further refined during solidification under pressure. With the increase of applied pressure, the nucleation rate, solid solubility of Nd and Zn in the α-Mg matrix, and dislocation density are increased.
-
(2) The mechanical properties of the as-cast RSC-NZ30K alloys are initially increased and then decreased as the pressure increases. The increase in the mechanical properties is mainly attributed to the refinement of the particles and a more compact microstructure obtained. The further decrease of tensile properties is related to the local stress concentration. After T6-treated, the β′ precipitates form in the PMC alloy are finer than those in the RSC alloy, resulting in the larger precipitation strengthening in the PMC sample.
-
(3) With increasing pressure, the mechanical properties of the T6-treated RSC alloy are increased continuously. Compared with the T6-treated PMC sample, the mechanical properties of the RSC sample are higher due to the larger grain boundary strengthening contribution and the YS, UTS, and elongation are up to 165 MPa, 309 MPa, and 5.7%, respectively.
-
(4) The relationship among applied pressure, undercooling, and nucleation rate can be obtained based on the Clausius–Clapeyron equation. When the undercooling is less than 13.8 °C, the nucleation rate of the NZ30K alloy increases with increasing pressure.
ACKNOWLEDGMENTS
This work is supported by National Key Research and Development Program of China (No. 2016YFB0701205) and Science Innovation Foundation of Shanghai Academy of Spaceflight Technology (Nos. SAST2015047 and SAST2016048).