INTRODUCTION
Milk and dairy products have always been a key component in the human diet largely because they deliver a matrix of nutritional compounds including fat, protein, vitamins, antioxidants and minerals (Haug et al. Reference Haug, Hostmark and Harstad2007; Kratz et al. Reference Kratz, Baars and Guyenet2013). Milk fat is mainly composed of fatty acids (FA; about 0·93 of total fat) some of which are beneficial for human health. These include monounsaturated FAs (MUFA) vaccenic acid (VA; t11 C18 : 1) and oleic acid (OA; c9 C18 : 1) and polyunsaturated FAs (PUFA) omega-3 (n − 3), omega-6 (n − 6) and rumenic acid (RA; c9t11 C18 : 2 conjugated) (Givens & Shingfield Reference Givens and Shingfield2004; Kliem & Givens Reference Kliem and Givens2011). However, individual saturated FAs (SFA) in milk, such as lauric (C12 : 0), myristic (C14 : 0) and palmitic (C16 : 0) have been associated with increased risk of cardiovascular diseases (CVD) (Givens & Shingfield Reference Givens and Shingfield2004; Kliem & Givens Reference Kliem and Givens2011). Milk proteins consist of caseins (about 800 g/kg of protein) and whey proteins (about 200 g/kg of protein) and serve a dual role of (i) being essential nutritional components by providing amino acids and bioactive peptides (Severin & Wenshui Reference Severin and Wenshui2005; Korhonen & Pihlanto Reference Korhonen and Pihlanto2006; Madureira et al. Reference Madureira, Pereira, Gomes, Pintado and Malcata2007) and (ii) controlling the cheese-making properties of milk (Christian et al. Reference Christian, Grainger, Sutherland, Mayes, Hannah and Kefford1999; Wedholm et al. Reference Wedholm, Larsen, Lindmar-Mansson, Karlsson and Andren2006). Tocopherols and antioxidants play a number of roles in milk; they (i) improve the health status of dairy cows (Givens & Shingfield Reference Givens and Shingfield2004), (ii) protect milk proteins and lipids from oxidation (Lindmark-Mansson & Akesson Reference Lindmark-Mansson and Akesson2000; Havemose et al. Reference Havemose, Weisbjerg, Bredie and Nielsen2004) and (iii) offer cellular oxidation protection for consumers (Haug et al. Reference Haug, Hostmark and Harstad2007). However, milk is far from being considered a crucial source of antioxidants in the human diet since green leafy vegetables, herbs, leeks, peas, broccoli, carrots and eggs provide considerably more (Maiani et al. Reference Maiani, Caston, Catasta, Toti, Cambrodon, Bysted, Granado-Lorencio, Olmedilla-Alonso, Knuthsen, Valoti, Bohm, Mayer-Miebach, Behsnillian and Schlemmer2009; Abdel-Aal et al. Reference Abdel-Aal, Akhtar, Zaheer and Ali2013). Despite emerging evidence of a positive association between dairy consumption and protection against CVD, diabetes (Kratz et al. Reference Kratz, Baars and Guyenet2013) or certain cancers (colorectal, and possibly bladder; Kliem & Givens Reference Kliem and Givens2011), dietary recommendations aim to reduce dairy fat consumption and replace dairy fat with less saturated plant-derived oils (Kliem & Givens Reference Kliem and Givens2011; Kratz et al. Reference Kratz, Baars and Guyenet2013).
Recently, there has been a resurgence of interest among producers in pasture-based dairying in the UK and Ireland, driven by economic benefits stemming from reduced reliance on more expensive concentrate feeds. Grazing is the cheapest source of nutrients for ruminants; estimated production costs decrease by €0·01/litre milk for every 2·5% increase in fresh grass in dairy diets (O'Donovan et al. Reference O'Donovan, Lewis and O'Kiely2011). At the same time, there is growing evidence that reduced intensification of dairy production, especially feeding (a greater emphasis on grazing and increased forage : concentrate ratio or both) may increase the concentrations of compounds beneficial for human health (Butler et al. Reference Butler, Nielsen, Slots, Seal, Eyre, Sanderson and Leifert2008; Stergiadis et al. Reference Stergiadis, Leifert, Seal, Eyre, Nielsen, Larsen, Slots, Steinshamn and Butler2012). Feeding cows fresh herbage instead of conserved forage and concentrate feeds has been shown to improve the nutritional composition of milk by increasing beneficial n − 3, MUFA, PUFA and RA, vitamins and antioxidants and by decreasing SFA (Butler et al. Reference Butler, Nielsen, Slots, Seal, Eyre, Sanderson and Leifert2008; Slots et al. Reference Slots, Butler, Leifert, Kristensen, Skibsted and Nielsen2009; Stergiadis et al. Reference Stergiadis, Leifert, Seal, Eyre, Nielsen, Larsen, Slots, Steinshamn and Butler2012). Other management practices adopted in pasture-based systems, such as including legumes in grazing and conservation swards, especially in organic farming where nitrogen (N) fertilizers are not permitted (Butler et al. Reference Butler, Nielsen, Slots, Seal, Eyre, Sanderson and Leifert2008; Dewhurst et al. Reference Dewhurst, Delaby, Moloney, Boland and Lewis2009), or using smaller, alternative breeds such as Jersey for crossbreeding with Holstein/Friesian cows to improve stocking rate, welfare, fertility and calving ease (Weigel & Barlass Reference Weigel and Barlass2003; Sorensen et al. Reference Sorensen, Norberg, Pedersen and Christensen2008), may influence milk composition. For example, clover was found to increase n − 3 in milk (Dewhurst et al. Reference Dewhurst, Delaby, Moloney, Boland and Lewis2009; Lee et al. Reference Lee, Theobald, Tweed, Winters and Scollan2009) while Jersey milk had higher concentrations of total SFA, protein, casein and casein : whey protein ratio compared with that from Holstein/Friesian cows in other studies (Carroll et al. Reference Carroll, DePeters, Taylor, Rosenberg, Perez-Monti and Capps2006; Stergiadis et al. Reference Stergiadis, Seal, Leifert, Eyre, Larsen and Butler2013).
Given its complexity, composition and multiple processing applications, milk should be studied as a matrix of compounds and investigations ought to consider a range of components with respect to its nutritional and manufacturing value. The present study aimed to: (i) assess the impact of grazing/management system on a broad range of nutritionally relevant milk components (FA profile, protein composition, α-tocopherol and antioxidant content), (ii) investigate the persistency of outcomes over two sampling periods and (iii) associate other management parameters (e.g. crossbreeding and sward botanical composition) with nutritionally relevant components in milk by multivariate analyses.
Materials and methods
Experimental design
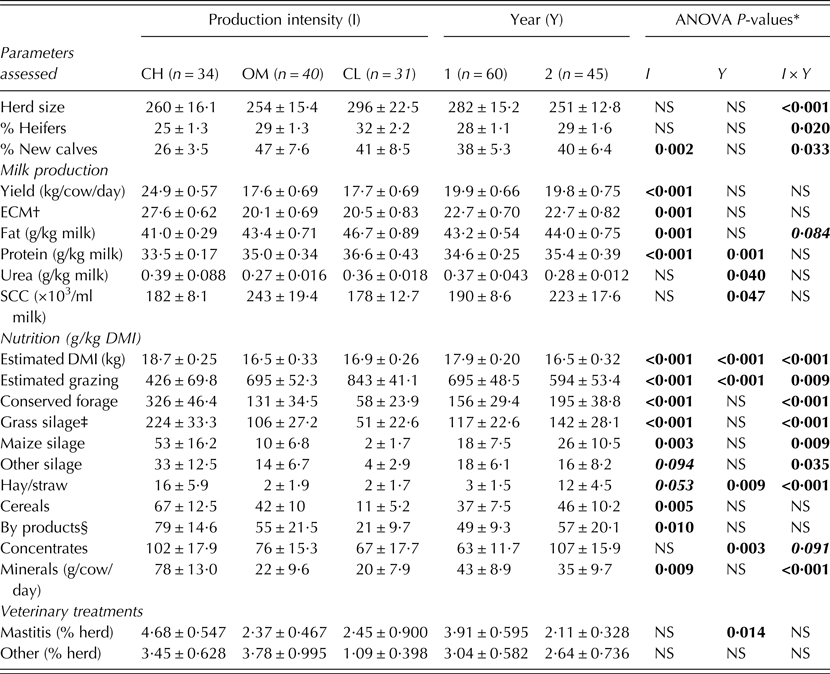
The survey was conducted in south-west Wales on 15 farms representing three pasture-based production systems widely used in this region. All farms operated paddock grazing with contrasting reliance on grazed herbage, conserved forage and supplementary feeds in dairy diets (conventional high-intensity, low pasture intake [CH], organic medium-intensity, medium pasture intake [OM], conventional low-intensity, high pasture intake [CL]) with five farms for each system. Milk yield and composition along with diet details and management practices were recorded/collected on eight occasions: (i) August 2004, October 2004, March 2005 and May 2005 (year 1) and (ii) March, May, June, August and October 2007 (year 2). Milk samples representing 24-h production were collected from the bulk tank (after stirring) and kept frozen at –20 °C until analysis. On each sampling date questionnaires were completed by the farmers, providing herd details (numbers of lactating cows and heifers in the herd and those calving since the last collection), milk yield, feed composition (type and amounts of conserved forage, cereals and concentrate feeds) and other supplements (minerals/vitamin and oil), housing and grazing management, signs of and treatment for mastitis and other ailments. Data on the gross composition of milk (fat, protein, lactose, urea content and somatic cell count (SCC) obtained from routine milk recording), along with herbage from the grazing swards, were collected. This information, together with data on the genetics/breed composition of the herd was used to define the husbandry/management practices. Estimated herd dry matter intake (DMI) and pasture intake (by difference) were calculated as described by Butler et al. (2008) using milk yield, breed and feed composition and quantity data collected via the farmer questionnaire. Details of feeding regimes, milk yields and gross composition and other production system parameters are presented in Table 1.
Management and production parameters (means±s.e.) and veterinary treatments for pasture-based dairy systems of contrasting production intensity (conventional high-intensity [CH], organic medium-intensity [OM] and conventional low-intensity [CL]) in two different years (1: 2004/05, 2: 2007) in Wales

* Significance was declared at P < 0·05 (significant, bold) and 0·05 < P < 0·10 (trend, bold-italics); NS: P > 0·10.
† Energy-corrected milk=[0·327 × yield (kg/day)]+[12·86 × fat (kg/day)]+[7·65 × protein (kg/day)], as proposed by Peterson et al. (Reference Peterson, Rezamand, Williams, Price, Chanine and McGuire2012).
‡ Conventional silage was made of grass while organic silage was a mixture of organically grown grass and clover.
§ Products from food and drink manufacture, typically sugar beet pulp, maize gluten feed, brewers grains and distillers dark grains.
The main characteristics of the three pasture-based production systems in the present study were:
1. Conventional high-intensity (CH). Five farms representing common conventional management with a grazing allowance in Wales were included. Cows had access to grazing during summer and were housed indoors during winter. Grazing and silage swards were all predominantly pure ryegrass (clover may appear in <20 g/kg of herbage DM) and paddock rotation varied between 2 and 5 days depending on herbage supply and demand. All cows in CH farms were Holstein/Friesian, calving all-year-round, resulting in cows at all stages of lactation being milked throughout the year. These farms are characterized by high yield of herbage production, averaging 1·8 t DM/ha when cows were introduced to paddocks. Although described as ‘high-intensity’, this is a relative term within the present study because highly intensive farms providing over 500 g/kg DMI from concentrates, milking three times per day and with limited access to grazing, as previously described for the UK (Stergiadis et al. Reference Stergiadis, Leifert, Seal, Eyre, Nielsen, Larsen, Slots, Steinshamn and Butler2012), were not included.
2. Organic medium-intensity (OM). Five farms representing organic management (certified either by the Soil Association or Organic Farmers and Growers) were included. Swards and silages used were mainly mixed ryegrass/clover (average composition; 870 g ryegrass/kg, 105 g clover/kg and 25 g other plants/kg on a fresh weight basis, although this did fluctuate considerably throughout the study). No mineral N or soluble phosphorus (P) fertilizers were applied, although finely ground rock phosphate was used when necessary, based on soil analyses. As expected, in the absence of N fertilizer, herbage yield when cows were introduced into paddocks at 1·4 t DM/ha, was slightly lower than in CH. Cows grazed when the conditions allowed (March–October), generally spending 1–2 days on each paddock. Herds block-calved all cows between late February and April. Herd composition throughout the survey averaged 0·69 Holstein/Friesian, 0·24 Jersey or Jersey crossbreds (0·14 and 0·10, respectively) and 0·07 of cows of ‘Red’ genotypes (Scandinavian Red, 0·03; Ayrshire, 0·02; Shorthorn, 0·02).
3. Conventional low-intensity (CL). Five farms representing conventional pasture-based systems were included. All farms used the New-Zealand type production system (McCall & Clark Reference McCall and Clark1999). Swards and silages were predominantly pure ryegrass, with clover contributing <10 g/kg of herbage DM, and cows grazed throughout the lactation with concentrates or other supplements given at <100 g/kg DMI. Paddock rotation was mostly on a daily basis with cows moving to fresh grazing every day and the recorded herbage yield on introduction of 1·3 t DM/ha was slightly lower than in CH and similar to the OM system. All farms block-calved between late February and April. Mineral N fertilizers up to 120 kg N/ha/year were used and water-soluble P fertilizers at detectable amounts by soil analysis were applied. Herd composition throughout the survey averaged 0·61 Holstein/Friesian and 0·39 Jersey or Jersey crossbreds (0·16 and 0·23, respectively) while a small number of cows were Ayrshire or Ayrshire crossbreds (<0·005).
Forage production and botanical composition
Herbage details relate only to year 2 of the present study. Monthly samples were collected on each farm, from three locations within the next paddock in the rotation, representing the herbage that cows would have access to the following day. Vegetation within a 0·75 × 0·75 m quadrat, thrown at random, was cut to 10 mm residual height, and three samples were bulked, weighed and transferred to the field station. They were thoroughly mixed before a representative sub-sample was separated into grasses, legumes and other plants. Each fraction was then weighed fresh and again after 12 h forced-air oven drying at 80 °C.
Milk analysis
Milk FA analysis was performed following routine procedures of the laboratories of Aarhus University, Denmark (year 1), and Newcastle University, UK (year 2), as described by Slots et al. (Reference Slots, Butler, Leifert, Kristensen, Skibsted and Nielsen2009) and Butler et al. (Reference Butler, Stergiadis, Seal, Eyre and Leifert2011), respectively. Milk was analysed for protein profile as described by Stergiadis et al. (Reference Stergiadis, Leifert, Seal, Eyre, Nielsen, Larsen, Slots, Steinshamn and Butler2012). Determination of milk α-tocopherol/antioxidant content was performed as shown by Slots et al. (Reference Slots, Butler, Leifert, Kristensen, Skibsted and Nielsen2009).
Statistical analysis
Variables expressed as proportions or percentages (individual FA, SFA, MUFA and PUFA) were arcsine transformed prior to analyses of variance (ANOVA), in common with previous work (Butler et al. Reference Butler, Stergiadis, Seal, Eyre and Leifert2011; Stergiadis et al. Reference Stergiadis, Leifert, Seal, Eyre, Nielsen, Larsen, Slots, Steinshamn and Butler2012, Reference Stergiadis, Seal, Leifert, Eyre, Larsen and Butler2013), but all results presented are untransformed values. The proportions of conserved forage, grass silage, maize silage and by-products in the diet and mineral supplementation (g/cow/day) were cube-root transformed prior to ANOVA, while other measurements were analysed untransformed. Values for FA are expressed as g/kg of total identified FA, individual protein content as g/kg milk and antioxidants and α-tocopherol content as mg/kg milk fat. Data collected in June 2007 (year 2) for milk yield, basic composition, FA profiles and milk antioxidant content were excluded from this statistical analysis because corresponding samples from 2004/05 (year 1) were unavailable; they were however used in the ANOVA of protein composition that was assessed only during year 2 of the study. Analyses of variance were derived from linear mixed-effects models (Pinheiro & Bates Reference Pinheiro and Bates2000) using management (conventional high-intensity [CH], organic medium-intensity [OM], conventional low-intensity [CL]), sampling month (March, May, August and October) and year (first and second) as fixed factors and farm as the random factor. A similar model using management (CH, OM and CL), sampling date (March, May, June, August and October) as fixed factors and farm as the random factor was used to assess protein composition of milk only for year 2. Differences between means discussed as significant (P < 0·05) in the present study refer to those identified by Tukey's honest significant difference test, used for pairwise comparisons of means. Analyses were performed in the R statistical environment (R Development Core team 2009) and residual normality was assessed using the qqnorm function (Crawley Reference Crawley2007), with no data showing deviation from normality. Supplemented lipid (mainly calcium salts of palm oil) was provided in one CH farm during year 2 of the study on four occasions (38 g per cow per day on average) although data were insufficient to carry out factorial analysis for this variable.
Multivariate redundancy analyses (RDA) allowed the relationships between multiple variables influencing responses to be assessed in datasets containing both: (i) measured variables, in this case milk composition parameters, and (ii) variables thought to influence these responses. This contrasts with factorial analyses where each response variable is treated separately. In the present study, RDA were used to investigate the effects of variables related to sward yield, botanical composition, individual feed components and cows’ breed (the ‘drivers’) on milk FA, protein and antioxidant profiles, SCC and mastitis cases (the ‘response variables’). Redundancy analyses produce biplots where arrows indicate the relative effects of ‘drivers’ in relation to the ‘response variables’. Sward related components were dry matter yield per hectare (DMHA), the proportions of grasses (GRP), red/white clover (CLP) and other plants (OTP) in the herbage. Feed components were dietary proportions for predicted pasture intake (GRA), grass silage (GS), maize silage (MS), other silage (OS), hay/straw (HS), cereals (CER), by-products (BP; products from food and drink manufacture, typically sugar beet pulp, maize gluten feed, brewers grains and distillers dark grains), concentrate feed (CON), oil supplements (OIL) and minerals and vitamins supplements (MIN). The proportion of non-Holstein/Friesian cows (BRE) in the herd was used as an indication of breed difference. RDA analyses were performed using the CANOCO package (Ter Braak & Smilauer Reference Ter Braak and Smilauer1998), with automatic forward selection of variables significance calculated by Monte Carlo permutation tests.
Results
Milk yield and basic composition
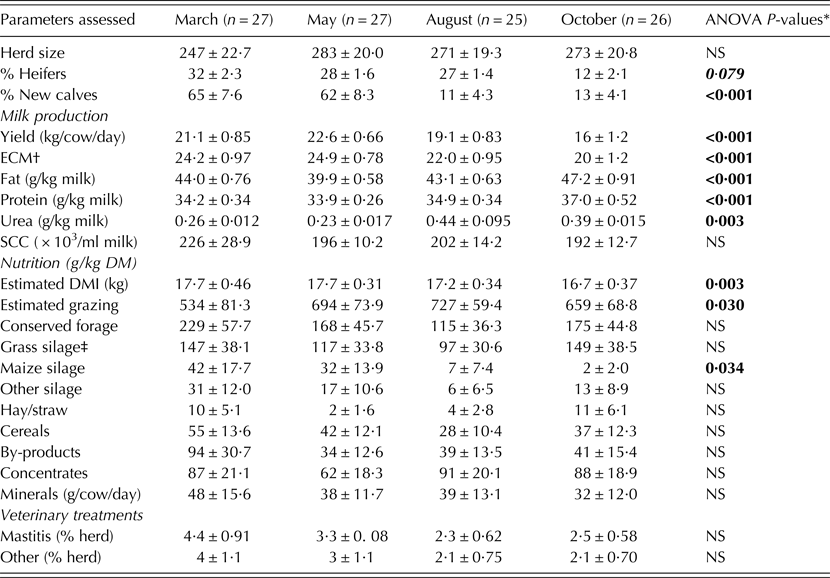
As expected, the performance in milk yield and fat and protein content (Table 1) differed between the three systems of contrasting production intensity and between the 2 years. Milk production expressed as kg/cow/day and energy-corrected milk (ECM; Peterson et al. Reference Peterson, Rezamand, Williams, Price, Chanine and McGuire2012) in CH farms was higher than OM and CL farms (P < 0·01). On the other hand, milk fat (P < 0·01) and protein (P < 0·001) contents were the lowest in CH milk, the highest in CL and showed intermediate values in milk from OM farms. Milk urea was higher during year 1 of the study (P < 0·05) but milk protein (P < 0·001) and SCC (P < 0·05) were higher during year 2. Mastitis treatments were higher during year 1 (P < 0·05). Details of seasonal variation in milk yield, basic composition and mastitis and other veterinary treatments are presented in the appendix, Table A1.
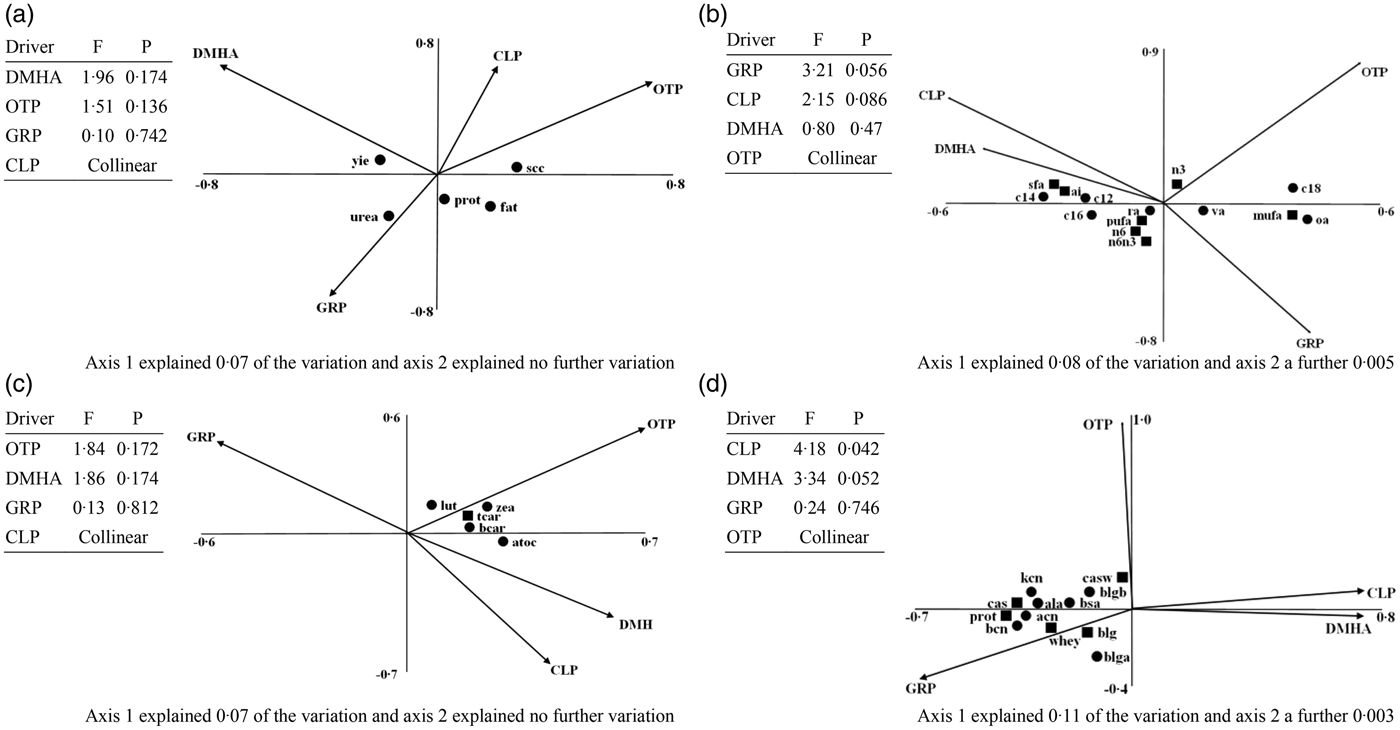
When the relationships between sward productivity/botanical composition and milk yield, basic composition and mastitis and other veterinary treatments were investigated by RDA (Fig. 1a), positive associations were detected between: (i) herbage yield and milk yield along axis 1, (ii) proportion of plants other than grass and clover in the swards with milk SCC and fat content along axis 1 and (iii) grass proportion in the swards with milk fat, protein and urea content along axis 2.
Biplot derived from the redundancy analysis showing the relationship between herbage yield and botanical composition, as assessed over year 2 of the study (2007), and (a) milk yield (yie), basic composition (fat; prot, protein; urea; scc, somatic cell count), (b) fatty acid profile (c12, lauric acid; c14, myristic acid; c16, palmitic acid; c18, stearic acid; oa, oleic acid; va, vaccenic acid; ra, rumenic acid; sfa, saturated fatty acids; mufa, monounsaturated fatty acids; pufa, polyunsaturated fatty acids; n − 3, omega-3 fatty acids; n − 6, omega-6 fatty acids; n6n3, omega-6 : omega-3 fatty acid ratio; ai, atherogenicity index as described by Ulbricht & Southgate (Reference Ulbricht and Southgate1991), (c) α-tocopherol and antioxidant concentrations (atoc, α-tocopherol; lut, lutein; zea, zeaxanthin; bcar, β-carotene; tcar, total carotenoids) and (d) protein composition (αCN, α-casein; βCN, β-casein; κCN, κ-casein; ala, α-lactalbumin; bsa, bovine serum albumin; blgA, β-lactoglobulin A; blgb, β-lactoglobulin B; blg, β-lactoglobulin). Variables are shown as dots (●) and those being summary of other variables are shown as squares (■). Continuous variables (shown as arrows): DMHA, dry matter herbage per hectare; GRP, ryegrass proportion in herbage; CLP, red/white clover proportion in herbage and OTP, other plants proportion in herbage.
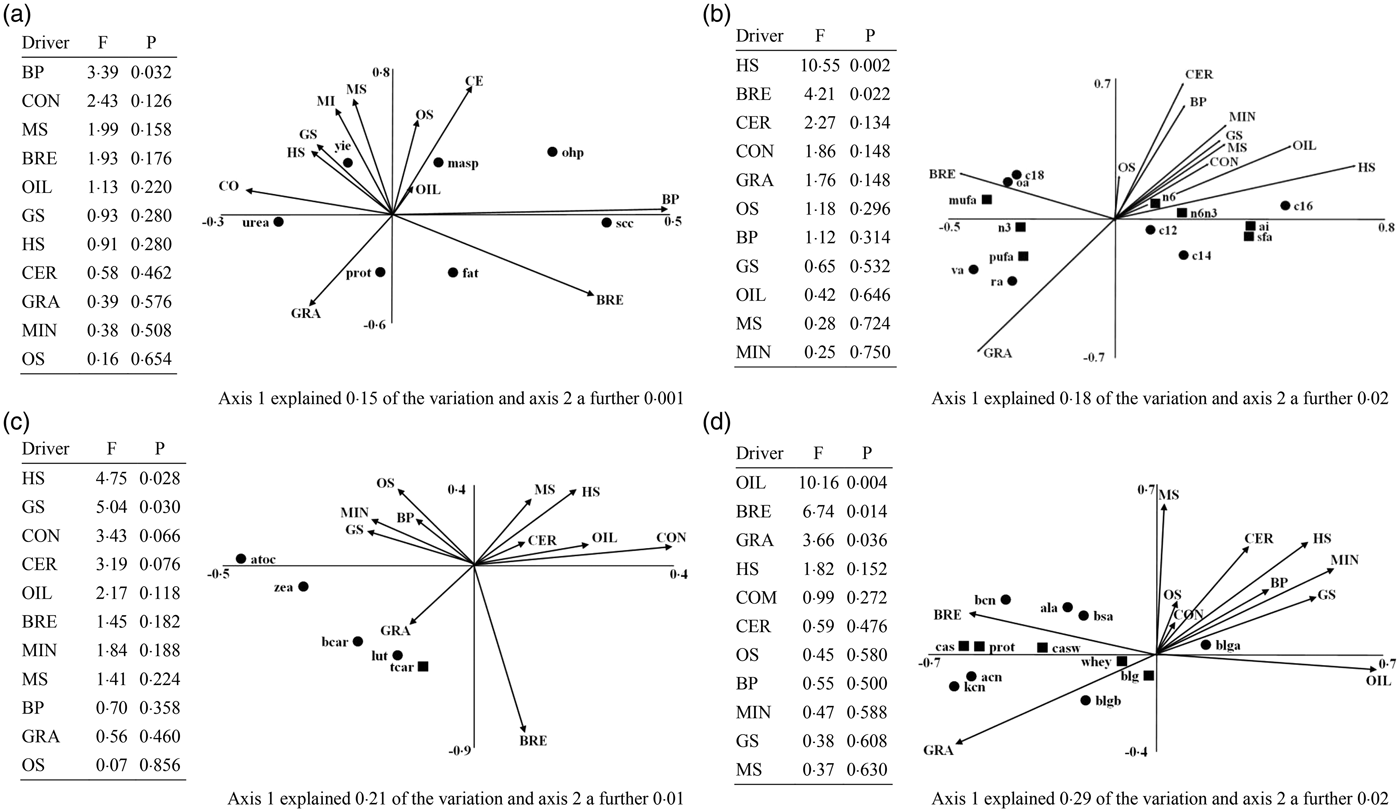
When the relationships between cows’ diet/breed choice and milk yield, basic composition and mastitis and other veterinary treatments were investigated by RDA (Fig. 2a), positive associations were found for: (i) milk protein and fat contents and pasture intake and use of alternative breeds along axis 2, (ii) the use of concentrates and milk urea along axis 2 and (iii) the use of by-products and alternative breeds with SCC. The use of alternative breeds and pasture intake were negatively associated with mastitis and other veterinary treatments but also with milk yield, which was in turn positively linked with feeding silage, cereals and concentrate feeds.
Biplot derived from the redundancy analysis showing the relationship between production system variables, as assessed over the 2 years of the study (2004/05 and 2007), and (a) milk yield (yie) and basic composition (fat; prot, protein; urea; scc, somatic cell count) and veterinary treatments (msp, proportion of mastitis treated cows in the herd; ohp, proportion of other veterinary treated cows in the herd), (b) fatty acid profile (c12, lauric acid; c14, myristic acid; c16, palmitic acid; c18, stearic acid; oa, oleic acid; va, vaccenic acid; ra, rumenic acid; sfa, saturated fatty acids; mufa, monounsaturated fatty acids; pufa, polyunsaturated fatty acids; n − 3, omega-3 fatty acids; n − 6, omega-6 fatty acids; n6n3, omega-6 : omega-3 fatty acid ratio; ai, atherogenicity index as described by Ulbricht & Southgate (Reference Ulbricht and Southgate1991), (c) milk α-tocopherol and antioxidants concentrations (atoc, α-tocopherol; lut, lutein; zea, zeaxanthin; bcar, β-carotene; tcar, total carotenoids) and (d) milk protein composition (αCN, α-casein; βCN, β-casein; κCN, κ-casein; ala, α-lactalbumin; bsa, bovine serum albumin; blgA, β-lactoglobulin A; blgb, β-lactoglobulin B; blg, β-lactoglobulin). Variables are shown as dots (●) and those being summary of other variables are shown as squares (■). Continuous variables (shown as arrows): BRE, % of crossbred and purebred cows of alternative breeds in the herd; GRA, estimated pasture intake; GS, grass silage; MS, maize silage; OS, other silage; HS, hay/straw; CER, cereals; BP, by-products (products from food and drink manufacture, typically sugar beet pulp, maize gluten feed, brewers grains and distillers dark grains); CON, concentrate feed; MIN, minerals/vitamins.
Fatty acid composition
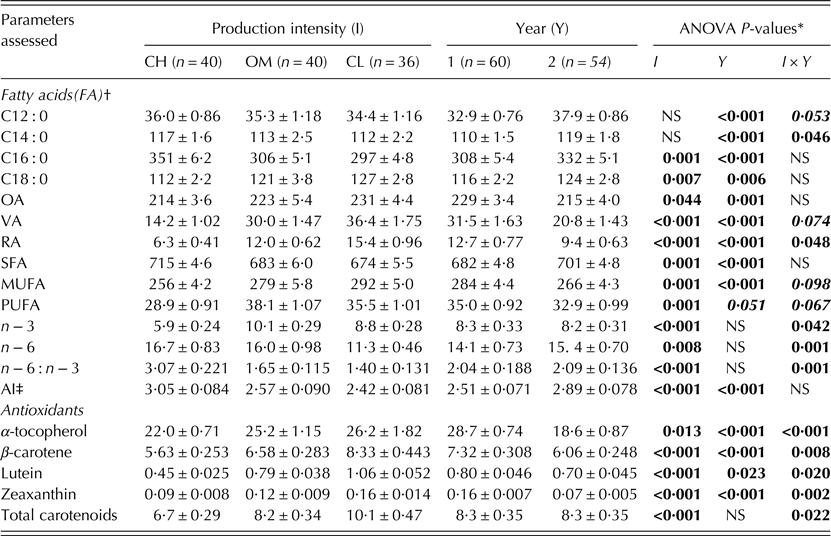
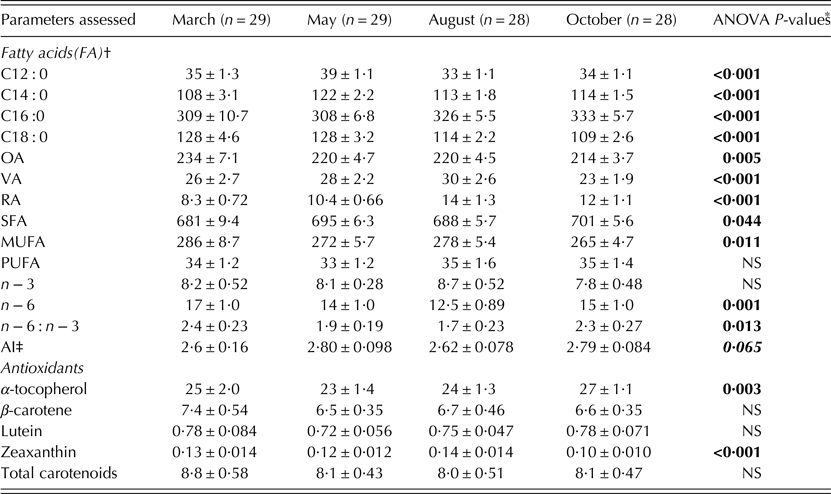
Significant effects of production intensity and year were identified for milk FA profile (Table 2). Milk from CH farms was higher in palmitic acid (P < 0·01) and SFA (P < 0·01) and had a higher atherogenicity index (P < 0·001, AI; as described by Ulbricht & Southgate Reference Ulbricht and Southgate1991) and n − 6 : n − 3 ratio (P < 0·001), whereas it was lower (P < 0·01) in stearic acid, MUFA and PUFA relative to other systems. Milk OA concentrations were higher in CL than CH milk (P < 0·05) while OM milk did not differ from either systems. Milk VA and RA contents were elevated (P < 0·001) with increasing pasture intake (CH < OM < CL). The highest concentrations of n − 3 were seen in OM milk, the lowest in CH with intermediate values in CL milk (P < 0·001). Milk n − 6 concentrations were higher in CH and OM milk than in CL (P < 0·01). Milk collected in year 1 had more OA (P < 0·01), VA (P < 0·001), RA (P < 0·001) and MUFA (P < 0·001), less lauric acid (P < 0·001), myristic acid (P < 0·001), palmitic acid (P < 0·001), stearic acid (P < 0·01), SFA (P < 0·01) and lower AI (P < 0·001) compared with milk from year 2. Details of seasonal variation in milk FA composition are presented in the appendix (Table A2).
Main effect means ± S.E. and ANOVA P-values for the effects of production intensity (conventional high-intensity [CH], organic medium-intensity [OM], conventional low-intensity [CL]) and year (1: 2004/05, 2: 2007) on the fatty acid composition (g/kg total fatty acids) and antioxidant concentration (mg/kg fat) of milk from pasture-based dairy farms in Wales
* Significance was declared at P < 0·05 (significant, bold) and 0·05<P < 0·10 (trend, bold italics); NS: P > 0·10.
† OA, oleic acid (c9 C18 : 1); VA, vaccenic acid (t11 C18 : 1); RA, rumenic acid (c9t11 C18 : 2); SFA, saturated FA (C4 : 0, C6 : 0, C8 : 0, C10 : 0, C12 : 0, C14 : 0, C16 : 0, C18 : 0, C20 : 0, C22 : 0, C24 : 0); MUFA, monounsaturated FA (c9 C14 : 1, c9 C16 : 1, OA, VA, c8 C20 : 1); PUFA, polyunsaturated FA (c9c12 C18 : 2, c9c12c15 C18 : 3, RA, t10c12 C18 : 2, c8,c11,c14 C20 : 3, c5c8c11c14 C20 : 4, c5c8c11c14c17 C20 : 5, c7c10c13c16c19 C22 : 5); n − 3, omega-3 FA (c9c12c15 C18 : 3, c5c8c11c14c17 C20 : 5, c7c10c13c16c19 C22 : 5); n − 6, omega-6 FA (c9c12 C18 : 2, c8,c11,c14 C20 : 3, c5c8c11c14 C20 : 4, c13c16 C22 : 2, t10c12 C18 : 2).
‡ Atherogenicity index (AI): (C12 : 0 + 4 × C14 : 0+C16 : 0)/(sum of unsaturated FA), as proposed by Ulbricht & Southgate (Reference Ulbricht and Southgate1991).
Interactions between production intensity and sampling month were significant for palmitic acid (P < 0·001), VA (P < 0·01), RA (P < 0·01), n − 3 (P < 0·01) and n − 6 : n − 3 ratio (P < 0·01), shown in Fig. 3, and for lauric acid (P < 0·05), myristic acid (P < 0·001), stearic acid (P < 0·001), OA (P < 0·001), SFA (P < 0·001), MUFA (P < 0·001) and AI (P < 0·001), shown in the appendix (Fig. A1). Milk from CH farms had more palmitic acid throughout the study than CL milk and also compared with OM milk during March and May. Milk from CL and OM farms had more VA and RA than CH milk throughout the study, and in August, the difference between CL and OM farms also reached significance, with milk from the former being higher in VA and RA. Similar findings were seen for n − 3, although in this case it was OM milk showing higher concentrations than CL milk in August. Milk from OM and CL farms had lower n − 6 : n − 3 ratio than milk from CH farms with relative differences being the greatest in March and October.
Interaction means ± s.e. (error bars) for the effects of production intensity (conventional high-intensity [CH], organic medium-intensity [OM] and conventional low-intensity [CL]) and sampling month (March, May, August and October) on the (a) concentrations (g/kg total fatty acids) of palmitic acid (C16 : 0), vaccenic acid (VA), rumenic acid (RA), omega-3 fatty acids (n − 3) and n − 6 : n − 3 ratio and (b) concentrations (mg/kg fat) of lutein, β-carotene and total carotenoids of milk from pasture-based dairy farms in Wales. P represents the ANOVA P-value for the interaction. Symbols’ key: 
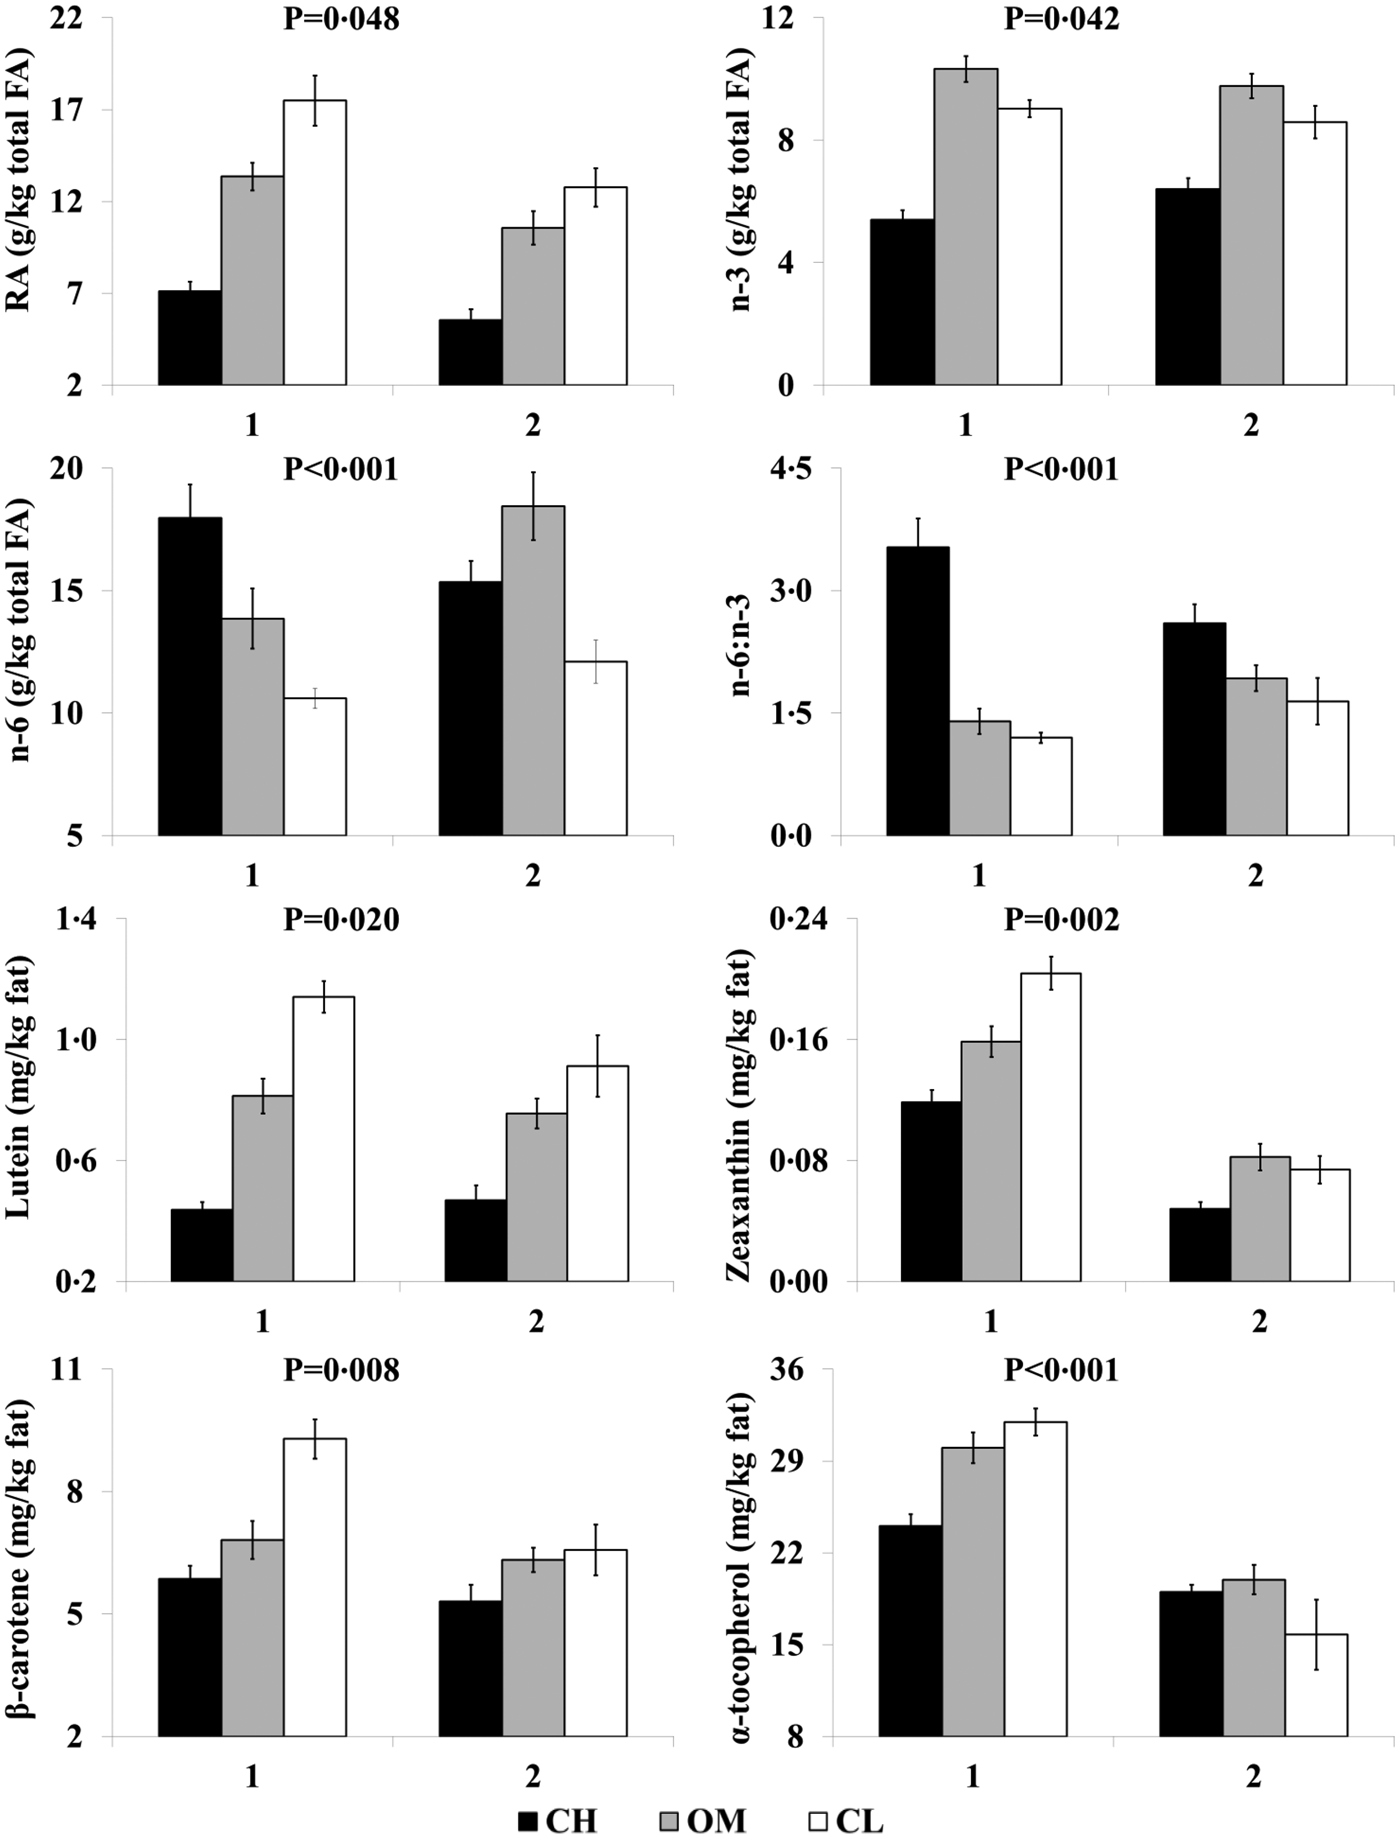
Significant interactions between production intensity and year were detected for myristic acid (P < 0·05, Fig. A2 in the appendix), RA (P < 0·05), n − 3 (P < 0·05) and n − 6 concentrations (P < 0·001) in milk and n − 6 : n − 3 ratio (P < 0·001), as shown in Fig. 4. Milk from CH farms had less RA which was consistent across the 2 years, whereas both OM and CL milk showed a decrease from the first to the second year of the study. Concentrations of n − 3 in milk did not differ between years in any of the systems but n − 6 in OM milk was higher in the second than in the first year. Milk from CH farms showed lower n − 6 : n − 3 ratio in year 2, compared with year 1 but this was not found in milk from OM and CL farms.
Interaction means ± s.e. (error bars) for the effects of production intensity (conventional high-intensity [CH], organic medium-intensity [OM] and conventional low-intensity [CL]) and year (1: 2004/05, 2: 2007) on the (a) concentrations (g/kg total fatty acids) of rumenic acid (RA), omega-3 fatty acids (n − 3), omega-6 fatty acids (n − 6) and the n − 6 : n − 3 ratio and (b) contents (mg/kg fat) of lutein, zeaxanthin, β-carotene and α-tocopherol of milk from pasture-based dairy farms in Wales. P represents the ANOVA P-value for the interaction. Symbols’ key: 
Redundancy analyses (Fig. 1b) showed a positive association between the relative proportion of grass and other plants in the swards with milk stearic acid, OA and MUFA and to a lesser extent with VA and n − 3, while individual and total SFA were positively linked with herbage yield and clover content, along axis 1. When dietary components and breed choice were compared with milk FA profiles by RDA (Fig. 2b) stearic acid, OA, VA, RA, MUFA, PUFA and n − 3 were positively associated with predicted pasture intake and the use of breeds other than Holstein/Friesian and negatively linked with other feeds including silage, hay/straw, cereals, concentrate feed and oil supplementation, along axis 1 in (Fig. 2b). The latter feeding practices were positively linked to milk palmitic acid, SFA and AI, and to a lesser extent lauric acid, myristic acid, n − 6 and n − 6 : n − 3 ratio.
Antioxidant composition
As with FA profiles, significant differences were detected for α-tocopherol and all antioxidants assessed in milk, influenced by system of production and year of sampling, as shown in Table 2. α-tocopherol was higher in CL than CH milk while OM milk did not differ from either of the other systems (P < 0·05). Lutein, β-carotene and total carotenoids concentrations in milk followed pasture intake (CH < OM < CL; P < 0·001) while more zeaxanthin was found in CL compared with CH and OM milk (P < 0·001). Milk collected in year 1 had more α-tocopherol (P < 0·001), β-carotene (P < 0·001), lutein (P < 0·05) and zeaxanthin (P < 0·001) than milk from year 2. Details of seasonal variation in milk antioxidant composition are presented in the appendix (Table A2).
Interactions between production intensity and sampling month were detected for β-carotene (P < 0·05), lutein (P < 0·001) and total carotenoids (P < 0·05), as shown in Fig. 3, and α-tocopherol (P < 0·05), as shown in Fig. A1 (see appendix). Lutein, β-carotene and total carotenoids were consistently higher in CL than in CH milk throughout the study and higher than OM milk in August and October. The OM milk contained more lutein in March and October and more β-carotene and total carotenoids in March, compared with CL milk.
Interactions between production intensity and year were detected for concentrations of α-tocopherol (P < 0·001), lutein (P < 0·05), zeaxanthin (P < 0·01), β-carotene (P < 0·01), as shown in Fig. 4, and total carotenoids (P < 0·05), as shown in Fig. A2 of the appendix. Higher contents of α-tocopherol in OM and CL compared with CH milk observed in year 1 were not confirmed during year 2, when OM milk was higher than CL milk. In year 1, lutein and zeaxanthin content rose with increased pasture intake (CH<OM<CL) although these relations were not all significant in year 2, when: (i) concentrations of lutein in OM and CL were similar but still higher than CH, (ii) only OM had more zeaxanthin than CH milk and (iii) only CL milk had more total carotenoids than CH milk. Milk content of β-carotene dropped between first and second year only in CL farms thus eliminating the higher values found in year 1 when compares with CH and OM milk.
Redundancy analyses (Fig. 1c) revealed milk α-tocopherol and carotenoids were positively linked to herbage yield and proportion of clover and other plants in the swards. The use of alternative genetics and predicted pasture intake were positively associated with milk β-carotene, lutein and total carotenoids, along axis 2, while α-tocopherol and zeaxanthin concentrations were negatively associated with the proportion of maize silage, concentrate feeds and oil supplementation in the diet, along axis 1 (Fig. 2c).
Protein composition
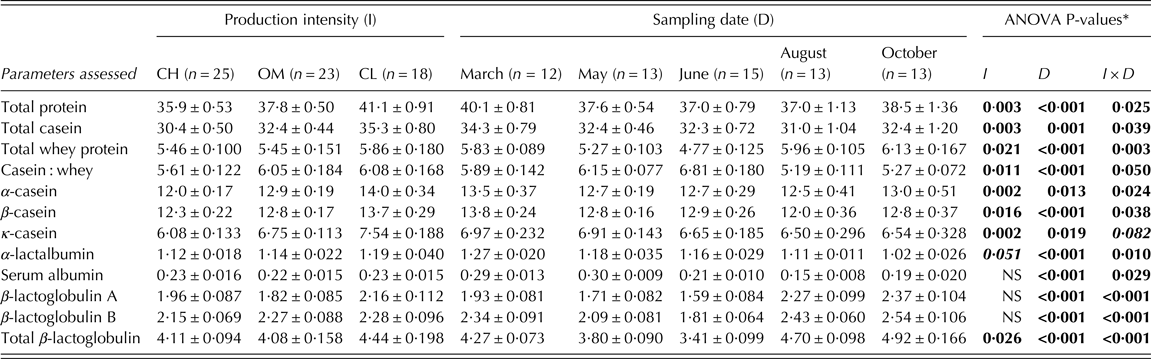
Table 3 shows how milk protein composition was influenced by production systems and season. Total protein (P < 0·01), casein (P < 0·01), whey proteins (P < 0·05), α-casein (αCN, P < 0·01) and β-casein (βCN, P < 0·05) were higher in CL compared with CH and OM milk. Concentrations of κ-casein (κCN) increased (P < 0·01) with higher pasture reliance (CH < OM < CL) and the ratio of casein : whey proteins was higher (P < 0·05) in CL and OM milk than in CH milk. While the overall effect of production intensity on total β-lactoglobulin (βLg) content of milk appeared to be significant (P < 0·05) in the ANOVA, mean values determined by Tukey's honest significant difference test proved not to differ (P > 0·05). March milk was higher in protein (P < 0·001), αCN (P < 0·05), βCN (P < 0·001) and κCN (P < 0·05) compared with that produced in May, June and August and total casein was higher (P < 0·01) in milk collected in March and May compared with August. Concentrations of whey protein, βLg and its variants, A (βLgA) and B (βLgB), were lower in March and June and increased over the months of August and October (P < 0·001). The casein : whey protein ratio was highest in June, intermediate in March and May and lowest in August and October (P < 0·001). On the other hand, milk α-lactalbumin (αLa) was highest in March, intermediate in May–August and the lowest in October samples (P < 0·001).
Main effect means±s.e. and ANOVA P-values for the effect of production intensity (conventional high-intensity [CH], organic medium-intensity [OM], conventional low-intensity [CL]) and sampling date (March, May, June, August and October) on the protein composition (g/kg of milk) of milk from pasture-based dairy farms in Wales over year 2 of the study (2007)
* Significance was declared at P < 0·05 (significant, bold) and 0·05<P < 0·10 (trend, bold italics); NS: P > 0·10.
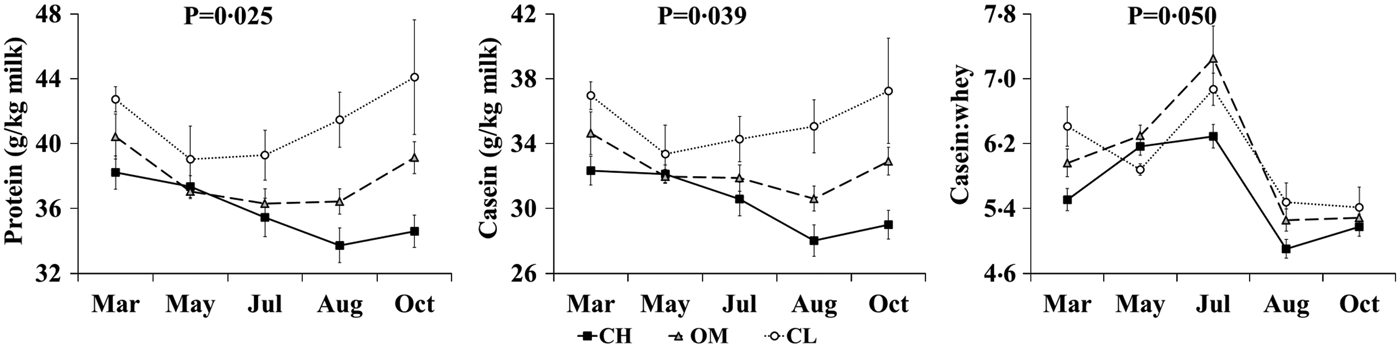
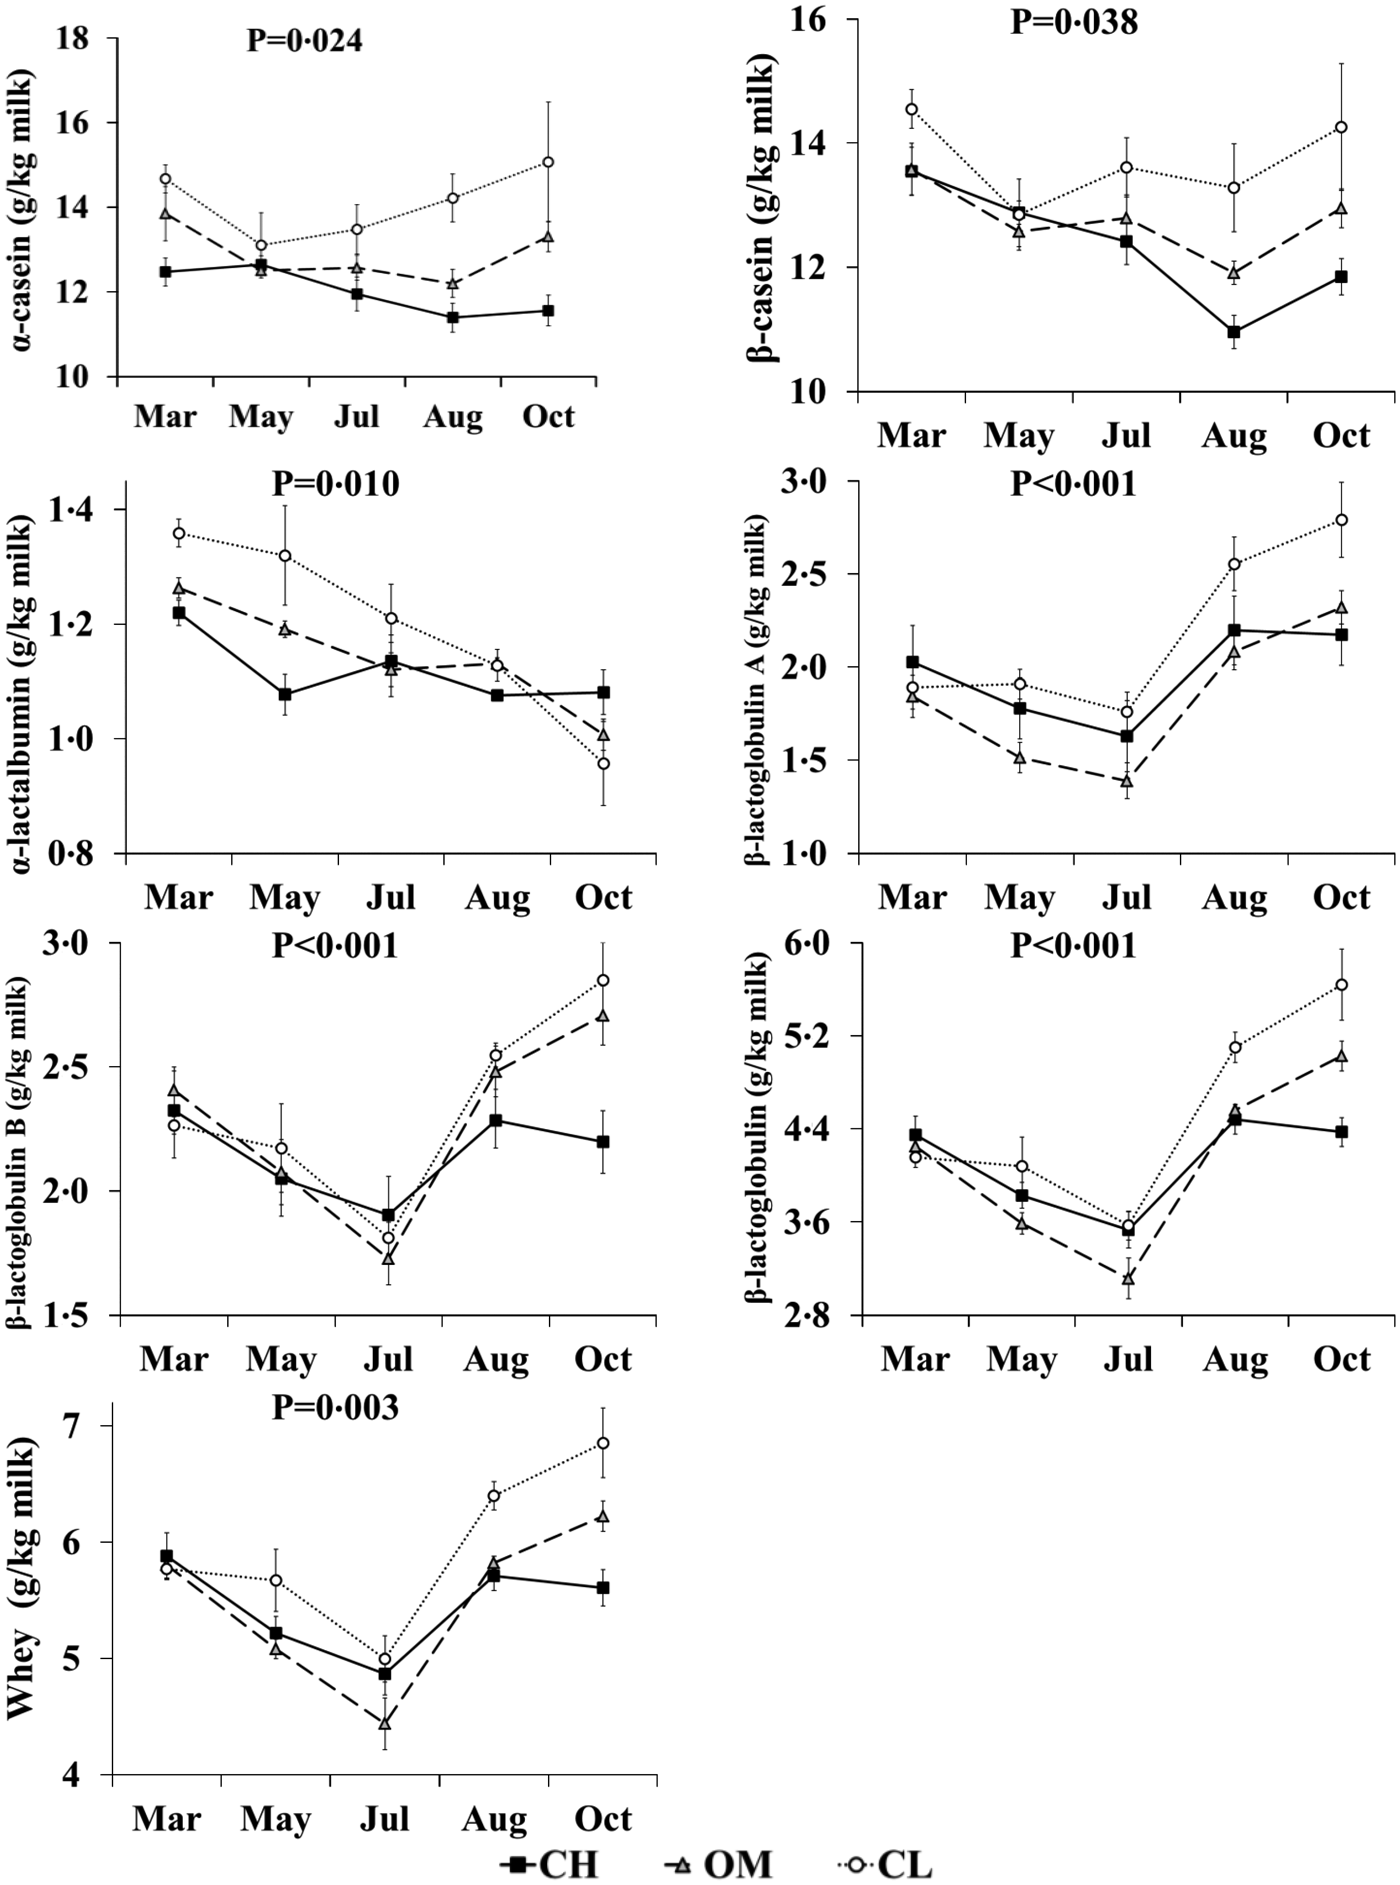
Interactions between production intensity and sampling month were significant for all individual proteins and protein classes (Fig. 5 and Fig. A3 in the appendix), except for κCN. Total protein concentrations were higher (P < 0·05) in milk from CL farms compared with CH milk throughout the survey, except for May when the levels were similar. Total protein in OM milk was higher than in CH milk during October and lower than CL milk in August and October (P < 0·05) with similar patterns seen for milk casein concentrations (P < 0·05). The casein : whey protein ratio was higher in milk from CL farms compared with CH farms in March and August (P < 0·05).
Interaction means ± s.e. (error bars) for the effects of production intensity (conventional high-intensity [CH], organic medium-intensity [CH], conventional low-intensity [CL]) and sampling date (March, May, June, August and October) on the concentrations (g/kg milk) of protein, casein and casein : whey protein ratio of milk from pasture-based dairy farms in Wales over year 2 of the study (2007). P represents the ANOVA P-value for the interaction. Symbols’ key: 
When the relationships between milk protein composition with sward characteristics were determined by RDA (Fig. 1d), the proportion of clover and herbage yield were negatively linked with total protein and individual and total caseins, along axis 1. In addition, all individual proteins (except for βLgA) and the casein : whey protein ratio were positively associated with alternative breeding and predicted pasture intake and negatively associated with inclusion of silage, cereals, by-products and hay/straw in the diet, along axis 1 (Fig. 2d).
Discussion
Effect on milk yield and basic composition
Herds under CH management, dominated by Holstein/Friesian cows fed more silage and concentrates throughout the year, produced more milk than herds milking crossbred cows on a predominantly grazing system, as shown previously by other authors (White et al. Reference White, Bertrand, Wade, Washburn, Green and Jenkins2001; Carroll et al. Reference Carroll, DePeters, Taylor, Rosenberg, Perez-Monti and Capps2006; Stergiadis et al. Reference Stergiadis, Leifert, Seal, Eyre, Nielsen, Larsen, Slots, Steinshamn and Butler2012). However, despite higher supplementation, grazing was still important to these farms and the RDA revealed a very close association between herbage yield from grazing paddocks and daily milk yield per cow, pointing out the importance of optimum grass management in pasture-based herds to maximize output. The inclusion of Jersey genetics in OM and CL herds is likely to contribute to lower milk output and explain the higher milk solid content for these herds (White et al. Reference White, Bertrand, Wade, Washburn, Green and Jenkins2001; Croissant et al. Reference Croissant, Washburn, Dean and Drake2007; Stergiadis et al. Reference Stergiadis, Seal, Leifert, Eyre, Larsen and Butler2013). A decrease in milk fat content from cows under pasture-based diets has been shown by other studies (White et al. Reference White, Bertrand, Wade, Washburn, Green and Jenkins2001; Croissant et al. Reference Croissant, Washburn, Dean and Drake2007), but in the present study it seems the impact of genetics was stronger than the possible negative influence of low fibre, leafy herbage on milk fat content.
Since OM and CL herds block-calved in spring, all cows were in early lactation in March and late lactation in October, making it impossible to differentiate between seasonal and stage of lactation effects on milk quality, for 10 of the 15 herds in the present study. This could partly explain overall patterns in milk yield, peaking in May and being the lowest in October. Milk fat and protein content followed a contrasting pattern throughout the year, which may be partly explained by the negative correlation between milk yield and solids content (Chalupa & Sniffen Reference Chalupa and Sniffen2000).
Interestingly, the proportion of cows showing signs of mastitis was numerically higher in CH than OM and CL herds, despite greater use of preventive antibiotic treatments which are not allowed in organic farming and scarcely used in CL systems, although the difference was not statistically significant. However, mastitis risk is influenced by a wide range of confounding factors and it is difficult to explain this effect in the present study. The finding that pasture intake and alternative genetics are negatively associated with mastitis and other veterinary treatments, revealed by RDA analyses, is in line with previously published work showing lower clinical and subclinical rates of mastitis in grazing cows (Goldberg et al. Reference Goldberg, Wildman, Pankey, Kunkel, Howard and Murphy1992).
Effect on fatty acid composition
Lower production intensity has been shown to improve milk FA profiles by reducing SFA and increasing MUFA and PUFA (Butler et al. Reference Butler, Nielsen, Slots, Seal, Eyre, Sanderson and Leifert2008; Slots et al. Reference Slots, Butler, Leifert, Kristensen, Skibsted and Nielsen2009; Stergiadis et al. Reference Stergiadis, Leifert, Seal, Eyre, Nielsen, Larsen, Slots, Steinshamn and Butler2012) and the same was observed in the present study. Nutritionally undesirable SFA, including palmitic acid, were lower in milk from OM and CL farms; whilst unsaturated FA such as OA, VA, RA and n − 3, beneficial for human health, were considerably higher. Compared to published composition of conventional retail milk in North East England (Butler et al. Reference Butler, Stergiadis, Seal, Eyre and Leifert2011), milk from CL farms in the present study had 60% more n − 3 and 2·75 times more RA. Similarly, OM milk in the present study contained 17% less SFA, 15% more n − 3 and 62% more RA than comparable values reported for retail organic milk (Butler et al. Reference Butler, Stergiadis, Seal, Eyre and Leifert2011), indicating wide variation in management (including pasture reliance) and hence milk composition within apparently similar production systems in the same country. These differences reinforce the opinion that aspects of quality rely more on dairy diets rather than the production system per se and sustaining high pasture intake improves milk quality both in conventional and organic systems. To some extent, prescribed standards ensure organic producers follow fairly similar practices but variation in conventional management is much greater from pasture-based at one extreme to intensive systems with year round housing at the other. Hence the scope to improve milk quality by encouraging pasture intake seems greater in conventional milk production.
The desirable impact of fresh grass intake on milk FA composition has been reviewed (Elgersma et al. Reference Elgersma, Tamminga and Ellen2006) and confirmed by RDA in the present study. Fresh grass is richer in PUFA, especially α-linolenic, compared to conserved forages (Glasser et al. Reference Glasser, Doreau, Maxin and Baumont2013) and its intake increases the appearance of α-linolenic, products of PUFA rumen biohydrogenation and RA in milk (Chilliard et al. Reference Chilliard, Ferlay, Mansbridge and Doreau2000). However, positive associations, shown by RDA, between proportion of grasses in pasture with milk OA and MUFA, and n − 3 in milk with the proportion of plants other than grasses and clover in the pastures, confirms botanical diversity has an additional role in improving milk FA profiles.
Milk from both OM and CL systems showed more desirable FA profiles than CH milk, but there were also differences between these two systems. For example, CL milk was higher in VA and RA compared with OM milk, possibly reflecting the higher pasture intake on CL farms (Butler et al. Reference Butler, Nielsen, Slots, Seal, Eyre, Sanderson and Leifert2008) exacerbated by lower rates of hydrogenation (less VA production) associated with clover inclusion in the OM swards (Dewhurst et al. Reference Dewhurst, Delaby, Moloney, Boland and Lewis2009; Lee et al. Reference Lee, Theobald, Tweed, Winters and Scollan2009; Lejonklev et al. Reference Lejonklev, Storm, Larsen, Mortensen and Weisbjerg2013). This finding is particularly interesting because Stergiadis et al. (Reference Stergiadis, Leifert, Seal, Eyre, Nielsen, Larsen, Slots, Steinshamn and Butler2012) reported that raising pasture intake from 200 to 370 g/kg of DMI throughout the year did not have a significant impact on VA and RA contents of milk but a similar increase (albeit from a much higher baseline) in pasture intake in the present study (700 g/kg DMI for OM v. 840 g/kg DMI on CL farms) did significantly raise milk VA and RA concentrations by 21 and 28%, respectively. These differences were more pronounced when comparing milk from CH and OM farms; VA and RA were c. 2·1 and 1·9 times higher when pasture intake increased by 270 g/kg DMI (430–700 g/kg DMI). This suggests the response in milk composition from increased pasture reliance may be more apparent when a high proportion of cows’ diet already comes from fresh grass (possibly above the 430 g/kg DMI recorded in the present study). Another explanation could be that feed components, other than fresh grass, have a greater negative influence on RA when pasture intake is moderate or low.
Milk from OM farms showed the highest n − 3 content despite the medium pasture intake, most likely explained by the inclusion of clover and other non-grass plants in organic swards. Clover can increase n − 3 content of milk by both increasing n − 3 intake and reducing its ruminal biohydrogenation (Dewhurst et al. Reference Dewhurst, Delaby, Moloney, Boland and Lewis2009; Lee et al. Reference Lee, Theobald, Tweed, Winters and Scollan2009; Lejonklev et al. Reference Lejonklev, Storm, Larsen, Mortensen and Weisbjerg2013). However, RDA in the present study showed that the presence of ‘plants other than grass or clover’, a practice more common in organic farming in UK, may have a greater impact on milk beneficial FA than clover itself. This is in line with studies in alpine regions showing increasing botanical diversity of the swards has a positive impact of milk FA profiles, by raising contents of beneficial FA such as MUFA and PUFA (Collomb et al. Reference Collomb, Bisig, Butikofer, Sieber, Bregy and Etter2008). Thus, when comparing FA profiles of OM and CL milk, both show advantages; milk from OM herds was higher in n − 3 (as a result of botanically diverse swards) whereas CL milk was higher in RA (as a result of greater reliance on grazing).
All milk types in the present study had n − 6 : n − 3 ratio within the recommended 1–4 : 1 range (Simopoulos Reference Simopoulos2002), but lower ratio of OM and CL milks can be considered more desirable. Western diets are dominated by n − 6, over-consumption of which may increase the risk of CVD, cancer, and inflammatory and autoimmune diseases (Simopoulos Reference Simopoulos2002). Although a threshold of 2·3, under which no further CVD-prevention benefits may be expected, has been suggested in other studies (Benbrook et al. Reference Benbrook, Butler, Latif, Leifert and Davis2013) individual foods with a n − 6 : n − 3 ratio within the recommended range or lower would help sustain the recommended ratio for total diet and compensate for high n − 6 intake from other sources. Notably, n − 6 : n − 3 ratios of milk from pasture-based systems in the present study were over 2.5 times lower than reported values for conventional (1·40 v. 3·70) and over 1.5 times lower for organic (1·65 v. 2·70) UK retail milk (Butler et al. Reference Butler, Stergiadis, Seal, Eyre and Leifert2011).
Effect on antioxidant composition
As suggested by RDA, the higher concentrations of antioxidants in milk from OM and CL systems can largely be explained by a combination of greater estimated intake from pasture and higher proportion of Jersey genetics in these herds; two parameters that may have a synergistic effect. Consequently, CL milk showed the highest concentrations of lutein, β-carotene and total carotenoids throughout the year. The antioxidant content of milk reflects its availability in cows’ diets (Noziere et al. Reference Noziere, Graulet, Lucas, Martin, Grolier and Doreau2006; Agabriel et al. Reference Agabriel, Cornu, Journal, Sibra, Grolier and Martin2007); however, alternative breeds such as Jersey, Guernsey, Ayrshire, Shorthorn have been shown to transfer antioxidants more efficiently from diet to milk compared with Holstein/Friesian cows (Noziere et al. Reference Noziere, Graulet, Lucas, Martin, Grolier and Doreau2006). Since the carotenoid content of forages declines during ensiling (20–80% loss) or haymaking (83% loss) and maize silage and concentrate feeds (used in higher amounts in CH farms) are both relatively low in antioxidants (Noziere et al. Reference Noziere, Graulet, Lucas, Martin, Grolier and Doreau2006), it was not surprising that CH milk was the lowest in antioxidants. Results from RDA in the present study confirm that milk carotenoid content was: (i) mainly influenced by pasture intake and breeds used and (ii) more positively influenced by plants other than grass and clover in the swards, implying an extra advantage on OM farms.
All milk collected in the present study was relatively high in antioxidants. To our knowledge, there are no studies reporting details of antioxidant content of milk available to the public in the UK. In comparison to a previous UK farm-based survey in north-east England (Stergiadis et al. Reference Stergiadis, Leifert, Seal, Eyre, Nielsen, Larsen, Slots, Steinshamn and Butler2012), results from pasture-based production in Wales showed CL milk had 2–5 times more lutein, zeaxanthin and total carotenoids and 42–61% more α-tocopherol than conventional milk in north-east England. Milk from OM farms had 80% more lutein, 140% more zeaxanthin and 30% more α-tocopherol than organic milk in north-east England (Stergiadis et al. Reference Stergiadis, Leifert, Seal, Eyre, Nielsen, Larsen, Slots, Steinshamn and Butler2012). These differences between the studies confirm, as with FA profile, the high variability in milk quality within production systems possibly as a consequence of differences in pasture reliance (due to climatic conditions) and breeds used.
Effect on protein composition
The higher casein : whey protein ratio in OM and CL compared with CH milk is a result of higher concentrations of individual caseins (αCN, βCN and κCN), since individual and total whey proteins were fairly consistent. This finding is of nutritional importance because caseins and bioactive peptides produced during milk digestion or fermentation have been associated with positive effects on human health (Severin & Wenshui Reference Severin and Wenshui2005; Korhonen & Pihlanto Reference Korhonen and Pihlanto2006). This finding may also be relevant for processing, especially cheese making, because milk high in individual caseins and casein : whey protein ratio gives better coagulation, curd formation and eventual cheese yield (Christian et al. Reference Christian, Grainger, Sutherland, Mayes, Hannah and Kefford1999; Wedholm et al. Reference Wedholm, Larsen, Lindmar-Mansson, Karlsson and Andren2006). Guinee et al. (Reference Guinee, Mulholland, Mullins, Corcoran, Connolly, Beresford, Mehra, O'Brien, Murphy, Stakelum and Harrington1998) reported milk from grazing cows produced 7% more moisture-adjusted Mozzarella cheese when daily herbage intake increased from 16 to 24 kg/cow/day. However, other studies report a depression in protein content of milk from pasture-based systems in summer, associated with a reduction in grass quality (lower digestibility) (O'Donovan et al. Reference O'Donovan, Lewis and O'Kiely2011); this impact may be less in clover-rich swards (OM) due to the lower rate of decline in digestibility as plants mature compared to ryegrass (Dewhurst et al. Reference Dewhurst, Delaby, Moloney, Boland and Lewis2009). Low milk protein levels were not observed in systems with a high pasture intake (OM and CL) in the present study, again possibly indicating the greater impact of Jersey genetics and the influence of being mid/late lactation with moderate milk yield, since the concentration of milk solids is inversely related to yield. The increase in casein and total protein content of milk from spring-block calving herds at pasture from August to late October has previously been reported by O'Brien (1999) followed by a decline in milk processing characteristics after that period, although samples were not collected that late in lactation in the present study.
Herd genetic composition varied between management systems, with the contribution of alternative breeds increasing with decreased production intensity (CH < OM < CL). Alternative breeds, such as Jersey and Ayrshire, more common in the lower intensity systems (OM and CL), are known to produce milk with more total protein and casein and a higher casein : protein ratio (Cerbulis & Farrell Reference Cerbulis and Farrell1975; Carroll et al. Reference Carroll, DePeters, Taylor, Rosenberg, Perez-Monti and Capps2006; Stergiadis et al. Reference Stergiadis, Seal, Leifert, Eyre, Larsen and Butler2013). The impact of breed has been described as the most pronounced factor affecting milk protein content (Walker et al. Reference Walker, Dunshea and Doyle2004; Stergiadis et al. Reference Stergiadis, Leifert, Seal, Eyre, Nielsen, Larsen, Slots, Steinshamn and Butler2012, Reference Stergiadis, Seal, Leifert, Eyre, Larsen and Butler2013), supporting the RDA findings in the present study. A negative association between clover content of pasture with individual and total protein and caseins was also found, which could have an adverse effect on milk quality from OM farms but appears to be counterbalanced by the presence of crossbred cows. However, other studies report that clover in pastures has either no impact or increases milk protein content (Murphy & O'Mara Reference Murphy and O'Mara1993; Dewhurst et al. Reference Dewhurst, Delaby, Moloney, Boland and Lewis2009) and an apparent negative relationship in RDA may be partially explained by the facts that: (i) most clover was found in the OM farms, (ii) CL herds had more Jersey cows than OM and (iii) CH cows received more concentrates (known to increase milk protein content) in their diet than OM cows.
Varying pasture intake may also explain differences in protein composition between production systems; an increase in individual casein concentrations in milk (αCN, βCN and κCN) due to ad libitum, instead of restricted, grazing has been shown by other authors although changes were inconsistent throughout the grazing season (Christian et al. Reference Christian, Grainger, Sutherland, Mayes, Hannah and Kefford1999; Mackle et al. Reference Mackle, Bryant, Petch, Hill and Auldist1999; Auldist et al. Reference Auldist, Thomson, Mackle, Hill and Prosser2000).
Milk quality by year interactions
Studies in retail milk show management by year and breed by year interactions affect milk FA and protein profiles and α-tocopherol contents of milk (Butler et al. Reference Butler, Stergiadis, Seal, Eyre and Leifert2011; Stergiadis et al. Reference Stergiadis, Seal, Leifert, Eyre, Larsen and Butler2013). Although the same was found for most of the beneficial aspects of milk quality relating to OM and CL farms (lower SFA, higher MUFA, PUFA, n − 3, OA and VA), milk contents of RA, α-tocopherol, lutein, zeaxanthin and β-carotene were lower for OM or CL herds in year 2, an effect not observed for CH milk, which was consistent across the years.
Despite pasture intake by CH herds being reduced from 550 g/kg DMI in year 1 to only 250 g/kg DMI in year 2, milk RA content did not change significantly. This may reinforce the theory that milk RA concentration is more susceptible to changes in fresh forage intake when a high or very high proportions of the diet come from grazing; Stergiadis et al. (Reference Stergiadis, Leifert, Seal, Eyre, Nielsen, Larsen, Slots, Steinshamn and Butler2012) have shown that within a range of relatively moderate intake (200–370 g/kg DMI) there is little impact of pasture intake on RA. However, a closer investigation showed variation between production systems over and above herbage intake; perhaps the existence of this interaction is due to year on year changes in RA content in milk from OM and CL farms, brought about by dietary changes other than pasture intake, such as differing inclusion of hay/straw or other silages, although the multivariate analysis does not support this explanation. The lower lutein, zeaxanthin, β-carotene and total carotenoids content of OM and CL milk in year 2 may be explained by a corresponding decrease in grass silage intake and increase in concentrate supplementation, despite the overall similar proportions of pasture intake.
This means, despite OM and CL milk showing a more desirable nutritional profile than CH in both years, optimizing individual management (high pasture intake, low intakes of maize silage, cereals hay and concentrates) is important to maximize the positive impact on milk quality and offer consistency across years.
Applications of pasture-based milk in industry and human nutrition
Higher pasture intake results in milk with more n − 3, PUFA, RA, antioxidants, α-tocopherol and caseins which may show benefits on animal health, manufacturing properties of milk and human nutrition. This finding was consistent over the years and, in most cases, also between sampling month within each year.
The combination of fresh herbage-rich diets along with crossing Holstein/Friesian cows with alternative breeds (Jersey, various ‘Red’ genotypes) has previously been shown to improve welfare, fertility, milk solids and economic efficiency in pasture-based systems (Weigel & Barlass Reference Weigel and Barlass2003; Sorensen et al. Reference Sorensen, Norberg, Pedersen and Christensen2008). Studies with diets rich in n − 3 (through linseed supplementation or inclusion of red clover) have been shown to improve dairy cow fertility (Dewhurst et al. Reference Dewhurst, Delaby, Moloney, Boland and Lewis2009) but whether a similar effect may be induced by high n − 3 pasture-based diets was not assessed in the present study. In terms of milk processing, pasture-based dairying using alternative breeds can provide milk with desirable casein content (improved cheese-making properties) throughout the year, especially if seasonal effects can be eliminated by proper blending of milk from spring and autumn calving herds at critical periods (November–December) (O'Brien 1999). It can also improve butter spreadability by replacing SFA with MUFA and PUFA (Bobe et al. Reference Bobe, Hammond, Freeman, Lindberg and Beitz2003). The combined practices of high pasture intake and crossbreeding improve the antioxidant status of milk; useful both for cows’ health and protection against oxidation of the high PUFA levels in pasture-based milk, through the supply chain. Given the multiple benefits, a deeper insight to optimizing crossbreeding strategies for certain production systems should be further investigated in large individual animal studies.
The present study highlights the scope to market premium quality, pasture-based dairy products, offering an increased supply of nutritionally relevant components; although intakes of beneficial compounds might be enhanced, the present study cannot predict an impact on human health. Other studies have reported that infants consuming organic dairy products experienced reduced eczema incidence compared to those on conventional diets (Kummeling et al. Reference Kummeling, Thijs, Huber, van de Vijner, Snijders, Penders, Stelma, van Ree, van den Brandt and Dagnelie2008). In addition, Benbrook et al. (Reference Benbrook, Butler, Latif, Leifert and Davis2013) developed dietary scenarios of replacing dietary non-dairy lipids with full-fat dairy products and emphasized that substituting half of total dietary lipid intake with dairy fat, coupled with avoidance of oils high in linoleic acid, would decrease dietary linoleic : α-linolenic ratio (the two main representative FA in n − 6 : n − 3 ratio) from 10·01 to 5·15 (when using conventional dairy products) or from 7·83 to 4·10 (when using organic dairy products). Ratios of n − 6 : n − 3 were even lower for conventional and organic milk in the present study than those used by Benbrook et al. (Reference Benbrook, Butler, Latif, Leifert and Davis2013) (1·40 v. 2·52 and 1·65 v. 2·28, respectively), implying that milk produced with a high reliance on pasture could play a significant role in decreasing dietary n − 6 : n − 3 to fall within the recommended level (1–4 : 1) and closer to the target ratio (2·3) (Simopoulos Reference Simopoulos2002; Benbrook et al. Reference Benbrook, Butler, Latif, Leifert and Davis2013).
The comparison of SFA contents found in the present study with other UK farm-based and retail surveys (Ellis et al. Reference Ellis, Innocent, Grove-White, Cripps, McLean, Howard and Mihm2006; Butler et al. Reference Butler, Stergiadis, Seal, Eyre and Leifert2011; Stergiadis et al. Reference Stergiadis, Leifert, Seal, Eyre, Nielsen, Larsen, Slots, Steinshamn and Butler2012) reinforces the opinion that differences within a production system may be higher than between production systems, depending on individual management practices (primarily diet and breed choice). Average milk contents of SFA extends between 673 and 715 g/kg total FA in different UK dairy production systems, ranging from highly intensive all-year round indoor systems, feeding 500 g/kg DMI from concentrates and milking cows three times per day, to pasture-based systems in the present study (Ellis et al. Reference Ellis, Innocent, Grove-White, Cripps, McLean, Howard and Mihm2006; Butler et al. Reference Butler, Stergiadis, Seal, Eyre and Leifert2011; Stergiadis et al. Reference Stergiadis, Leifert, Seal, Eyre, Nielsen, Larsen, Slots, Steinshamn and Butler2012). This difference is relatively small compared to the threshold of decreasing milk SFA content by 150 g/kg total FA before we could expect an impact on public health and reduction on health expenses (Kliem et al. Reference Kliem, Shingfield, Livingstone and Givens2013).
The lower content of SFA and higher MUFA and PUFA levels were consistent in milk from pasture-based dairy systems of lower intensity. However, milk from non-certified pasture-based farms is not traceable as liquid milk or processed dairy products in the UK market. Due to supply lines, such milk is often bulked with milk from farms under more intensive production (usually supplied from more farms with greater yields) thus diluting the higher content of beneficial n − 3, RA, carotenoid and proteins in the supply chain. Although pasture-based production is practised, consumers can rarely access its milk or other dairy products, making the development of separate production lines, or direct selling of pasture-based milk, a consideration for the future. However, pasture-based production is limited by climate and soil conditions, and by seasonality (the majority of farms spring-block calve in early spring and do not produce milk in winter). Methods to improve winter milk FA profiles by oilseed supplementation (Glasser et al. Reference Glasser, Doreau, Maxin and Baumont2013; Stergiadis et al. Reference Stergiadis, Leifert, Seal, Eyre, Steinshamn and Butler2014) and use of clover silages (Dewhurst et al. Reference Dewhurst, Delaby, Moloney, Boland and Lewis2009) as well as the antioxidant content by feeding different types of silage/conserved forages (Hojer et al. Reference Hojer, Adler, Martinsson, Jensen, Steinshamn, Thuen and Gustavsson2012; Larsen et al. Reference Larsen, Kidmose, Kristensen, Beaumont and Mortensen2013) are still essential in the UK to sustain enhanced quality milk throughout the year. Based on the RDA in the present study, maize silage, hay/straw, cereals and concentrate feeds all have a negative impact on milk beneficial FA or carotenoid content or both and their use in winter diets is likely to have an adverse effect to the aim to enhance the nutrition properties of milk.
The authors gratefully acknowledge financial support from the European Community under the 6th framework programme Integrated Project QualityLowInputFood, FP6-FOOD-CT-2003-506358, the Greek State scholarship foundation, the UK Red Meat Industry Forum and the Yorkshire Agricultural Society. The help of all dairy producers who took part in the present study and of William Butler with the collection of farm records, milk and herbage is gratefully acknowledged.
APPENDIX
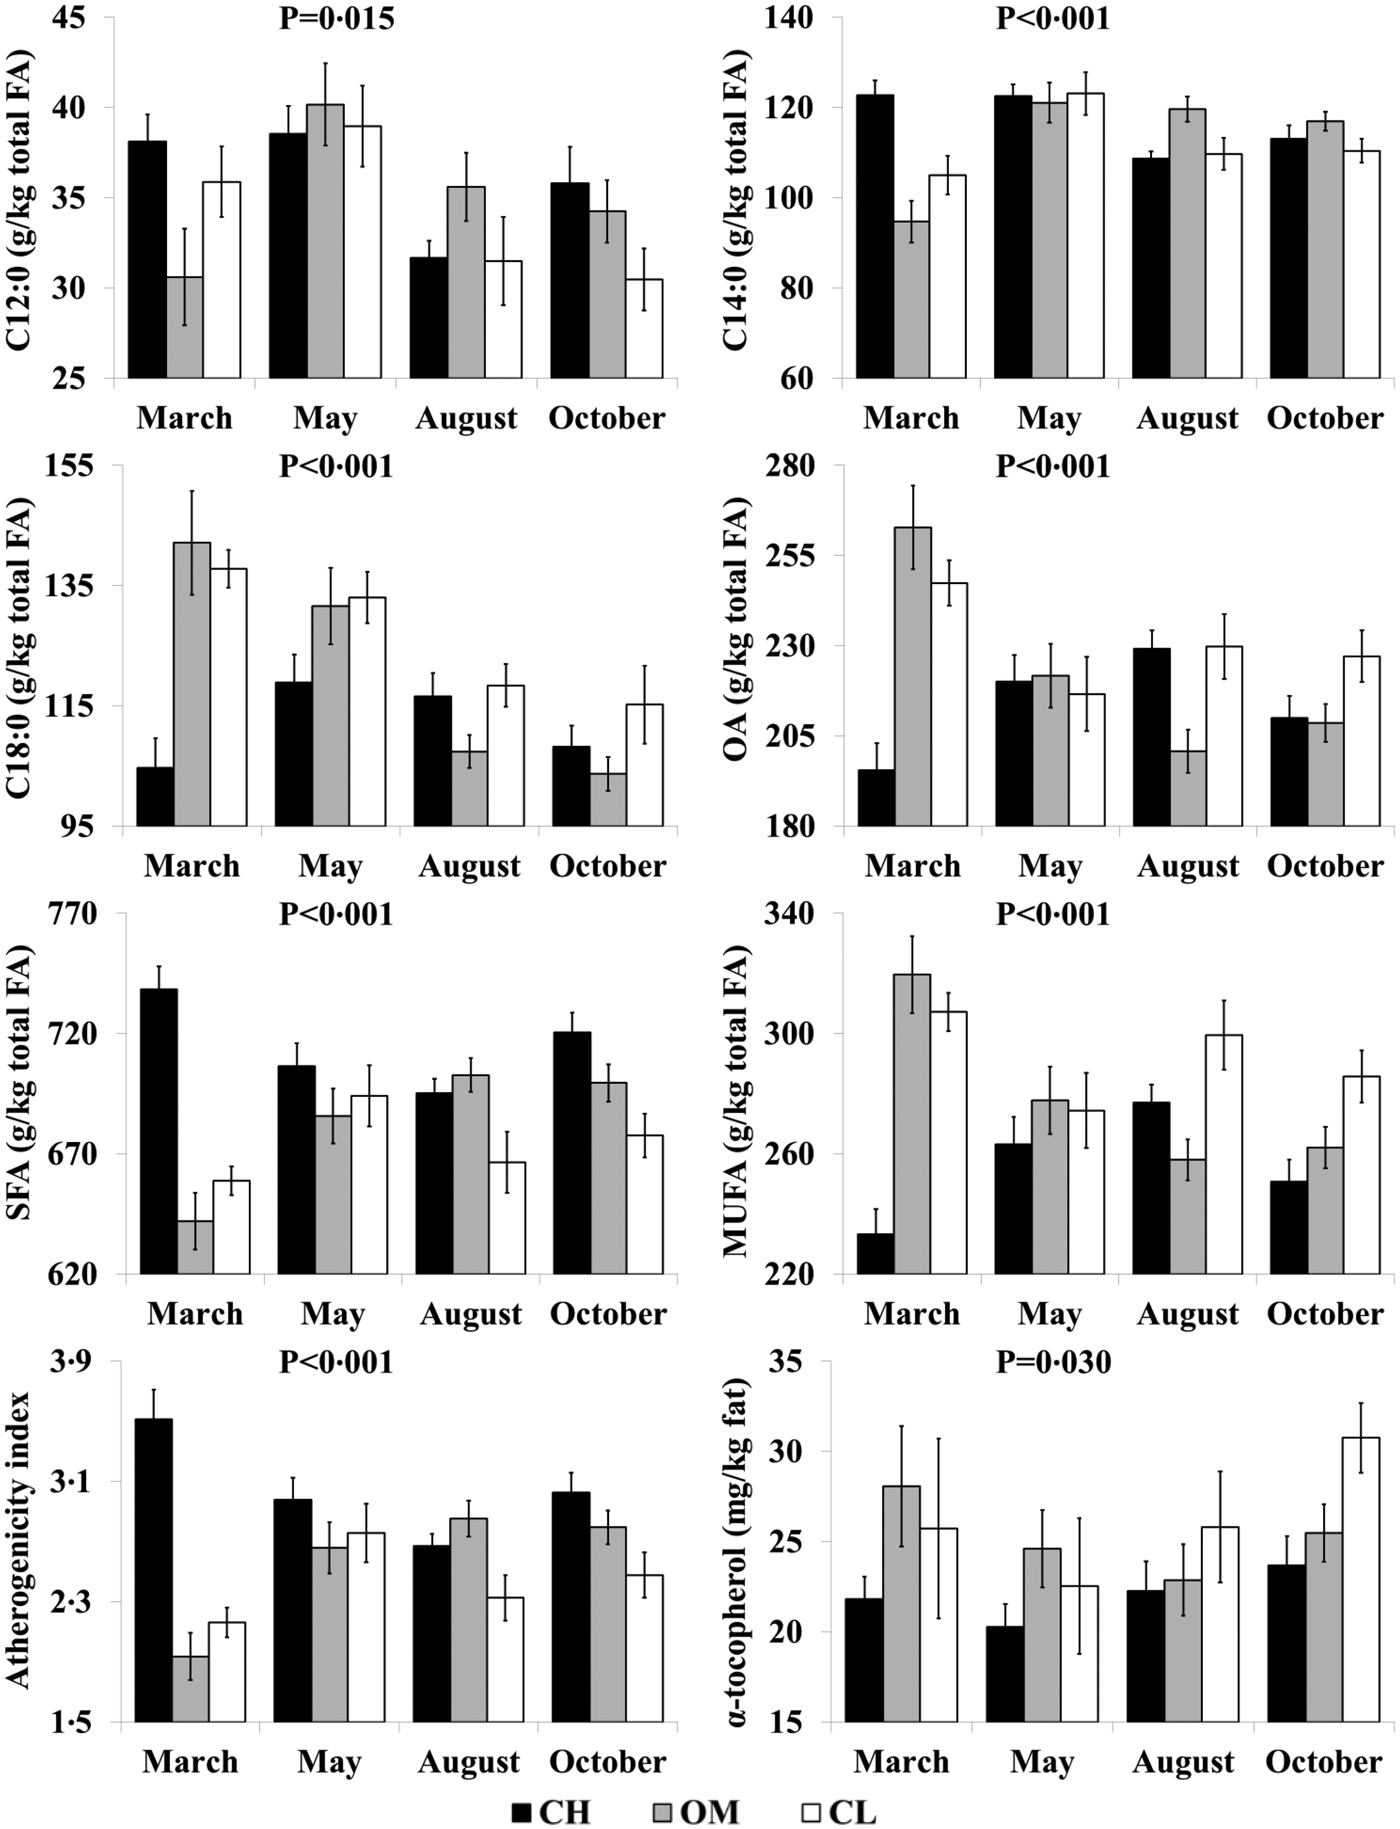
Interaction means±s.e. (error bars) for the effects of production intensity (conventional high-intensity [CH], organic medium-intensity [OM] and conventional low-intensity [CL]) and sampling date (March, May, August and October) on the (a) concentrations (g/kg total fatty acids) of lauric acid (C12 : 0), myristic acid (C14 : 0), stearic acid (C18 : 0), oleic acid (OA), saturated fatty acids (SFA), monounsaturated fatty acids (MUFA) and atherogenicity index (Ulbricht & Southgate Reference Ulbricht and Southgate1991) and (b) contents (mg/kg fat) of α-tocopherol of milk from pasture-based dairy farms in Wales. P represents the ANOVA P-value for the interaction. Symbols key: 
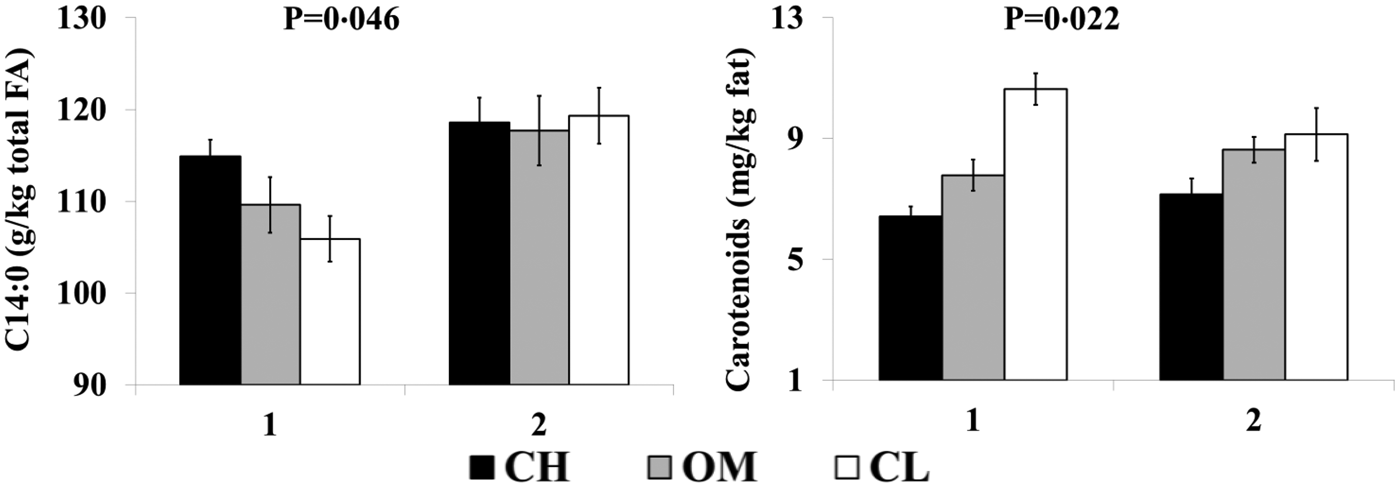
Interaction means±s.e. (error bars)E for the effects of production intensity (conventional high-intensity [CH], organic medium-intensity [OM], conventional low-intensity [CL]) and year (1: 2004/05, 2: 2007) on the (a) concentrations (g/kg total fatty acids) of myristic acid (C14 : 0 and (b) contents (mg/kg fat) of total carotenoids of milk from pasture-based dairy farms in Wales. P represents the ANOVA P-value for the interaction. Symbols key: 
Interaction means±s.e. (error bars) for the effects of production intensity (conventional high-intensity [CH], organic medium-intensity [OM], and conventional low-intensity [CL]) and sampling date (March, May, June, August and October) on the contents (g/kg milk) of α-casein, β-casein, α-lactalbumin, β-lactoglobulin A, β-lactoglobulin B and whey protein of milk from pasture-based dairy farms in Wales over year 2 of the study (2007). P represents the ANOVA P-value for the interaction. Symbols key: 
Management and production parameters (means±s.e.) and veterinary treatments for pasture-based dairy systems in different sampling dates (March, May, August and October) in Wales
Main effect means±s.e. and ANOVA P-values for the effect of sampling date (March, May, August and October) on the fatty acid composition (g/kg total fatty acids) and antioxidants content (mg/kg fat) of milk from pasture-based dairy farms in Wales