Implications
Feed efficiency of the growing pig has long been selected, and improved, through indirect selection for faster growth and leaner carcass. Further reduction of body fatness could, however, affect meat quality and reproductive performance. Today, single-place electronic feeders provide accurate measures of individual feed intakes of pigs reared in collective pens. Information is still rather scarce on quantitative trait loci affecting daily feed intake, feed conversion ratio or residual feed intake of growing pigs. This study reports the results of a QTL detection experiment pertaining to feed intake traits and other production traits.
Introduction
Residual feed intake (RFI) represents the fraction of total feed intake (TFI) that is ‘unexplained’ by maintenance requirements and production costs. Thus, low RFI is interpreted as improved feed efficiency with no difference in production traits while high RFI corresponds to a high feed intake for a given production level (Kennedy et al., Reference Kennedy, van de Werf and Meuwissen1993; Archer et al., Reference Archer, Richardson, Herd and Arthur1999). Residual feed intake, compared with feed conversion ratio (FCR), which is traditionally used to measure feed efficiency, is a linear combination of traits, statistically more robust than the ratio of feed consumed to body weight gain, which defines FCR. Among the numerous QTL mapping designs implemented so far in the pig, only very few have included feed intake measurements (Geldermann et al., Reference Geldermann, Müller, Moser, Reiner, Bartenschlager, Cepica, Stratil, Kuryl, Moran, Davoli and Brunsch2003; Houston et al., Reference Houston, Haley, Archibald and Rance2005; Mohrmann et al., Reference Mohrmann, Roehe, Knap, Plastow and Kalm2006; Duthie et al., Reference Duthie, Simm, Doeschl-Wilson, Kalm, Knap and Roehe2008). Some QTL have been detected for TFI over a given period of time or average daily feed intake (DFI) between fixed body weight (BW). Less than 20 QTL have been identified so far for feed efficiency, mostly through FCR measurements. Additionally, some single genes, that is, halothane (Leach et al., Reference Leach, Ellis, Sutton, McKeith and Wilson1996), MC4R (Kim et al., Reference Kim, Larsen, Short, Plastow and Rothschild2000) and IGF2 (van Laere et al., Reference Van Laere, Nguyen, Braunschweig, Nezer, Collette, Moreau, Archibald, Haley, Buys, Tally, Andersson, Georges and Andersson2003) have been found to affect feed intake and feed efficiency.
This study aimed at detecting QTL for DFI and feed efficiency measured by RFI or FCR in an experimental backcross (BC) between Piétrain (PI) and Large White (LW) breeds. These two breeds show large differences for DFI and, to a lower extent, feed efficiency and feeding behaviour (Labroue et al., Reference Labroue, Guéblez, Meunier-Salaün and Sellier1999). Growth, carcass composition and meat quality traits were also recorded on BC progeny so QTL detection could also be applied to these traits.
Material and methods
Animals
Sixteen sire families were produced using PI × LW sires available in French artificial insemination (AI) centres. Sires were chosen so as to be as lowly related as possible. Sires were mated to LW sows reared in two INRA farms (Rouillé, Vienne and Le Magneraud, Charente-Maritime). The dams belonged to generations 0 (founders), 1, 2 or 3 from two divergent lines selected for either high or low residual feed intake (RFI+ and RFI−, respectively) during the growth period (Gilbert et al., Reference Gilbert, Bidanel, Gruand, Caritez, Billon, Guillouet, Noblet and Sellier2007). Line divergence for RFI was 0.3 phenotypic s.d. of the trait at generation 3. In order to avoid potential interactions between sire haplotype segregation in dam families and the effect of selection on the dams, each boar was mated only with sows from a single RFI line.
The present analysis was carried out on 717 female and castrated male BC progeny issued from 4 to 12 litters per sire. BC animals were distributed into four yearly series of four sire families each. In each series, animals were produced in four successive farrowing batches, with a 3-week interval between contiguous batches. These batches then became postweaning and fattening batches and defined four contemporary groups per series. The study was conducted in accordance with the national regulations for human care and use of animals in research.
All animals were raised in the same postweaning unit in Rouillé experimental farm. At least one female pig and one castrated male pig were then allotted to pens of 8 to 12 animals equipped with ACEMA 64 single-place electronic feeders (Pontivy, Cedex, France) (Labroue et al., Reference Labroue, Guéblez, Sellier and Meunier-Salaün1994) to record individual feed intake. Facilities available in Rouillé comprised four rooms of four pens each. A contemporary group was defined as the group of about 45 pigs contemporarily tested in the same room, with animals penned by sex. Animals were offered a pelleted diet based on cereals and soybean meal and containing 10 MJ of net energy per kilogram and 160 g of crude protein per kilogram, with a minimum of 0.80 g of digestible lysine per MJ of net energy.
Traits recorded
The test period considered for growth and feed intake traits started 3 days after the pigs entered fattening pens at an average BW (BW0) of 30 kg and ended the day before slaughter at an average BW (BW1) of 108 kg. During growth, in addition to feed intake, live backfat thickness (BFT, average value of six ultrasonic measurements taken on each side of the spine, 4 cm from the mid-dorsal line at the levels of the shoulder, the last rib and the hip joint) and BW were recorded at 11, 15, 19 and 23 weeks of age. Feed intake and BW measurements were used to compute average daily gain (ADG), DFI, TFI and FCR over the whole test period. At the end of the test, after a fasting period of approximately 20 h, pigs were weighed to obtain slaughter weight (SW). The transport of pigs from the farm to the abattoir (Celles-sur-Belle (Deux-Sèvres) for the first three series with 33 slaughter dates; Saint-Maixent (Deux-Sèvres) for the last series with 12 slaughter dates) lasted around 1 h. Groups of animals slaughtered the same day always contained progeny (at least 7 and at most 25 pigs) from the two dam lines. Waiting time at the abattoir before slaughter was at least 1 h. Stunning method in both abattoirs was electro-narcose. Shortly after slaughter, the hot carcass (with head and feet) was weighed and dressing percentage was defined as the ratio of hot carcass weight to SW. Carcasses were pre-cooled during 1 h to decrease their temperature from 40°C to 35°C, and then chilled in a cooling room to reach 7°C after 17 h. The day after slaughter, cold carcass weight, carcass length (from the atlas to the anterior edge of the pubian symphysis), carcass BFT (on the mid-dorsal line at the level of shoulder, last rib and hip joint) and head weight were measured. The right half-carcass was then submitted to a standardized cutting procedure and the weights of ham, loin, belly, shoulder, backfat and feet were recorded. Lean meat content (LMC) was estimated as a linear combination of the weights of three carcass cuts (ham, loin and backfat), expressed as a percentage of the half-carcass weight (Tribout and Bidanel, Reference Tribout and Bidanel2000).
RFI was estimated by multiple regression of DFI on ADG, LMC and AMBW. The latter trait is average metabolic BW during the test period (AMBW = (BW11.6 − BW01.6)/[1.6 (BW1 − BW0)]; Noblet et al., Reference Noblet, Karege, Dubois and van Milgen1999). The equation was:

The model used to compute the multiple regression equation also included the fixed effects of contemporary group, sex and pen size. The R 2 of the multiple regression model used to compute the predicted feed intake was 0.78.
Meat quality measurements were performed 24 h post mortem. Ultimate pH (pHu) measurements were taken on adductor femoris (AF), semimembranosus (SM), gluteus superficialis (GS), longissimus dorsi (LD) and semispinalis capitis (SC) muscles using a Knick Portamess 911 pH meter with a glass electrode. Meat colour was assessed on GS and gluteus medius (GM) muscles through the three coordinates L*, a* and b* of the CIELAB colour space using a Minolta CR-300 photocolorimeter (Minolta, Carrieres S/Seine, France). Water-holding capacity (WHC) was assessed using a piece of filter paper put on the freshly cut surface of the GS muscle and measuring the time (in 10 s) required for the paper to become wet (a higher value is associated with better WHC). This trait was recorded in the Celles-sur-Belle abattoir only. A linear combination of three of the above measurements (pHu SM, L*GS and WHC GS) was used as a meat quality index (MQI), defined as a predictor of the ‘technological yield’ (ratio of the weight of saleable cooked ham to the weight of defatted and boneless fresh ham) in cured–cooked ham processing (Tribout and Bidanel, Reference Tribout and Bidanel2000).
Genotyping
Genotypes for 118 microsatellite markers spread on the 18 porcine autosomes were determined on the BC progeny, the dams and 12 of the 16 sires. Blood samples of the four remaining AI sires could not be collected before they were culled, so that DNA samples were not available. The panel of microsatellites was designed to maximise the average heterozygosity of the sires. A total of 1684 cM was covered, with an average density of 18.1 cM (Table 1). Genotyping was performed in both Labogena (Jouy-en-Josas) and the Genomic Platform (Toulouse) facilities. Phases for all chromosomes were built with certainty from the progeny for the 16 sires, including the four sires for which DNA was missing. Average informativity per chromosome (Table 1), computed as the average transmission probability of sire haplotypes at each position along the panel, was 0.84, ranging from 0.79 for chromosome 16 to 0.88 for chromosome 15. Sires were all heterozygous Nn for the HAL gene, whereas dams were homozygous NN. Mutations previously described for HAL (C1843T) (Fujii et al., Reference Fujii, Otsu, Zorzato, de Leon, Khanna, Weiler, O’Brien and MacLennan1991), IGF2 (G3072A) (van Laere et al., Reference Van Laere, Nguyen, Braunschweig, Nezer, Collette, Moreau, Archibald, Haley, Buys, Tally, Andersson, Georges and Andersson2003) and MC4R (N298D) (Kim et al., Reference Kim, Larsen, Short, Plastow and Rothschild2000) were genotyped by PCR restriction fragment length polymorphism for the all the progeny, available sires and dams for HAL, and only sires for IGF2 and MC4R.
Marker distribution on the chromosomes, bounds of the positions covered and average informativity

1Average distance (cM) between adjacent markers.
Statistical analyses
The analyses were carried out by using a two-step procedure. Trait data were corrected for usual fixed effects using the GLM procedure of the SAS software. The fixed effects included in the model were contemporary batch (16 levels), farm of birth (2 levels), pen size (5 levels) and sex (2 levels) for growth and carcass composition traits. For meat quality traits, the combination of slaughter day and abattoir (45 levels) was added in the model and the pen size was removed. Slaughtering for a given contemporary batch was distributed into three to seven slaughter dates, with some overlapping between successive batches. SW was included as a covariate in the model used for carcass traits, except for joint weights, which were analysed using hot carcass weight as a covariate.
QTL detection was performed on the residuals of the above-mentioned mixed models using the QTLMap software developed at INRA (Elsen et al., Reference Elsen, Mangin, Goffinet, Boichard and Le Roy1999). QTLMap allows interval mapping to be performed without any hypothesis on the number of QTL alleles and the allele frequencies within breeds. Sire contrasts between PI and LW haplotypes were tested assuming that the population was structured as a set of independent half-sib families. Test statistics were approximate likelihood ratio tests (LRT), computed for the most probable sire haplotype. QTL effects reported in the following were computed as the mean of absolute values of individual sire QTL substitution effects.
In the first QTL detection analysis, a polygenic effect for the sire, a QTL effect and a residual were included in the model. A second QTL detection analysis was carried out with a model including the additional effects of the halothane genotype and of the interaction between the halothane genotype and the QTL. The halothane genotype effects were thus computed and a test on the dependency of the QTL effects upon the halothane genotype of the progeny was performed.
In the above-mentioned analyses, all dams were considered as belonging to the same LW population. In order to estimate potential effects of dam lines on the QTL effect estimates, a final test was applied to QTL detected in the first analysis: separate QTL effect estimates were obtained for the group of sires mated with RFI+ dams and for the group of sires mated with RFI− dams. The difference of QTL effects estimated within the each group of sire families was tested with a Student’s t-test.
The differences of the QTL effects depending on the halothane genotype or on the dam line were estimated only for QTL detected in the first QTL analysis. For both tests, a Bonferroni correction was applied to the P-value to account for the number of independent results tested, considering that tests were applied on 86 QTL grouped on 17 chromosomes for three major groups of traits: only tests with nominal P < 0.001 were retained, which corresponds to a proportion of 0.05 false positive at the experiment level.
Results
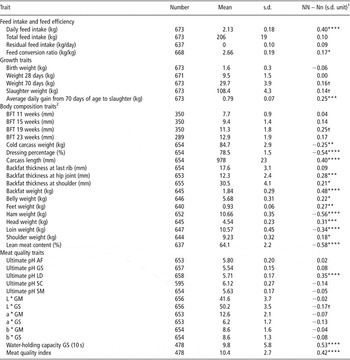
Means, s.d. and numbers of progeny recorded for each trait are reported in Table 2.
Means, s.d. and number of recorded progeny (number) and halothane genotype effect for each trait

GS = gluteus superficialis; GM = gluteus medius; AF = adductor femoris; LD = longissimus dorsi; SC = semispinalis capitis; SM = semimembranosus.
1Difference between the NN performance trait and the Nn performance trait expressed in proportion of phenotypic s.d.
2BFT = average live backfat thickness.
†P < 0.10; *P < 0.05; **P < 0.01; ***P < 0.001; ****P < 0.0001.
Halothane locus effects
Sires were all heterozygous Nn for the HAL gene, whereas all dams were homozygous NN. The mean differences between NN and Nn progeny are presented for all traits in Table 2. NN progeny compared with Nn progeny had significantly higher trait values for DFI, ADG, carcass length, backfat weight, ultimate pH of LD muscle, water-holding capacity and MQI, whereas their ham weight, loin weight, dressing percentage and LMC were significantly lower. When expressed in phenotypic s.d. units, the highest difference between NN and Nn progeny (0.58 s.d.) was found for LMC.
A significant increase in FCR was observed in NN compared with Nn progeny (P < 0.05). The difference between NN and Nn pigs for residual feed intake was not significant, whereas all its components (DFI, ADG and LMC) were strongly affected by the HAL locus.
QTL for DFI and feed efficiency
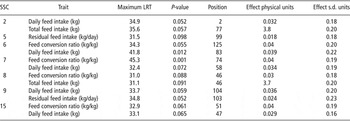
Only two QTL were detected for DFI and feed efficiency in P < 0.05 at the chromosome-wide (CW) level (Table 3), but marginally significant QTL (P < 0.10 at the CW level) were also found. Among the 13 resulting QTL, 8 were significant at least at the (P < 0.06) CW level for four chromosomes: SSC2 for daily and TFI (at 2 and 77 cM, respectively), on SSC6 for FCR at 125 cM and DFI at 83 cM (significant at P < 0.05 at the CW level), on SSC7 for FCR (significant at P = 0.001 at the CW level) in a region about 74 cM and on SSC9 for DFI and residual feed intake at about 104 cM. Average substitution effects for these QTL were rather similar, representing about 20% of the phenotypic s.d. of the traits.
QTL detected for feed intake and feed efficiency, maximum LRT value, corresponding P-values (at CW level) and position (cM) and mean of QTL substitution effects estimated within sire families

LRT = likelihood ratio test; CW = chromosome wide.
QTL for growth traits
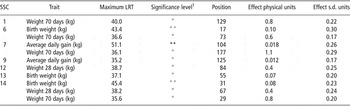
QTL detected for growth traits are shown in Table 4. The main QTL affected average daily BW gain on SSC7 (P < 0.01 at the genome-wide level) at 104 cM. Two chromosomal regions were detected at the (P < 0.01) CW level for birth weight, on SSC6 at 17 cM and on SSC14 at 31 cM. Both chromosomes showed QTL at the (P < 0.05) CW level for early weight, at 28 days of age or 70 days of age. Additional QTL regions were found at the (P < 0.05) CW level for growth traits on SSC1, 9, 12 and 13.
QTL detected for growth traits, maximum LRT value, corresponding significance level and position (cM), and mean of QTL substitution effects estimated within sire families

LRT = likelihood ratio test.
1Chromosome-wide significance levels: +P < 0.05; ++P < 0.01 and genome-wide significance levels: *P < 0.05; **P < 0.01.
QTL for body and carcass composition traits
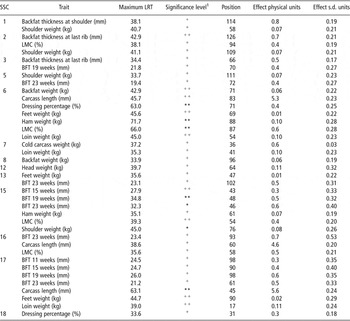
QTL detected for body and carcass composition traits are listed in Table 5. Four chromosomal regions were significant at the (P < 0.01) CW level. On SSC2, a QTL for BFT measured at the last rib was detected at position 126 cM (P < 0.01 at the CW level). On SSC6 (at about 70 cM), the significance was 0.01 at the genome-wide level for the QTL affecting dressing percentage, ham weight and LMC. On SSC15, QTL with most likely positions ranging from 43 to 76 cM for live backfat from 15 weeks of age to the end of control period and shoulder weight were detected (P < 0.05 at the genome-wide level). In this region, a QTL for LMC with a lower significance level (P < 0.05 at the CW level) was detected. On SSC17, QTL for feet weight (at 90 cM), loin weight (at 17 cM) and carcass length (at 45 cM) were mapped at the P < 0.01 CW level, the position 90 cM showed associations with live BFT measurements at all stages, at lower significance levels (P < 0.05 at the CW level). QTL effects on SSC15 and SSC17 ranged from 0.19 to 0.40 s.d. units of the traits. Additional QTL regions were detected (P < 0.05) at the CW level for body and carcass composition traits on SSC1, 2, 3, 5, 7, 8, 12, 13, 16 and 18.
QTL detected for body composition traits, maximum LRT value, corresponding significance level and position (cM), and mean of QTL substitution effects estimated within sire families

LRT = likelihood ratio test; BFT = average live backfat thickness; LMC = lean meat content.
1Chromosome-wide levels: +P < 0.05; ++P < 0.01 and genome-wide levels: *P < 0.05; **P < 0.01.
QTL for meat quality traits
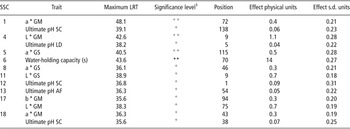
QTL affecting meat quality traits are listed in Table 6. On SSC6, the significance of P < 0.01 at the genome-wide level was reached at about 70 cM for QTL affecting water-holding capacity. QTL substitution effect was 0.27 s.d. units of the traits. Three chromosomal regions were significant at the (P < 0.01) CW level, namely on SSC1 for a* measured on GM muscle, SSC5 for a* measured on GS muscle, and SSC4 for L* measured on the GM muscle. Additional QTL were detected at the (P < 0.05) CW level on chromosomes 1, 4, 7, 8, 11, 12, 13, 17 and 18 for L*, a* or b* measures of both GM and GS muscles or for ultimate pH of LD, SC and AF muscles.
QTL detected for meat quality traits, maximum LRT value, corresponding significance level and position (cM), and mean of QTL substitution effects estimated within sire families

LRT = likelihood ratio test; AF = adductor femoris; GM = gluteus medius; GS = gluteus superficialis; LD = longissimus dorsi; SC = semispinalis capitis.
1Chromosome-wide levels: +P < 0.05; ++P < 0.01 and genome-wide levels: *P < 0.05; **P < 0.01.
QTL detection with the halothane genotype as a fixed effect
QTL detection including the fixed effect of the halothane genotype in the model of analysis was carried out. On SSC6, all the tests being significant in the previous analyses at about 70 cM were no longer significant with the model accounting for the halothane genotype, indicating that the QTL detected in the region might be due to the HAL gene. Nevertheless, two QTL previously detected, for birth weight at 17 cM and FCR at 125 cM, remained significant in the new analysis, indicating that QTL other than HAL are segregating on SSC6.
Applying a QTL detection model including the halothane genotype and the interaction between the halothane genotype and the QTL showed significant results for one QTL region previously detected. The interaction for the SSC7 QTL affecting loin weight was highly significant (P < 0.0001). Comparing the sire QTL substitution effect estimates depending on their progeny genotypes, an average difference of 0.20 kg of loin was found between Nn and NN pigs. The estimated QTL substitution effects were thus on average larger in an Nn than in an NN genetic background.
QTL effect estimates depending on the dam line
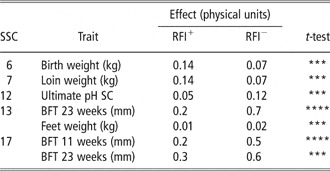
QTL effect estimates were significantly different depending on the LW dam line for five of the QTL previously detected (Table 7). On SSC6 and SSC7, significant differences of similar magnitude were found for birth weight and loin weight (estimated QTL effects of +70 g in the RFI+ dam line compared with the RFI− dam lines). On SSC12, effects for ultimate pH measured on the SC muscle were significantly higher when estimated in the RFI− line. The largest differences (P < 0.0001) were found for estimated QTL effects relating to live BFT on SSC13 and SSC17, with higher QTL effects found in the RFI– line compared with the RFI+ line.
Significant differences (P < 0.001) between mean values of QTL substitution effects estimated within sire families for sires mated with dams from the line selected for high residual feed intake (RFI+) and for sires mated with dams from the line selected for low residual feed intake (RFI−)

BFT = average live backfat thickness; SC = semispinalis capitis.
***P < 0.001; ****P < 0.0001.
Discussion
Design and QTL model
The population used here for the detection of QTL affecting feed intake and feed efficiency was a cross between LW × PI boars from AI centres and LW female pigs from two lines divergently selected for residual feed intake. The progeny were recorded for individual feed intake to allow the computation of individual consumption and feed efficiency, as usually performed in breeding company to predict lean growth and FCR. The effect of feeding pigs with single-place electronic feeders instead of multiple place feeders used in commercial pig farms is not accurately established. One may assume that feeding behaviour is changed due to a reduced competition for food access. The actual extent of this change is unknown, while being probably limited as shown by the agreement between breed differences found in the two environments (e.g. Labroue et al., Reference Labroue, Guéblez, Sellier and Meunier-Salaün1994, Reference Labroue, Guéblez, Meunier-Salaün and Sellier1999).
The halothane mutation was segregating in all the sire families. It had a significant and moderate effect on DFI, ADG and LMC, that is, the components of feed efficiency, but its direct effect was of marginal magnitude on FCR and RFI, in agreement with previous studies: differences between NN and Nn individuals in DFI or FCR were found to be significant or marginally significant in some studies (Leach et al., Reference Leach, Ellis, Sutton, McKeith and Wilson1996; Thaller et al., Reference Thaller, Dempfle, Schlecht, Wiedemann, Eichinger and Fries2000) but not significant in other studies (Larzul et al., Reference Larzul, Le Roy, Guéblez, Talmant, Gogué, Sellier and Monin1997; Tor et al., Reference Tor, Estany, Villalba, Cubilo, Tibau, Soler, Sanchez and Noguera2001). Thus, the halothane mutation appears to account for a marginal part of the genetic variability between the breeds for feed efficiency traits. Similarly, the halothane locus was shown to significantly affect growth, body and carcass composition, as well as meat quality. Estimated effects were in the usual range of literature estimates (Larzul et al., Reference Larzul, Le Roy, Guéblez, Talmant, Gogué, Sellier and Monin1997).
Labroue et al. (Reference Labroue, Guéblez, Meunier-Salaün and Sellier1999) found a lower DFI, by 19%, in the PI breed compared with the LW breed, which would correspond to 2 to 3 s.d. of the trait, and reported a small difference in feed efficiency between the two breeds. On the other hand, selection experiments (Gilbert et al., Reference Gilbert, Bidanel, Gruand, Caritez, Billon, Guillouet, Noblet and Sellier2007; Cai et al., Reference Cai, Casey and Dekkers2008) showed that these traits can be efficiently selected, which suggests QTL allele segregation within breeds. To account for this phenomenon, we applied a QTL model that made no assumption on the number of QTL alleles segregating in the parental breeds of the cross. The alternative, that is, a line cross model where QTL alleles are assumed to be different and fixed in the parental breeds (Haley and Knott, Reference Haley and Knott1992), has been shown to be more powerful to detect QTL when the hypothesis of QTL fixation is correct, or at least when the effects of the alleles in one breed are consistently higher than the effects of the alleles in the other breed. Practically, Student’s t-tests on sire QTL effects were performed to identify heterozygous sires (not shown). For most of the detected QTL, some sires were found to be homozygous, confirming that most of the QTL alleles are not reciprocally fixed in the LW and the PI breeds. Finally, line cross tests require that the breed origin of the sire phases can be inferred, which was not the case in our study; the boars were in service in commercial AI centres and their parents could not be genotyped. As a consequence, it was not possible to orientate the effect of the PI alleles compared with LW alleles in the design and, for example, QTL presenting cryptic effect could not be detected with this design.
We performed a simulation study to evaluate the expected detection power of our design (data not shown). With a 5% type I error, for a QTL effect of 0.5 s.d. of the trait, the power was 72% if two QTL alleles were alternatively fixed in the breeds, and 30% if they were segregating with equal proportions in the two breeds. For an effect of 1 s.d., the power reached 100% in the former case and 90% in the latter one. Additionally, in a BC design, the QTL effects are estimated as contrasts between the LW/LW and the PI/LW genotypes in the sire progeny. Consequently, higher power was provided to detect QTL with either additive effects, or (partial) dominance of the PI alleles over the LW alleles. However, in this context, only few QTL were detected for feed intake and feed efficiency. This might be a consequence of low individual effects of the QTL alleles segregating in PI v. LW, combined with a high allelic polymorphism in the breeds. In addition, if some QTL had dominant LW alleles over PI alleles, they would not be detected. Moreover, even if the average informativity of our markers was high, some chromosomal regions were not covered, like the sex chromosomes or the beginning of chromosomes 5 and 8. Some QTL may have been missed, as other studies have reported QTL effects in these chromosomal regions (e.g. QTL for ham weight and carcass leanness were reported on SSC8 by Duthie et al., Reference Duthie, Simm, Doeschl-Wilson, Kalm, Knap and Roehe2008).
Feed intake traits
SSC2
A QTL for DFI and FCR has recently been mapped on SSC2 (Duthie et al., Reference Duthie, Simm, Doeschl-Wilson, Kalm, Knap and Roehe2008), in a cross between PI sires and commercial crossbred dams issued from LW, Landrace and Leicoma breeds. This QTL was similar to that we detected for DFI (P < 0.06 at the CW level). The most likely position (2 cM) in our study corresponds to the IGF2 region, but the IGF2 mutation found in the Meishan breed by van Laere et al. (Reference Van Laere, Nguyen, Braunschweig, Nezer, Collette, Moreau, Archibald, Haley, Buys, Tally, Andersson, Georges and Andersson2003) was not segregating in our PI × LW boars. Houston et al. (Reference Houston, Haley, Archibald and Rance2005) have detected QTL for DFI in this region and also rejected the published IGF2 mutation as a causal factor. The QTL effect observed in our study could similarly come from a different mutation or a different locus in the IGF2 region.
A QTL for TFI was found to be marginally significant (P < 0.06) in a different SSC2 region (at 77 cM), fairly close to QTL affecting carcass BFT and LMC located in the region about 100 cM. QTL for DFI (Duthie et al., Reference Duthie, Simm, Doeschl-Wilson, Kalm, Knap and Roehe2008) and for tissue composition of the ham (Heuven et al., Reference Heuven, van Wijk, Dibbits, van Kampen, Knol and Bovenhuis2009) in a commercial cross including the PI breed were detected in this same region. Correlations between the effects of the SSC2 QTL on different traits indicated that haplotypes increasing TFI might be physically linked to haplotypes increasing BFT, in the direction of known genetic correlations (Johnson et al., Reference Johnson, Chewning and Nugent1999). On the contrary, their correlations with the QTL effects on LMC showed no clear pattern, suggesting that two different loci could segregate in the region. This would offer the opportunity to decrease feed intake, and backfat, while improving LMC by selection of favourable haplotypes in the region.
SSC7
To our knowledge, no QTL affecting FCR had previously been mapped to the swine leucocyte antigen complex (SLA) region on SSC7. We detected in this region a low significant QTL for DFI, cold carcass weight and loin weight. Thus, our results do not point out major QTL affecting body composition in the SLA region as those detected in crosses involving the Meishan breed (Bidanel and Rothschild, Reference Bidanel and Rothschild2002). On the other hand, a highly significant QTL for ADG was mapped to SSC7 (position ∼100 cM), close to the region where Houston et al. (Reference Houston, Haley, Archibald and Rance2005) mapped QTL for average feeding rate, and close to previously reported QTL affecting growth rate (Bidanel and Rothschild, Reference Bidanel and Rothschild2002). Some QTL were identified in crosses involving the PI breed in chromosomal regions close to the maximum LRT position in our analysis (Nezer et al., Reference Nezer, Moreau, Wagenaar and Georges2002; Edwards et al., Reference Edwards, Ernst, Tempelman, Rosa, Raney, Hoge and Bates2008).
A highly significant influence of the halothane genotype on the QTL effects estimated for loin weight on SSC7 was detected. If some interactions between the halothane mutation and the RN major gene have been previously reported (Le Roy et al., Reference Le Roy, Moreno, Elsen, Caritez, Billon, Lagant, Talmant, Vernin, Amigues, Sellier and Monin2000), this is to the best of our knowledge the first time that an interaction between a QTL and the halothane mutation is demonstrated. An epistatic interaction can be suspected between the loci, where the effect of the SSC7 QTL would be enhanced or diminished when the n allele is present at the halothane locus. The n mutation is responsible for sudden increases in calcium levels in the cytoplasm during challenges: the uncontrolled sarcoplasmic Ca2+ release via the ryanodine receptor activates actomyosin filaments, leading to muscle contractions and triggers glycogenolysis resulting in anoxia, muscle acidosis and heat production (Laville et al., Reference Laville, Sayd, Terlouw, Blinet, Pinguet, Fillaut, Glénisson and Chérel2009), which could here activate/inactivate some metabolic pathways related to the SSC7 QTL.
SSC5 and SSC8
We detected a number of suggestive QTL on SSC5 and SSC8, where QTL have previously been detected for feed intake traits, but at rather different locations. For example, Lee et al. (Reference Lee, Chen, Moran, Stratil, Reiner, Bartenschlager, Moser and Geldermann2003) detected a SSC5 QTL for FCR in F2 Meishan × PI pigs at position 200 cM, whereas the QTL that we detected for residual feed intake (P < 0.10) was located at 99 cM. Similarly, a QTL affecting FCR was mapped at 99 cM to SSC8 by Beeckmann et al. (Reference Beeckmann, Moser, Bartenschlager, Reiner and Geldermann2003) in the same population as Lee et al. (Reference Lee, Chen, Moran, Stratil, Reiner, Bartenschlager, Moser and Geldermann2003). The putative (P < 0.10) QTL detected on SSC8 for both FCR and TFI in our study had most likely position about 45 cM, with CI that would not overlap that of the QTL detected by Beeckmann et al. (Reference Beeckmann, Moser, Bartenschlager, Reiner and Geldermann2003).
SSC6 and SSC9
Few QTL were previously reported for feed intake traits on SSC6 and SSC9. In crosses between the PI breed and a European white breed, a QTL affecting DFI was mapped by Mohrmann et al. (Reference Mohrmann, Roehe, Knap, Plastow and Kalm2006) to the region of SSC6 (position ∼130 cM) in which we found a putative QTL for FCR. We found a marginally significant QTL (P < 0.06) for DFI at 104 cM on SSC9, whereas Cepica et al. (Reference Cepica, Schröffel, Stratil, Hojny, Pierzchala, Kuryl, Brunsch, Sternstein, Davoli, Fontanesi, Reiner, Bartenschlager, Moser and Geldermann2003) mapped a QTL for food consumption at 193 cM. The latter location is the end of the linkage group delimited by marker SW1349 in our study and their study. The same chromosomal region affected ADG in our study and in the study of Duthie et al. (Reference Duthie, Simm, Doeschl-Wilson, Kalm, Knap and Roehe2008). However, these latter authors did not show any effect on feed intake. In our study, QTL effects on ADG were positively correlated with QTL effects on DFI, which agrees with the genetic correlation between these traits (Johnson et al., Reference Johnson, Chewning and Nugent1999). This would imply that the alleles increasing ADG would be linked to alleles increasing DFI.
SSC15
On chromosome 15 (position ∼50 cM), we found a putative QTL affecting both FCR and DFI, co-located with highly significant QTL for BFT at 15, 19 and 23 weeks of age and carcass lean content. One QTL had previously been published on the proximal part of this chromosome as affecting a feed intake pattern (average feed per visit) in a Meishan × LW cross (Houston et al., Reference Houston, Haley, Archibald and Rance2005). Other QTL had been located in the same region for BFT, by Kuryl et al. (Reference Kuryl, Pierzchala, Hojny, Reiner, Bartenschlager, Moser and Geldermann2003) in a Meishan or PI × Wild Boar cross, and by Kim et al. (Reference Kim, Hong, Yun, Lee, Kim, Kim, Chung, Jung, Kwon, Hwang, Park, Cho, Lee, Kim, Kim, Kang, Yeo and Chang2006) in a Yorkshire × Duroc cross. As fat deposition requires more energy and nutrients than protein deposition, QTL alleles leading to a reduced feed intake could be directly related to QTL alleles associated with a reduced fat deposition. Unfavourable genetic correlations between meat quality traits and feed efficiency measured by RFI or FCR have been reported in the literature (Tribout and Bidanel Reference Tribout and Bidanel2000; Gilbert et al., Reference Gilbert, Bidanel, Gruand, Caritez, Billon, Guillouet, Noblet and Sellier2007) within the LW breed. In this study, excluding the halothane gene for which the N allele is fixed in the LW population, no chromosomal region showed joint effects on both categories of traits. This suggests that genetic associations between meat quality traits and feed efficiency might have different origins depending on the breed, resulting in different genetic correlations in this particular cross. An alternative explanation would be a lack of power in our design to detect all QTL effects. The QTL are located in the region of the RN gene (Milan et al., Reference Milan, Jeon, Looft, Amarger, Robic, Thelander, Rogel-Gaillard, Paul, Iannuccelli, Rask, Ronne, Lundström, Reinsch, Gellin, Kalm, Le Roy, Chardon and Andersson2000), but further analyses remain necessary to evaluate the effect of this gene for this particular QTL.
SSC1
No QTL affecting feed intake and feed efficiency was detected on SSC1 in our study. Kim et al. (Reference Kim, Larsen, Short, Plastow and Rothschild2000) reported a G/A substitution in position 1426 in the MC4R gene, which increased BFT, ADG and DFI. Among these traits, we mapped a QTL for BFT and weight at 70 kg BW at the end of the long arm of SSC1, at about 50 cM from the putative position of the MC4R gene on the linkage map. In addition, the genotypes of the 16 PI × LW sires were determined for the MC4R polymorphism. Five sires were found heterozygous, 8 homozygous AA, 3 homozygous GG, but concentrating the QTL detection analyses on heterozygous sire families did not reveal additional QTL for those traits.
Other traits
QTL regions were detected with no effect on feed intake traits. A highly significant region was mapped to chromosome 17, affecting traits related to skeletal development in pigs. The QTL mapped to positions 45, 90 and 17 cM, respectively. Further examination showed that the QTL affecting carcass length at position 45 cM would be a ghost QTL: when two segregating QTL are linked on a chromosome, a QTL detection can point out a unique QTL with large effects between the two positions. In our case, complementary tests suggested the existence of two pleiotropic QTL, one about 20 cM affecting carcass length and feet weight, and the second about 90 cM affecting carcass length and loin weight. Some QTL were formerly reported for traits related to skeletal development on SSC17, for carcass length at about 30 cM in a Landrace × Hampshire cross (Karlskov-Mortensen et al., Reference Karlskov-Mortensen, Bruun, Braunschweig, Sawera, Markljung, EnfäIt, Hedebro-Velander, Josell, Lindahl, Lundström, von Seth, Jørgensen, Andersson and Fredholm2006) and at 70 cM in a PI × Meishan cross (Pierzchala et al., Reference Pierzchala, Cieslak, Reiner, Bartenschlager, Moser and Geldermann2003), and for femur dimension at 87 cM (Andersson-Eklund et al., Reference Andersson-Eklund, Uhlhorn, Lundeheim, Dalin and Andersson2000). Suggestive QTL for L* and b* measured in the gluteus medium were also mapped in this region in our population, as did Fan et al. (Reference Fan, Glenn, Geiger, Mileham and Rothschild2008) in a Berkshire × Yorkshire population for L* in the same chromosomal region.
QTL effect estimates depending on the dam line
Significant differences of the QTL effects estimated in the RFI+ line genetic background compared with the RFI– line genetic background were identified. They affected body composition and early growth. Body composition was affected by early selection in the divergent lines (Gilbert et al., Reference Gilbert, Bidanel, Gruand, Caritez, Billon, Guillouet, Noblet and Sellier2007), which might indicate that different chromosomal regions were selected for these traits on SSC13 and SSC17 in the dam lines. Experiments in plants revealed variation of QTL effect estimations depending on line crosses (Lecomte et al., Reference Lecomte, Duffé, Buret, Servin, Hospital and Causse2004), QTL × genetic background interactions (Lecomte et al., Reference Lecomte, Duffé, Buret, Servin, Hospital and Causse2004) and QTL × environment interactions (Moreau et al., Reference Moreau, Charcosset and Gallais2004). Demonstration in livestock populations is harder to obtain, but the greatest genetic heterogeneity in animal breeds compared with plant lines suggests even greater possibilities of interactions. This questions the across-breed generality of QTL effects found in experimental populations and their utilisation for selection in commercial populations, and suggests the necessity of a systematic validation of QTL effects in the populations and environments of production to achieve an optimal marker assisted selection of QTL.
Conclusion
In this study, few significant QTL for feed intake and feed efficiency were identified and they were generally associated with other major production traits, such as higher growth rate or leaner carcass. QTL alleles seemed to be segregating almost systematically within the breeds, and have relatively small effects on feeding traits. The LW dam line and the halothane genotype showed significant effects on QTL effect estimates. Both these results confirm once again the necessity to validate QTL effects in target populations before applying marker-assisted selection. As a consequence, the biology of those economically important traits appears to be driven by multiple and various loci, with potentially multiple regulatory pathways that guaranty relative stability in the expression of feeding traits. If this situation makes it more difficult to map QTL or use marker assisted selection, it might ensure high genetic potential for improvement of feeding traits through multiple biological routes, thus maintaining genetic diversity in the pig breeds for these traits.
Acknowledgements
The authors thank the reviewers for their constructive comments. This research was supported by grants from the Integrated Project SABRE from the European Sixth Research and Technological Development Framework Programme.