I. INTRODUCTION
In recent years, semiconductor-based photocatalysis has attracted extensive interest for basic and applied chemical utilization of solar energy.Reference Alivov and Fan1–Reference Asahi, Morikawa, Ohwaki, Aoki and Taga7 One of the most commonly used materials is anatase.Reference Adachi, Yoshida, Kurata, Adachi, Tsuchiya, Mori and Uchida8–Reference Cao, Li, Wang, Song and Sun10 But suffering from its large band gap of 3.2 eV, pure anatase has to work in ultraviolet (UV) range and only use about 3% of solar radiation.Reference Mitoraj and Kisch6 Therefore, it is important to develop novel anatase-based materials with appropriate band gap fit for the visible spectral region to realize visible light photocatalysis. Since Asahi et al.Reference Asahi, Morikawa, Ohwaki, Aoki and Taga7 reported N-doped anatase with high reactivity under visible light in 2001, the origin of its visible light photocatalysis was explored by numerous theoretical and experimental researches.Reference Mitoraj and Kisch6, Reference Chen and Burda11–Reference Liu, Yang, Wang, Cheng, Pan, Lu and Cheng14 Variable nitrogen species such as O–Ti–N, Ti–NH2, N–C, and NOx groups were assumed according to the results from x-ray photoelectron spectroscopy (XPS), nuclear magnetic resonance, and electron paramagnetic resonance measurements,Reference Mitoraj and Kisch6, Reference Zhang, Jin, Feng, Yu, Zhang and Zhang15–Reference Lindgren, Mwabora, Avendano, Jonsson, Hoel, Granqvist and Lindquist19 while the influences of nano-/microarchitecture were also discussed.Reference Jang, Kim, Kim, Ji, Kim and Lee20–Reference Shao, Ma, Zhang, Ren and Yuan22 The theoretical calculations suggested that the narrowed band gap was caused by mixing N 2p states with O 2p bands.Reference Mitoraj and Kisch6, Reference Diamandescu, Vasiliu, Tarabasanu-Mihaila, Feder, Vlaicu, Teodorescu, Macovei, Enculescu, Parvulescu and Vasile23 Furthermore, Li et al.Reference Zhao, Huang, Tian, Zhou, Li and Du24 reported that the visible light photocatalytic activity might be ascribed to the raised valence band maximum shift and the wide band gap states composed of N 2p, O 2p, and Ti 3d by first-principles calculations. At the same time, different samples were prepared by varying methods and nitrogen source.Reference Shao, Ma, Zhang, Ren and Yuan22, Reference Zhao, Fan, Wang and Li25, Reference Wang, Zhang, Chen, Liu, He and Cao26 It was found that urea is a convenient and easy to handle nitrogen source for many synthetic methods such as directly calcining hydroxide or titania and urea in air or ammonia gas,Reference Mitoraj and Kisch6, Reference Beranek and Kisch27 hydrothermal method,Reference Zhang, Lin, Zhang, He and Wang28 sol–gel approach,Reference Bacsa, Kiwi, Ohno, Albers and Nadtochenko29 solvothermal treatment,Reference Yin, Aita, Komatsu and Sato30 aqueous preprocessing,Reference Dong, Zhao, Wu and Guo31 and mechanochemical methods.Reference Yin, Zhang, Saito and Sato32, Reference Yin, Ihara, Komatsu, Zhang, Saito, Kyotani and Sato33 However, till now, the nature of the nitrogen species responsible for the visible light activity of urea-derived titania is still under debate.Reference Mitoraj and Kisch6 Even it is not known whether the nitrogen species is a true dopant or just part of a modified titania surface layer in N-doped titania,Reference Mitoraj and Kisch6, Reference Beranek, Neumann, Sakthivel, Janczarek, Dittrich, Tributsch and Kisch34 and there is also few reports on synthesis of N-doped titania in vacuum. Therefore, to understand the mechanism of the photovoltaic property of N-doped anatase, further advantaged surface characterizations of samples from novel preparation are necessary.
Because one of the important factors of photocatalytic efficiency is the separation of photogenerated carriers (electrons and holes), detailed study of excitation, separation, migration, and recombination of photoproduced charges in N-doped TiO2 is significant and essential. Surface photovoltage spectroscopy is an established nondestructive technique for semiconductor surface characterization, which provides the information of charge separation, recombination, transfer, and surface states.Reference Jing, Li, Song, Xue and Fu35 A series of papers reported the surface photovoltage (SPV) measurements on the doped or undoped titania such as TiO2 nanoparticles,Reference Shang, Xu, Du and Li36–Reference Jiang, Wang, Wang, Li and Lu39 TiO2 and N-doped TiO2 films,Reference Feng, Song, Wang, Zhai and Jiang40 N-doped TiO2 powders,Reference Guo, Wu, Chen, Boschloo, Hagfeldt and Ma38, Reference Jiang, Wang, Wang, Li and Lu39, Reference Wang, Yu and Sun41–Reference Han, Xin, Liu, Ma and Tang43 TiO2 nanotube arrays,Reference Zhang, Wang, Pang, Lin, Jiang and Xie44 N-doped TiO2/C3N4 composite,Reference Yang, Li, Wang, Yang and Zhang45 and mesoporous anatase TiO2.Reference Liu, Zhu, Jiang, Sun, Li and Wang46 However, in the present papers, SPV technology was mainly used to support the photocatalytic activity but little attention to the collaboration with other measurements such as XPS to improve the understanding about nitrogen species, surface states, band-to-band transition, and so on. For example, through the SPV results, Kisch et al. assumed a novel valence band generated by a strong electronic coupling of N 2p states with O 2p levels to explain the redshifted band edge but not giving further proof such as XPS result. Another example is Lin et al.,Reference Zhang, Lin, Zhang, He and Wang28 which found that excessive nitrogen reduced the photocatalytic activity and simply attributed this to nitrogen and oxygen vacancy without detailed explanation, even did not consider the XPS spectra of N 1s only showing one peak. Till now, the products reported in the papers about N-doped TiO2 powder were obtained by several methods including wet method using aqueous ammonia solution,Reference Wang, Yu and Sun41 sintering under dry N2 or NH3 gas flow,Reference Guo, Wu, Chen, Boschloo, Hagfeldt and Ma38, Reference Wang, Yang, Jiang and Fan42 hydrothermal method using urea,Reference Zhang, Lin, Zhang, He and Wang28 calcining using urea solution,Reference Beranek, Neumann, Sakthivel, Janczarek, Dittrich, Tributsch and Kisch34 and the sol–gel method.Reference Jiang, Wang, Wang, Li and Lu39 But we do not find any work in which the SPV measurement was used for N-doped titania prepared by calcining in vacuum.
In this paper, we present a facile route to prepare visible light-responsive N-doped anatase nanocrystals by solid-state synthesis in vacuum, which used commercial titania (ST-01) together with urea as the nitrogen source. The products in different molar ratios of urea to titania were smaller than 20 nm with the absorption region extending to visible light. Characterizations such as transmission electron microscopy (TEM), XPS, Fourier transform infrared spectroscopy (FTIR), and SPV were discussed to give a detailed description of the nitrogen species and the change of energy levels attributed to doped amount.
II. EXPERIMENTAL
TiO2 ST-01 powder in anatase structure was obtained from Ishihara Sangyo, Japan (Osaka, Japan; surface area 300 m2/g, particle size 7 nm), without further processing. The powder and urea mixed with the molar ratios of 5:1, 5:2, 5:3, 5:4, 5:5, and 5:10 (the corresponding products denoted as 1N-TiO2, 2N-TiO2, 3N-TiO2, 4N-TiO2, 5N-TiO2, and 10N-TiO2, respectively) were ground individually in an agate mortar for homogeneity. Then, the well-mixed powders were heated in a vacuum tube furnace at 400 °C for 3 h. The products were used directly for characterization without further processing.
X-ray powder diffraction (XRD) patterns were recorded on a Bruker D8-Focus x-ray diffractometer (Bruker AXS GmbH, Karlsruhe, Germany) with Cu Kαradiation (graphite monochromator) operated at 40 kV and 60 mA. Field emission transmission electron microscopy was carried out on a JEOL JEM-2010 microscope (JEOL Ltd., Tokyo, Japan) at 200 kV. The amounts of nitrogen were assayed by inductively coupled plasma (ICP) atomic emission spectroscopy using an IRIS Advantage/1000 ICP-AES spectrophotometer (Thermo Jarrell Ash Corporation, Franklin, MA).
XPS measurements were performed on a Shimadzu Axis Ultra DLD x-ray photoelectronic spectroscopy made in Kratos (Manchester, UK) with a monochromatic Al Kα x-ray source (1486.6 eV). Survey spectra were recorded with pass energy of 160 eV and high-resolution spectra of elements were recorded with pass energy of 40 eV. The products were pressed to form pellets before XPS measurements. The binding energy of XPS spectra was calibrated by using C 1s peak at 284.8 eV originating from adventitious hydrocarbon contamination as the reference. Decomposing of the spectra was accomplished using XPSPEAK41 software and a Shirley-type background subtraction was used.
Fourier transform infrared (FTIR) spectroscopy was carried out on a Nicolet NEXUS 7000C spectrometer (Thermo Fisher Scientific, West Palm Beach, FL) with KBr pellet technique in air. UV–Vis diffuse reflectance spectra were recorded on a B & W TEK BWS003 spectrophotometer (B & W Tek, Inc., Newark, DE) equipped with polytetrafluoroethylene (PTFE) integrating sphere and PTFE reference.
Surface photovoltage (SPV) measurements were performed under ambient condition on a self-made system comprising a 500 W xenon lamp, a lock-in amplifier (SR830-DSP) with a light chopper (SR540), a sample cell, and a computer.
III. RESULTS AND DISCUSSION
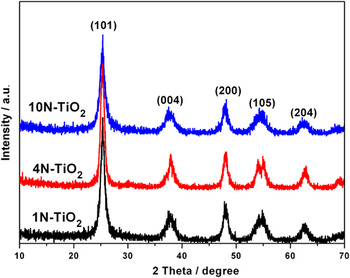
The XRD patterns of 1N-TiO2, 4N-TiO2, and 10N-TiO2 are shown in Fig. 1. Strong and symmetric diffraction peaks indicate good crystallinity. All the diffraction peaks are agreed with the lines of anatase (JCPDS Card No. 21-1272), which can be indexed as (101), (004), (200), (105), (204), and so on. The indices of the main peaks are labeled in Fig. 1. There are no other obvious phases, which means that the amount of nitrogen does not change the purity of the products obtained in vacuum. Because peak (101) is singular, but other peaks include several components by broadening except the labeled main peaks, (101) is used to calculate the crystallite sizes of the three samples by the Debye–Scherrer formula: D = 0.89λ/(β × cosθ), where D is the average grain size, λ represents Cu Kαwave length 0.1542 nm, and β is the half-width of the peak at Bragg angle θ. The results are 16.4, 15.0, and 13.0 nm, respectively, which indicate that the products are nanocrystals smaller than 20 nm and the particle sizes decrease slightly with the increasing dose of urea.
XRD patterns of 1N-TiO2, 4N-TiO2 and 10N-TiO2.

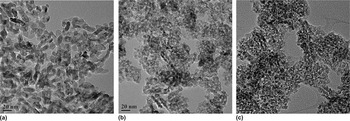
Figure 2 is the three TEM images of 1N-TiO2, 4N-TiO2, and 10N-TiO2, respectively. The average particle sizes decrease with more doped nitrogen and are all about 20 nm or smaller, which agree with the conclusion from the XRD patterns. It is obvious that the particle sizes are nearly uniform for the three samples, particularly for the high nitrogen product (10N-TiO2). In other words, more urea can decrease the mean size and improve the homogeneity of the size distribution via this synthesis approach.
TEM images of 1N-TiO2 (a), 4N-TiO2 (b) and 10N-TiO2(c).

The ICP results of the different doped N-TiO2 show that the nitrogen contents are 0.49, 0.71, 1.03, and 10.16 wt% for 1N-TiO2, 2N-TiO2, 3N-TiO2, and 10N-TiO2, respectively. Comparing with the original nitrogen weight percentages (7, 14, 21, and 70%, respectively) before calcination, it indicates that only a small amount of nitrogen atoms bond with anatase, which results from vacuum to accelerate the escaping of nitrogen during calcining.
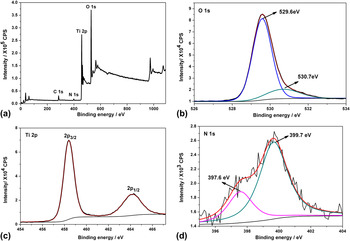
XPS measurements were used to check whether nitrogen has been incorporated within the structure and provide the information about the actual chemical state of Ti, N, and O. The XPS spectra and their decomposed profiles of 4N-TiO2 are shown in Fig. 3. The binding energy is corrected by the C 1s peak (284.8 eV) seen in the survey pattern [Fig. 3(a)]. There exist two binding state in the O 1s spectrum [Fig. 3(b)]. The main peak situated at 529.6 eV is corresponded to the oxygen in Ti–O bonds.Reference Shao, Ma, Zhang, Ren and Yuan22 The other value of 530.7 eV is far from the peak of OH− at 532.0 eV.Reference Shao, Ma, Zhang, Ren and Yuan22 And the XPS quantitative analysis presents the molar ratio of O to Ti was 2.2:1, which is contrary to the fact that substoichiometric titania was obtained by calcining pure titania at 400 °C for 3 h in vacuum.Reference Mitoraj and Kisch6 Therefore, there is also little absorbed O2−37 and the absorbed nitrogen might inhibit the evaluation of oxygen, which indicate that the obvious low intensity shoulder peak (530.7 eV) could be ascribed to the N–O bonds. The Ti 2p spectrum [Fig. 3(c)] only shows a singular component to be described as Ti4+. Comparing with the spectra of O 1s and Ti 2p, the spectrum of N 1s [Fig. 3(d)] has big noise because of relative small concentration (1.72 wt% from the XPS quantitative analysis, which is similar to the result from ICP analysis). The low binding energy state of nitrogen (397.6 eV), near the handbook value of the Ti–N bonds in TiN (397.3 eV), can be ascribed to the incorporated nitrogen in titania as β-N or O–Ti–N.Reference Mitoraj and Kisch6, Reference Shao, Ma, Zhang, Ren and Yuan22, Reference Shang, Xu, Du and Li36 The small positive shift is attributed to the bigger electronegativity of oxygen than that of nitrogen. The higher peak at 399.7 eV is assigned to absorbed nitrogen of NOx groups,Reference Shang, Xu, Du and Li36, Reference Han, Xin, Liu, Ma and Tang43, Reference Chen and Burda47 which originate from surface chemisorbed nitrogen.Reference Mitoraj and Kisch6, Reference Liu, Yang, Wang, Cheng, Pan, Lu and Cheng14 The conclusion is also in agreement with O 1s spectrum. It must be noted that the peak of surface absorbed nitrogen is stronger than that bonding with inner titanium, which is completely different from the former reports for samples prepared in air or other atmosphere.Reference Shao, Ma, Zhang, Ren and Yuan22, Reference Zhang, Lin, Zhang, He and Wang28, Reference Shang, Xu, Du and Li36 We deem that vacuum acts as an important role, which oppresses the bonding reaction but accelerates the evaluation of nitrogen. So when urea decomposes, most of nitrogen absorbed on the surface of titania runs off before bonding with inner Ti, which decreases severely the amount of incorporated nitrogen and results in the lower XPS response.
XPS spectra of 4N-TiO2: Survey (a); O 1s (b); Ti 2p (c) and N 1s (d).

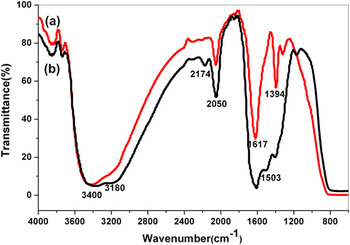
Figure 4 compares FTIR spectra of 1N-TiO2 and 10N-TiO2. Low frequency broad bands near 800 cm−1 correspond to the Ti–O stretching and Ti–O–Ti bridging stretching modes.Reference Shao, Ma, Zhang, Ren and Yuan22, Reference Yang, Jiang, Shi, Xiao and Yan48 The absorbed water and surface hydroxyl group, attributed to atmospheric humidity, were revealed by a strong bending vibration band at 1617 cm−1 and a broad stretching vibration band around 3400 cm−1.Reference Jang, Kim, Kim, Ji, Kim and Lee20, Reference Shao, Ma, Zhang, Ren and Yuan22 These bands in 10N-TiO2 are stronger than those in 1N-TiO2, indicating that more nitrogen and smaller particle size increase the surface absorbed water and hydroxyl groups. Two additional shoulder bands around 3180 and 1503 cm−1 are present significantly in 10N-TiO2 but not clear in 1N-TiO2. They can be described as the stretching and bending vibrations of N–H bond, respectively.Reference Jang, Kim, Kim, Ji, Kim and Lee20, Reference Yang, Jiang, Shi, Xiao and Yan48 Different from other reports,Reference Yang, Jiang, Shi, Xiao and Yan48, Reference Hu, Wang, Li and Loewe49 the bands indicating the Ti–N bond at around 1474, 1250, and 1080 cm−1 are not observable in our produces. Contrarily, the notable bands at 2174, 2050, 1394, 1308, and 1178 cm−1 can be ascribed to the stretching vibration of surface absorbed N–O bondReference Yang, Jiang, Shi, Xiao and Yan48 of bridged nitro species such as [NO2]− and [NO3]−.Reference Pap, Baia, Mogyorosi, Dombi, Oszko and Danciu50, Reference Nakamoto51 These results are in agreement with those from XPS tests, particularly for N 1s spectrum. Thus, doped nitrogen exists mainly as absorbed NOxspecies.
FTIR spectra of 1N-TiO2 (a) and 10N-TiO2(b).

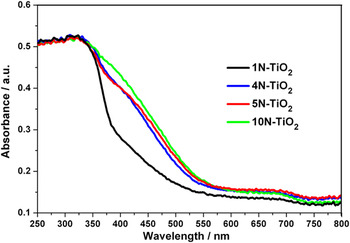
UV–Vis diffuse reflectance spectra of 1N-TiO2, 4N-TiO2, 5N-TiO2, and 10N-TiO2 are shown in Fig. 5. The characteristic absorption edges are all cut off at about 350 nm (3.54 eV), which is higher than that of bulk sample (3.2 eV) attributed to the nanoscale effect. The band gap increases a little with more urea used, suggesting that the particle size decreases during nitrogen ratio increasing, which agrees with the results from XRD and TEM. The absorption band extends to about 750 nm and can be crudely decomposed into two parts with the maximal peaks at near 380 and 675 nm by the obvious humps. The result reveals at least two main impurity energy levels in the intrinsic band gap attributed to the binding states of nitrogen, which also supported by the conclusion from XPS tests. It can ascribe rationally the high impurity level to nitrogen in Ti–N and the low one to the absorbed nitrogen according to the bonding energy values. The nonlinear change of intensities of the extended absorptions shows that excess nitrogen does not significantly improve the visible absorption and the increasing rate turns down beyond the molar ratio 5:4 because of the difficulty for more nitrogen to diffuse into the inner of titania to bond with inner Ti atoms and/or absorb by inner vacancies, as also detected in the intensity comparison of the XPS spectrum for N 1s.
UV-Vis diffuse reflectance spectra of 1N-TiO2, 4N-TiO2, 5N-TiO2 and 10N-TiO2.

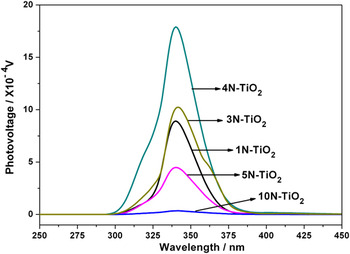
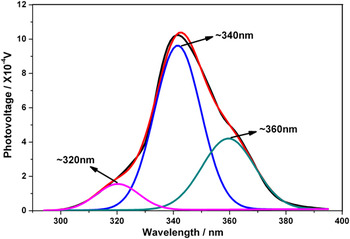
To investigate the mechanism of surface photogenerated charge transfer of the N-doped TiO2 nanocrystals, SPV measurements were carried out. Figure 6 presents the SPV spectra of 1N-TiO2, 3N-TiO2, 4N-TiO2, 5N-TiO2, and 10N-TiO2. The selected spectrum of 3N-TiO2 is decomposed into three components shown in Fig. 7. The peaks at 320 and 340 nm are ascribed to the electron transition from the valence to the conduction band (band-to-band transition, O2p → Ti3d),Reference Li, Wang, Wang, Lin, Zhang and Yang37 which are in good agreement with the cutoff edge at about 350 nm from the UV–Vis diffuse reflectance measurement. These two split peaks might result from the difference of energy states of the nanocrystals not in strictly uniform microstructure. According to the visible absorption of the product, the peak at near 360 nm presents the transition of impurity energy levels for nitrogen dopant.Reference Zhang, Lin, Zhang, He and Wang28 With the increase of nitrogen amount, the intensity of SPV response first experiences an increment to reach the maximum at the molar ratio 5:4 and then decreases to near zero at 5:10. This can be explained that impurity energy levels caused by doped nitrogen and oxygen vacancy are the carrier trap to separate the photoproduced charge.Reference Wang, Tafen, Lewis, Hong, Manivannan, Zhi, Li and Wu52 But from the first-principles calculated result,Reference Zhao, Huang, Tian, Zhou, Li and Du24 the band gap states composed of N 2p, O 2p, and Ti 3d states are formed after N doping, and the interactions of three states widen and delocalize the band gap states, which narrow the energy levels to raise the long wave length absorption and improve the disability of trapping; in other words, excessive dose of nitrogen spreads the impurity energy levels, which reinforces the recombination of photoproduced carriers responsible for reducing the photovoltaic signal together with longer wave length absorption even into infrared range. The latter is supported by only small intensity increasing in the UV–Vis diffuse reflectance spectra, though urea was added at more than two times in weight for 10N-TiO2 relative to 5N-TiO2. The infrared absorption will be done in further work for present limitation. The destruction of discrete energy levels is also revealed by the FTIR spectra, in which the main peaks for N–O bonds of 1N-TiO2 are sharper than 10N-TiO2. Therefore, from the above experimental and theoretical results, we can conclude that the appropriate nitrogen dose can improve the photogenerated electron–hole pair separation efficiency, which benefits the photocatalysis.
SPV spectra of 1N-TiO2, 3N-TiO2, 4N-TiO2, 5N-TiO2 and 10N-TiO2.

SPV spectrum with the decomposed profiles of 3N-TiO2.

IV. CONCLUSIONS
The N-doped TiO2 nanocrystals were prepared by using urea as the nitrogen source reacted with the commercial anatase powder ST-01 in vacuum. The molar ratios of urea to titania ranges from 5:1 to 5:10 to give a detail inspection of the influence of nitrogen amount. This method can produce the nanocrystals with the grain size smaller than 20 nm, which decrease when more urea used. The products contained mainly two kinds of nitrogen: the incorporated nitrogen as β-N or O–Ti–N and the surface adsorbed NOx groups, which cause the visible absorption extension from 350 to 750 nm in the UV–Vis diffuse reflectance spectra. Different from syntheses in other atmospheres such as air or N2, the preparation in vacuum resulted in more surface absorbed nitrogen species than inner incorporated ones. From the comparison of the SPV response intensities of the products with different N-doped amount, it was found that appropriate doped concentration can increase the separation efficiency of photoproduced carriers by trapping electrons and holes in different energy levels with adequate gaps so as to inhibit their combination as well as lengthen their lifetime, which is vital for photochemical application. In contrary, excess nitrogen will turn into the recombination centers of the carriers by spreading the impurity energy levels, which disable the carrier-trapped action and result in the decreasing of the photoelectric conversion efficiency.
In all, except for presenting one method to obtain N-doped TiO2nanocrystals smaller than 20 nm for potential photocatalytic and photovoltaic materials, our research also describe detailedly the difference of nitrogen species obtained in vacuum from those in the other atmospheres and the characterization of the products by the advanced surface analytical techniques, particularly for SPV, which will be useful to understand the mechanism of the photovoltaic property of N-doped anatase.
ACKNOWLEDGMENTS
The authors are highly indebted to Dr. Kai-Xue Wang for ST-01 powder. This work was supported by Knowledge Innovation Project of the Chinese Academy of Sciences (Grant No. 49107SCX013).