Dairy calves are typically housed individually after removal from the dam at birth. Individual housing allows for controlled management and prevents the horizontal transmission of disease through calf-to-calf contact (Hepola, Reference Hepola2003; Lundborg et al. Reference Lundborg, Svensson and Oltenacu2005). However, after the first few weeks of age, cattle are gregarious animals, and calves express high motivation to interact socially (Bøe & Færevik, Reference Bøe and Færevik2003; Færevik et al. Reference Færevik, Andersen and Jensen2007). This may be one reason why the European Union has mandated that dairy calves greater than 8 weeks of age be housed in groups to provide the calves with the opportunity to perform social behaviours (Council Directive 97/2/EEC), which some consider an improvement of animal welfare (Færevik et al. Reference Færevik, Andersen and Jensen2007). In the United States, many states such as California, Arizona and Oregon have passed legislation that prohibits producers from raising veal calves in individual systems (AVMA, 2008). Although this legislation did not include dairy calves, it is conceivable to assume that future propositions and legislations are likely to include dairy calves. Before weaning, calves in groups or pairs may exhibit non-nutritive sucking on each other and competition for milk in systems where milk is limit-fed; therefore, producers prefer to house calves in groups only after they are weaned from milk (de Passille, Reference de Passille2001; Hepola, Reference Hepola2003).
There may be some benefits to group housing; for example, Warnick et al. (Reference Warnick, Arave and Mickelsen1977) observed a greater consumption of calf starter in calves that were group housed after weaning. Furthermore, group-housed calves were less fearful of novel environments and handling stressors at 3 months of age (Bøe & Færevik, Reference Bøe and Færevik2003). Nonetheless, grouping calves after they have been housed individually may be stressful during a period of potential exposure to novel microbes. When calves are regrouped or an unfamiliar animal is added to the group, it may take up to 15 d for social interactions and locomotor activities to return to basal levels (Bøe & Færevik, Reference Bøe and Færevik2003). Other researchers have recommended that after dairy calves are weaned at age 5–8 weeks, they should be moved from their individual housing into small ‘transition’ groups of 3–6 calves per pen (Quigley Reference Quigley2001; Bach et al. Reference Bach, Ahedo and Ferrer2010). Then at approximately 6 months of age, the calves can be moved into larger groups.
Recommendations and previous research into ‘commingling’ or placing calves into small groups have primarily focused on behaviour and performance. Very little is known about how grouping calves into transition-pens will influence innate immune responses. It is well-documented that stress influences the immune system of dairy calves and may increase the relative risk of disease (Amadori et al. Reference Amadori, Archetti, Frasnelli, Bagni, Olzi, Caronna and Lanteri1997; Hulbert et al. Reference Hulbert, Cobb, Carroll and Ballou2011a, Reference Hulbert, Cobb, Carroll and Balloub). We hypothesized that calves in transition-pens will be a mild stressor and have acute effects on innate immune function. Therefore, the objectives of the current study were to determine the influences of grouping dairy calves in small-grouped, transition-pens after they had been reared individually on innate immune responses and production performance.
Materials and Methods
Animals, housing and treatments
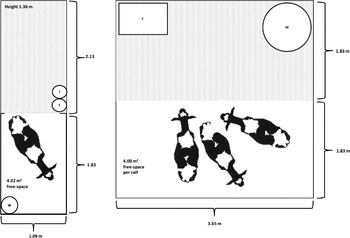
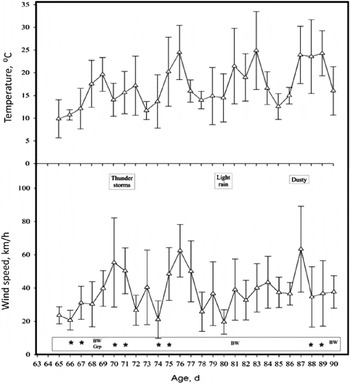
The experiment was conducted in May 2010. All animal procedures were reviewed and approved by the Texas Tech University Animal Care and Use Committee. Sixty-four Holstein, bull calves (24–48 h after birth) were purchased from two local commercial dairies over a 7-d period. All calves were fed 3·8 l of pooled colostrum from their respective dairy within 12 h of birth and all calves were transported approximately 60 km to the Hilmar Cheese/Agri-Plastics Calf Research Facility at Texas Tech University in New Deal, TX. Calves were housed with straw-bedding in commercial 2·13×1·09-m polyethylene calf hutches (Agri-Plastics, Tonawanda, NY, USA) attached to 1·83×1·09-m pens, which provided each calf with approximately 4·02 m2 of free space (Fig. 1). Calves were fed 3·8 l of a 20% all milk protein/20%-fat milk replacer (Land O Lakes, Minneapolis, MN, USA) and weaned by age 45 d as previously described (Hulbert et al. Reference Hulbert, Cobb, Carroll and Ballou2011a, Reference Hulbert, Cobb, Carroll and Balloub). Calves had ad-libitum access to an 18·9% CP steam-flake corn/soybean meal based calf starter (Hulbert et al. Reference Hulbert, Cobb, Carroll and Ballou2011a) and water. The quantity of calf starter was recorded and adjusted daily for an approximate 10% refusal. During this experiment, weather was variable; therefore, weather information in relation to the trial timeline was collected from a local weather station (Weather Underground, 2010) and the daily mean temperatures (mean±sd), wind speed (mean±sd) and notes were reported (Fig. 2). At age 66±2·3 d, all calves were stratified by age and body weight and randomly assigned to 1 of 2 penning-strategy treatments: Groups of 3 (Grouped; n=36 calves in 12 pens) and Control (n=28, remained in hutches). Because calves were randomized, there were no differences in age 4 d total serum protein between treatments (5·04±0·21 sem g/dl). At age 68 d, all calves were handled to collect body weights (BW), and subsequently, Grouped-calves were moved using a trailer and tractor, 405 m from their home-hutches to their respective pens. All calves were also weighed at age 78 and 89 d. Grouped-calf pens were allowed 4·00 m2 of free space per calf (Fig. 1).
All calves were reared in enclosed, commercial 2·13×1·09-m polyethylene calf hutches (left panel) (Agri-Plastics, Tonawanda NY, USA) attached to 1·83×1·09-m pens, which provided each calf with 4·02 m2 of free space. At age 68±2·3 d, grouped-calves were moved to pens of 3 (n=36) or they remained in hutches (Control; n=28). Grouped-calf pens (right panel) were 3·65×3·65 m with at least half of the pen shaded. In the shaded portion of the pen, calves had a 91·44-cm diameter water-bucket (w) and a 91·44×60·96-cm feeder (f) placed in each corner, providing 0·45 m of free bunker space and 4·00 m2 of free space per calf.

Daily (mean±sd) environmental temperatures (top panel) and wind speed (mean±sd; bottom panel) and timeline (above x-axis) of handling calves during the experiment. Asterisk indicates when blood was sampled in two blocks. Body weights (BW) were measured and grouped calves (Grp) were place in pens of 3 (n=36) or were left in home calf hutches (Control; n=28).

Blood collection and analyses
Nine millilitres of peripheral whole blood (6-ml and 3-ml heparin vacutainers) were collected via jugular venepuncture immediately before assignment of treatments (age 66±2·3 d), as well as age 70, 74, and 88±2·3 d. Samples had to be collected into 2 blocks on 2 consecutive days to accommodate logistics of running the immune function assays. The block (A or B) was assigned randomly to calves within their treatment (n=18 Grouped, and n=14 Control per block). The 3-ml vacutainers from each calf were analysed for haematocrit, total leucocyte counts, and differentiated analyses of neutrophils, lymphocytes, and monocytes using a Cell Dyn 3700 with automated 50-sample loader and vet-package software (Abbot Laboratories, Abbot, IL, USA). In addition, the neutrophil:lymphocyte cell ratio (N:L) was calculated.
Plasma analyses
Plasma was collected after centrifugation of 3-ml vacutainers at 1200 g and stored at −80°C until analysed for cortisol, glucose and haptoglobin concentrations. Circulating concentrations of cortisol were determined using a commercially available competitive-binding Chemiluminescence-ELISA kit (Searchlight- Aushon BioSystems Inc., Billerica, MA, USA). The intra-assay variation was 5·8% and inter-assay variation was 7·2% for the cortisol assay. Plasma glucose was analysed by commercially available enzymic, colorimetric kits (Stanbio Laboratory, Boerne, TX, USA). Control serum (Randox Laboratories) was used to calculate the inter- and intra-assay coefficients of variation of 4·0 and 3·8, respectively. Plasma haptoglobin concentrations were determined by measuring haptoglobin/haemoglobin complex by the estimation of differences in peroxidase activity (Hulbert et al. Reference Hulbert, Cobb, Carroll and Ballou2011a). Results were expressed in arbitrary units resulting from the absorption reading at 450 nm×100. The intra- and inter-assay variations were 1·8 and 1·3% for this assay.
Neutrophil function
Neutrophils were analysed by dual-color flow cytometery (QuantaSC MPL, Beckman Coulter, Fullerton, CA, USA) for simultaneous phagocytic and oxidative burst capacities of peripheral blood neutrophils in response to an Escherichia coli (Esch. coli 0111:H8) using methods as previously described (Hulbert et al. Reference Hulbert, Cobb, Carroll and Ballou2011a). Esch. coli were heat-killed and labelled with propidium-iodide-label and the conversion of dihydrorhodamine (Invitrogen) to rhodamine was used to measure the oxidative burst response. Neutrophils that were positive for both oxidative burst (OB+) and phagocytosis (PG+) were gated using a FL-1 by FL-3 scatter-plot. The percent neutrophils that exhibited both oxidative burst and phagocytosis (OB+PG+) were measured for cell percentage and geometric mean fluorescence intensity for oxidative burst (FL-1) and phagocytosis (FL-3).
Neutrophil l-selectin was assayed as previously described (Hulbert et al. Reference Hulbert, Cobb, Carroll and Ballou2011a) using primary anti-bovine CD62L monoclonal antibody (VMRD, Pullman, WA, USA) and a F(ab′)2 antimouse IgG:FITC labelled secondary antibody (AbD Serotec Raleigh, NC, USA). Using the flow-cytometer analysis software neutrophil l-selectin was measured using total geometric mean fluorescence intensity (FL-1).
Whole blood LPS stimulation
Whole blood was stimulated using methods as previously described (Hulbert et al. Reference Hulbert, Cobb, Carroll and Ballou2011a). Briefly, whole blood was diluted in cell-culture media and stimulated at a final concentration of 1 μg/ml of LPS (Esch. coli O111:B4; Sigma-Aldrich, St Louis, MO, USA) and incubated for 24 h. The supernatant fraction was collected and stored in −40°C freezer until analysed for tumour necrosis factor-alpha (TNF-α) using a commercially available ELISA (DY2279E; R&D Systems, Minneapolis, MN, USA). The intra- and inter-assay coefficients of variation were 3·2 and 4·1%, respectively. The sensitivity of this assay was 125 pg/ml.
Statistical analysis
All data were analysed by restricted maximum likelihood ANOVA using the MIXED procedure of SAS (v.9.2, SAS Inst. Inc., Cary, NC, USA). Prior to ANOVA, all data were tested for normality of the residuals by evaluating the Shapiro–Wilk statistic using the UNIVARIATE procedure of SAS. Data that were not normally distributed were either log- or root-transformed before mixed model analysis. Baseline measurements taken before assigning penning strategy treatments (age 66 d) were tested as a covariate in all statistical models. The appropriate covariance structure was chosen for the within-calf nested within treatment for all models using the smallest Schwarz Bayesian Criterion. For all blood, plasma, and immune response data, a linear, mixed model with the fixed effects of treatment, time, and the interactions of treatment×time and block×treatment×time were fitted. The random effect was calf nested within treatment×block. Prior to statistical analysis, performance data were calculated for each pen. The statistical model for the performance data included the fixed effects of treatment, time, and the interaction of treatment×time. The random effect was pen nested within treatment. A Kenward–Roger correction was applied to the denominator degrees of freedom to obtain appropriate standard errors and F statistics for each model. Pair-wise comparisons were performed at each time using a sliced-effect multiple comparison approach with a Tukey–Kramer adjustment. A treatment difference of P⩽0·05 was considered significant, and P⩽0·10 was considered a tendency.
Results
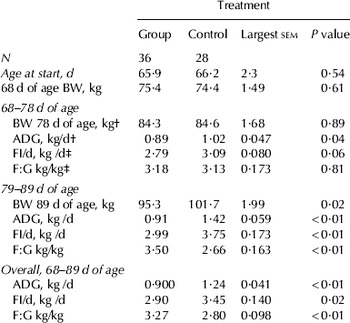
There was a tendency for Grouped-calves to have less feed intake from age 66 to 78 d (P=0·06) and less feed intake from age 79 to 89 d (P<0·01; Table 1) than Control-calves. Consequently, Grouped-calves had lighter BW than Control-calves by age 89 d (P<0·05; Table 1), and had less average daily gain (ADG) by age 78 d (P<0·04) and for the overall period (P<0·01; Table 1) than Control-calves. In addition, Grouped-calves F:G ratios were not different from Control-calves for age 66–78 d (P=0·81), but for the age 79–89 d period, Grouped-calves had greater F:G than Controls (P<0·01; Table 1). Control-calves had greater plasma glucose concentrations than Grouped-calves (P<0·05; Table 2).
Performance data for grouped (pens of 3) and control calves

† For body weight (BW) and average daily gain (ADG), the individual animal was the experimental unit (n=36 Grouped and n=28 Control)
‡ For feed intake (FI) and feed:gain (F:G), the average feed intake and gain/d was calculated and the pen was the experimental unit (n=12 Grouped and n=28 Control)
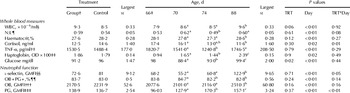
Daily means of blood measurements of all calves (n=64) before (age 66 d) and after Grouped-calves were placed in pens

† Calves were all weighed and grouped-calves were moved to pens (n=36; 3/pen) at age 66±2·3 d or were left in their home hutches (control n=8)
‡ Data for age 66 d was considered baseline and used as a covariate in the model
§ Circulating white blood cell counts
¶ Neutrophil:lymphocyte ratios, log-transformed P-values
†† Tumor-necrosis factor-alpha (TNF-α) from the supernatant of whole blood stimulated with 1 μg/ml of lipopolysacharride (LPS) for 24 h
‡‡ Optical density, root-transformed P-values
§§ Geometric mean fluorescent intensity
¶¶ The percentage of neutrophils that were oxidative burst (OB) positive and phagocytosis (PG) positive
††† Oxidative burst (OB) geometric mean fluorescent intensity of OB+PG+ neutrophils
‡‡‡ Phagocytosis geometric mean fluorescent intensity of OB+PG+ neutrophils
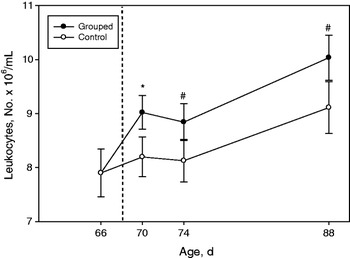
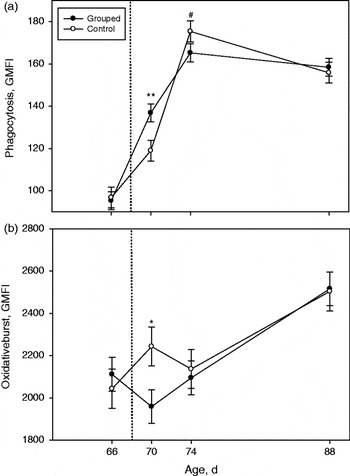
Although plasma cortisol concentrations did not increase above baseline concentrations, Control-calves had greater plasma cortisol concentrations (15·3±1·89 se ng/ml) than Grouped-calves (10·4±1·64 se ng/ml) at age 74 d (P<0·01). With the exception of neutrophil oxidative burst response (P<0·05; Fig. 3b), Grouped-calves did not have acutely (age 70 or 74 d) suppressed measures of innate immune responses (P>0·10; Table 2; Figs. 3a, 4a, b). In contrast, Grouped-calves had greater total circulating concentration of leucocytes at age 70 d (P<0·05; Fig. 5), which persisted from age 74 to 88 d inclusive (P<0·10). Neutrophil phagocytosis was increased at age 70 d among Grouped-calves (P<0·01; Fig. 3a) compared with Control-calves
Peripheral blood leucocyte counts (mean±se) before (age 66 d) and after calves were penned in groups of 3 at age 68±2·3 sd (group, n=36) or were left in home calf hutches (control, n=28). treatment×time sliced effect *P<0·05; # P=0·09.

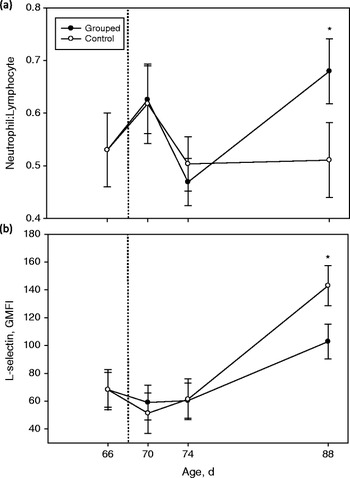
(a) Peripheral neutrophil to lymphocyte ratios and (b) neutrophil l-selectin geometric mean fluorescence intensity (GMFI; mean±se) before (age 66 d) and after calves were penned in groups of 3 at age 68±2·3 sd (Group, n=36) or were left in home calf hutches (control, n=28). Treatment×time sliced effect *P<0·05.

Peripheral neutrophil geometric mean fluorescence intensity (GMFI; mean±se) of (a) phagocytosis and (b) oxidative burst before (66 d of age) and after calves were penned in groups of 3 at age 68±2·3 d (Group, n=36) or were left in home calf hutches (Control, n=28). Treatment×time sliced effect **P<0·01; *P<0·05; # P<0·08.

.
At age 88 d, Grouped-calves had elevated neutrophil:lymphocyte ratio (P<0·05; Fig. 4a) and lower neutrophil l-selectin expression (P<0·05; Fig. 4b). No other measures of innate immune competence were different between Grouped- and Control-calves at age 88 d. There was no treatment or treatment time effects on plasma haptoglobin concentrations during the study (P>0·10; Table 2). In all calves, haptoglobin concentrations increased at age 70 d, decreased at age 74 d, and were greatest at age 88 d (P<0·05; Table 2).
Discussion
Rearing dairy calves individually for the first few weeks of life is common practice to provide calves with individual care as they adapt to the ex-utero environment as well as to prevent the horizontal transmission of disease (Warnick et al. Reference Warnick, Arave and Mickelsen1977; Lundborg et al. Reference Lundborg, Svensson and Oltenacu2005). Producers often observe decreased performance during the grouping phase, which may be due to stressors related to the change from being individually raised to being placed in large groups. In the current study, feed intake, ADG and feed efficiency were reduced among Grouped-calves when compared with Control-calves. Data also indicated that the Grouped-calves had not fully acclimatized to the group-housing within the 21-d observation period. Differences in the housing environments in the current experiment may explain some of the performance variation (Hepola et al. Reference Hepola, Hanninen, Pursiainen, Tuure, Syrjala-Qvist, Pyykkonen and Saloniemi2006). Although space allowance for each calf was equal between treatments, the Control-calves had more protection from the windy environment, while all calves were exposed to the same temperatures. The individual hutch was enclosed; whereas although the group pens were equipped with shade, the pen design did not include a wind-barrier for calves. Because weather conditions were variable, especially wind speed, Grouped-calves probably reduced feed intake and therefore reduced feed efficiency.
The reduced performance among Grouped-calves could also be due to an increased locomotor activity and decreased inactivity. In fact, other researchers found that grouped-housed or paired calves spent less time feeding and more time performing other locomotor behaviours, while individually and isolated calves spent more time in recumbency (Warnick et al. Reference Warnick, Arave and Mickelsen1977; Chua et al. Reference Chua, Coenen, van Delen and Weary2002). Therefore, Grouped-calves in the current study may have had increased locomotor activity. Coinciding with variable weather conditions, increased activity probably contributed to decreased efficiency and utilization of metabolizable energy for growth. Similarly to our findings, dry matter intake decreased during post-weaning grouping, especially in calves that were fed extra milk replacer during preweaning (Terré et al. Reference Terré, Devant and Bach2007). However, others (Babu et al. Reference Babu, Pandey and Sahoo2004; Hepola et al. Reference Hepola, Hanninen, Pursiainen, Tuure, Syrjala-Qvist, Pyykkonen and Saloniemi2006 observed increased starter consumption and dry-matter feeding-related behaviours in calves grouped at an earlier age, 0–2 d, after birth. Therefore, it remains to be determined the earliest age when calves raised in individual, outdoor hutches should be introduced to group housing, and the present data and previous literature suggest that group-housing earlier than 66 d of age may improve performance measures. This is an area that warrants further research.
Performance measures are not the only determining factors for whether or not a housing condition is deemed ‘stressful’ (Amadori et al. Reference Amadori, Archetti, Frasnelli, Bagni, Olzi, Caronna and Lanteri1997). Moving calves into small-grouped transition-pens 23 d after weaning was probably a mild stressor and transient, as evidenced by only a suppressed neutrophil oxidative burst at age 70 d. Suppressed neutrophil oxidative burst has been associated with other stressors, such as early weaning of dairy calves (Hulbert et al. Reference Hulbert, Cobb, Carroll and Ballou2011a), castration of dairy calves (Pang et al. Reference Pang, Earley, Sweeney, Pirani, Gath and Crowe2009), and transportation of beef calves (Hulbert et al. Reference Hulbert, Carroll, Burdick, Randel, Brown and Ballou2011c). In the current study, the stressor from moving calves into pens was probably mild because there was no treatment effect on either neutrophil l-selectin expression or the N:L at age 70 and 74 d. Previous research indicated that both reduced neutrophil l-selectin expression and elevated plasma N:L were sensitive measures of stress among cattle (Hulbert et al. Reference Hulbert, Cobb, Carroll and Ballou2011a, Reference Hulbert, Cobb, Carroll and Balloub, Reference Hulbert, Carroll, Burdick, Randel, Brown and Ballouc). Despite a lack of a treatment effect on either neutrophil l-selectin expression or plasma N:L, relative to baseline measurements at age 66 d, all calves had decreased neutrophil l-selectin and increased N:L at age 70 d. In addition, all calves had decreased TNF-α from LPS-stimulated whole blood cultures and increased plasma haptoglobin concentrations at age 70 d when compared with age 66 d. These immunological and biochemical changes indicated that all calves may have experienced an acute stress, regardless of treatment. All calves were handled and weighed before the Grouped-calves were moved to their pens; therefore, the stress at age 70 d was at least partially due to handling stress.
Leucocyte numbers in Grouped-calves at age 70 d were increased and remained elevated throughout the study. The leucocytosis of Grouped-calves is most likely due to an increased immunogenic stimulation from either the new environment and/or through direct contact with novel calves. Although Grouped-calves had increased circulating leucocyte pool, this probably did not contribute substantially to the reduced performance, as the total leucocyte pool remains only a small fraction of the total body mass (Klasing, Reference Klasing1998). Nonetheless, Lochmiller & Deerenberg (Reference Lochmiller and Deerenberg2000) argued that even though the total leucocyte pool quantitatively is only a small fraction of total body mass, an activated acute phase response can contribute to decreased performance and feed efficiency. In the present study, no calves showed any clinical signs of disease and there was no difference in the plasma concentration of the acute phase protein, haptoglobin, between Grouped- and Control-calves, which suggests that the decreased performance of Grouped-calves was not associated with a substantially activated acute phase response. The immunogenic stimulation during this transition-phase may benefit cattle once they are moved in larger groups because of a greater diversity of immunological memory (Færevik et al. Reference Færevik, Andersen and Jensen2007); therefore this warrants further research.
If moving calves into transition pens was stressful, investigators expected that by age 88 d, Grouped-calves would have acclimatized to their new environment and the innate immune responses normalized. However, all calves were exposed to dusty and windy conditions immediately prior to the last blood sample collection on age 88 d. All calves had increased haptoglobin concentrations, haematocrits, neutrophil l-selectin expression and oxidative burst. At age 88 d, it is probable that weather-conditions played a role in Grouped-calves' innate immunity as indicated by increased N:L and decreased neutrophil l-selectin compared with Control-calves. All calves experienced the same weather conditions; therefore this dissimilarity in neutrophil adhesion between treatments is probably due to the difference of wind barriers in each housing treatment. Therefore, investigators propose that transition pens with an enclosure may help reduce any additional weather-related stressors when calves are likely to be exposed to novel microorganisms.
Legislation in both the European Union and the United States could possibly outlaw individual-housing systems in dairy calves completely. This would greatly impact dairy calf production systems and potentially calf well-being. It is important that future research aims to determine the earliest age at which dairy calves should be placed into groups, the size of the group, and the type of housing. In addition to using performance measures, physiological end-points such as innate immune measures and health should be used to assess the effectiveness of these management strategies.
The authors thank Texas Tech University students, Clayton Cobb, Colton Cobb and Luke Schwertner and USDA-Livestock Issues Research Unit Support-scientist, Jeff Dailey, for their assistance with animal husbandry. The authors acknowledge that the milk replacer was donated by Land O'Lakes Animal Milk Products Co. (Shoreview MN, USA).