I. INTRODUCTION
Titanium dioxide (TiO2) has been extensively investigated and regarded as one of the most promising solar-driven photocatalysts for hydrogen generation and water cleaning. Reference Liu, Yang, Pan, Yang, Lu and Cheng1–Reference Sinhamahapatra, Jeon and Yu5 However, its large band gap energy of 3.2 eV limits its solar-to-hydrogen efficiency for photoelectrochemical application, as the ultraviolet (UV) light only accounts for less than 5% of the entire solar spectrum. In the semiconductor-based photocatalytic process, photo-excited electrons and holes are first generated after the semiconductor absorbs light, they separate and migrate to the surface of the semiconductor to perform photoreduction and/or photooxidation to produce hydrogen from water or remove organic pollutants in water. The overall photocatalytic efficiency is proportional to the efficiency of each step in the photocatalytic process. Specifically, the larger the amount of the sunlight absorbed by the photocatalyst, the higher the photocatalytic efficiency is expected, as more photoexcited electrons and holes will be produced. On the other side, the more electrons and holes reaching on the surface of the photocatalyst, the higher efficiency is expected as well, as more charges can participate in the photooxidation or photoreduction reactions. The number of photo-excited electrons and holes on the surface equal to the number produced by the light absorption minus the number is consumed by various charge trapping or recombination processes before the charges come to the surface. Moreover, the photocatalytic activity depends on the surface area and surface facet of the photocatalyst. The larger the surface area of TiO2, the higher the photocatalytic activity is expected. And the more active surface facet exposed, the higher the photocatalytic activity. Thus, fabrication of the photocatalyst is crucial to its photocatalytic performance. Reference Dahl, Liu and Yin6–Reference Lee, Mazare and Schmuki8
Vertically oriented TiO2 nanotube arrays, which directly grew on a Ti foil by anodic oxidation, possess many advantages for photoelectrocatalytic (PEC) applications. Reference Shin, Lee, Ahn, Kang and Kim9–Reference Macak, Zlamal, Krysa and Schmuki13 First, their well-organized structure provides efficient transfer of photogenerated electrons, ensuring effective charge separation. Second, the large specific surface area enhances photon absorption and reactant adsorption on photoactive surface. Third, when directly grew on the conductive Ti support, they can have a good mechanical stability and good conductivity for electron transfer. Reference Chiarello, Zuliani, Ceresoli, Martinazzo and Selli14 They can be prepared in an electrolyte containing F− ions, either with or without organic solvents. Reference Regonini, Groff, Sorarù and Clemens15,Reference Wang, Yu, Wang, Zhou and Liu16 Their diameters can be controlled from 10 to 600 nm by the applied potential, Reference Wang, Liu, Yu, Zhou and Liu17–Reference Wang and Lin19 and their lengths can be adjusted from less than 1 to longer than 100 μm by changing the anodization electrolyte or anodization time. Reference Qi, Yin, Zhang, Ouyang, Li and Chen20–Reference Albu, Ghicov, Macak and Schmuki24 Their photoelectrochemical performance strongly depends on their morphological properties (e.g., tube diameter, inter-tubular distance, and tube wall thickness). Reference Roy, Berger and Schmuki25,Reference Chen and Mao26 Three-dimensional TiO2 nanotubes with bamboo-type, hierarchically branched, and multiple-layer structures were studied to improve their activities. Reference Luan, Guan and Wang27–Reference Guan and Wang30 Their performance can also be improved by pretreatment of the Ti foils before anodization. Reference Li, Zheng, Shu, Cheng and Li31 For example, enhanced photoconversion efficiency was achieved by Schmuki’s group with bamboo-type nanotubes prepared by alternating-voltage anodization of Ti in an electrolyte consisting of 0.2 mol/L HF in ethylene glycol. Reference Kim, Ghicov, Albu and Schmuki32,Reference Albu, Kim and Schmuki33 Significantly improved photocatalytic efficiency is reported by Li’s group with a facile electrochemical etching method to selectively remove the outer walls of anodic TiO2 nanotubes to separate single-walled TiO2 nanotubes. Reference Li, Cheng, Shu, Zhang, Zheng, Tsang, Cheng, Liang, Lee and Li34 Highly ordered TiO2 nanotubes with different arrangements have been demonstrated with a two-step anodization. Reference Kim, Zhu, Neale and Frank35–Reference Yu, Zhu, Xu, Zhong, Gui, Song, Zhang, Chen and Li38 Meanwhile, it is well known that a combination of co-catalysts and TiO2 can offer the synergetic effects including the favorable charge transport and the increased carrier lifetime. Reference Schneider, Matsuoka, Takeuchi, Zhang, Horiuchi, Anpo and Bahnemann2,Reference Ma, Wang, Jia, Chen, Han and Li7 Most common co-catalysts are noble metals (M), such as Pt, Au, or Pd, which act as electron transfer mediator. Reference Nguyen, Altomare, Yoo, Taccardi and Schmuki39–Reference Li, Tao, Li and Zhang45 Mathews’ group prepared Pt/TiO2 nanoparticle photocatalyst by chemical reduction of H2PtCl6 solution. Reference Antony, Mathews, Ramesh, Murugesan, Dasgupta, Dhara, Dash and Tyagi46 Lin’s group prepared a high efficient water splitting Pt/TiO2 electrode by photoreduction Pt nanoparticles on the TiO2 nanotubes. Reference Lai, Gong and Lin47 In most cases, those co-catalysts are deposited randomly on the surface of the TiO2, which causes unwanted charge recombination in photocatalytic hydrogen generation. It is thus desirable to selectively deposit those co-catalysts on the surface for better charge separation and hence enhanced photocatalytic activity.
In this work, we introduce an “activation step” following the anodization to facilitate the selective deposition of Pt nanoparticles on the end of TiO2 double-wall nanotubes. The Pt nanoparticles successfully deposit on the tube ends by an electrochemical deposition process. These TiO2 nanotubes tipped with Pt nanoparticles show excellent activities in both PEC hydrogen generation and pollution degradation.
II. EXPERIMENTAL SECTION
A. Materials
Ti foils (purity of 99.9%, thickness and size of 0.3 × 40 × 50 mm) were purchased from Baoji Jinbu Titanium Equipment Corporation (Baoji, China). Graphite rod (99.9%) was purchased from Shanghai Zichen Corporation (Shanghai, China). 1-Ethylpyridinium tetrafluoroborate ([EPy][BF4]) was purchased from Lanzhou Institute of Chemical Physics (Lanzhou, China). Ethylene glycol, glycerine, absolute ethyl alcohol, NH4F, acetone, HNO3, HF, NaCl, and MO were purchased from National Medicines Chemical Corporation (Beijing, China). All of the chemicals were of analytical grade, and deionized water was used in all experiments.
B. Fabrication of TiO2 film electrode
TiO2 film electrode was obtained by anodic oxidation at room temperature according to the previous method. Reference Liu, Mu, Yang, Peng, Shen, Wang, Deng, Zhang and Zhang48 Prior to anodization, the Ti foils were cleaned by ethanol, acetone, and water in ultrasonic bath for 15 min, respectively, then chemically etched in mixed solution of HF/HNO3/H2O (1:4:5 v/v/v) for 30 s, then rinsed with deionized water, and dried in ambient condition. Anodic TiO2 film was fabricated in a two-electrode electrochemical cell, with a Ti foil as the anode and a graphite rod as the cathode. An ethylene glycol (90 vol%) solution with additions of 0.6 wt% [EPy][BF4] and 10 vol% H2O was used as the electrolyte. Anodization was carried out with a constant voltage of 60 V for 20 min. After anodization, the sample was rinsed with deionized water, and then dried in an oven. To obtain the crystalline phase, the as-anodized sample was thermally treated at 500 °C in air for 2 h.
C. Fabrication of Pt-A-TiO2 film electrode
The TiO2 film first suffered a brief “activation” treatment (4 V for 10 min) in the anodization electrolyte mentioned above. Then the TiO2 film deposited with Pt nanoparticles was obtained by cathodic electrodeposition of Pt at 20 V for 2 h in an aqueous solution consisting of 3.0 mM H2PtCl6 and 0.5 M H2SO4 (denoted as Pt-A-TiO2). The cathodic electrodeposition was carried out in a two-electrode electrochemical cell, with an activated TiO2 film as the cathode and a graphite rod as the anode. For comparison, the TiO2 film directly deposited with Pt nanoparticles without “activation” step was denoted as Pt-TiO2.
D. Characterizations
The morphologies of the as-prepared samples were observed using a field-emission scanning electron microscope (FE-SEM; S-4800, Hitachi Corp., Tokyo, Japan). The x-ray-diffraction (XRD) measurements were carried out by a PANalytical X’pert Pro MPD system (PANalytical, Almelo, The Netherlands) with a Cu Kα radiation source of wave length λ = 0.1541 nm and a scanning rate of 0.0334°/s in the range from 20° to 90°. The chemical states of the elements were evaluated using x-ray photoelectron spectroscopy (XPS; Perkin–Elmer Corporation, Eden Prairie, Minnesota) with MgK anode (1253.6 eV photon energy, 15 kV, 300 W) at a takeoff angle of 45°. The binding energy values were calibrated using the contaminant carbon (C 1s 1/4 284.4 eV) as a reference. Multiplex XPS spectra of Ti 2p, Pt 4f, O 1s, and N 1s were recorded using the band-pass energy of 35.75 eV, which corresponded to an energy resolution of 1.2 eV. Atomic concentrations of these elements were obtained by comparing the peak areas of their spectra. UV–vis–NIR absorption spectra were recorded on a spectrophotometer (TU-1901, Shimadzu Co. Japan) in the range of 200 nm–1000 nm.
E. PEC measurements
The PEC activity of the Pt-A-TiO2 nanofilm was evaluated from hydrogen generation and methyl orange degradation experiments. Hydrogen generation was carried out in a quartz cell with 1.0 M NaOH electrolyte, and 10 vol% of methanol was added as sacrificial reagent. The Pt-A-TiO2 nanofilm was used as the photoanode, and Pt foil was used as the cathode. The two electrodes were separated by a Nafion membrane. A bias potential of 1 V was applied to the two electrodes. A 150 W Xenon lamp served as the light source. Prior to irradiation, the whole system was purged with argon to remove the air completely. The hydrogen gas generated at the Pt electrode was collected in an inverted burette.
The PEC degradation of methylene orange (MO) experiments were performed with 40 mL of MO (20 mg/L, pH = 6.8) under a 150 W Xenon lamp. The as-prepared Pt loading TiO2 film was used as the working electrode and a clean Ti foil was used as the counter electrode. A bias potential of 2 V was applied to the two electrodes. 0.5 M of NaCl solution was chosen as the supporting electrolyte. 1 mL of MO solution was taken out per 5 min to measure the absorbance at 464 nm using a UV–vis spectrophotometer (UV 3000, China). The MO decolorization efficiency (D%) and the first-order rate constant (K) were calculated as follows:
 $$D\% = {{{C_0} - {C_t}} \over {{C_0}}} \times 100\% \quad .$$
 $$\ln \left( {{{{C_0}} \over {{C_t}}}} \right) = Kt\quad .$$
Here, C 0 is the initial absorbance of MO and C t is the absorbance after reaction time t.
III. RESULTS AND DISCUSSION
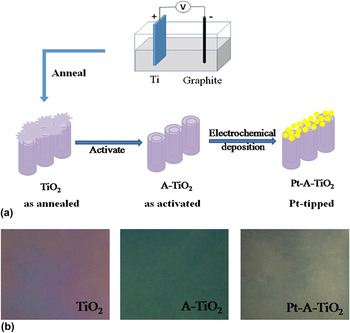
Figure 1(a) showed a schematic representation of the fabrication procedure of TiO2 nanotubes tipped with Pt nanoparticles (labeled as Pt-A-TiO2). Specifically, it involved with the following steps: (i) preparation of TiO2 nanotube arrays via anodic oxidation followed by annealing of TiO2 nanotube arrays in air (labeled as TiO2); (ii) “activation” (at an anodic voltage of 4 V for 10 min in the same anodization electrolyte) to get open-ended double-wall nanotubes (labeled as A-TiO2); and (iii) electrochemical deposition of Pt nanoparticles on the open-ends of TiO2 nanotubes. As shown in Fig. 1(b), distinctly different colors were observed for TiO2 nanotubes (purple), A-TiO2 nanotubes (deep green), and Pt-A-TiO2 (dark gray), respectively.
(a) A schematic illustration of the preparation of Pt-A-TiO2 film. (b) Photographs of the TiO2 films after different steps: “as-annealed” (Step 1); “as-activated” (Step 2) “Pt-tipped” (Step 3) (the size of the sample is 40 × 50 mm).

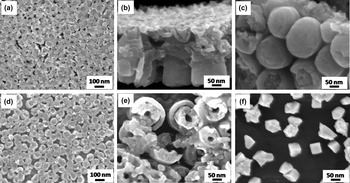
The pristine TiO2 nanotubes were fabricated by anodizing a Ti foil in an ionic liquids [EPy][BF4]-based electrolyte (typically, 0.6 wt% [EPy][BF4]–10 vol% H2O–ethylene glycol solution) at 60 V for 20 min, followed by an annealing process at 500 °C in air for 2 h. From the top view in Fig. 2(a), the TiO2 nanotubes formed a porous film on Ti foil. Figure 2(b) displayed a cross-section scanning electron microscopy (SEM) image of the porous film where the upper layer was consisted of irregularly fragments, commonly called “nanograss”, Reference Altomare, Pozzi, Allieta, Bettini and Selli49,Reference Li, Chen, Tsang, Li, Ran, Lee, Nie, Zheng, Hung, Lu, Pan and Li50 and the lower layer was composed of well self-assembled and vertically aligned nanotubes, which were clearly observed from the bottom view of the film shown in Fig. 2(c). After the “activation” treatment, the “nanograss” on top of nanotubes was removed [Fig. 2(d)], and the layer was composed of double-wall nanotubes [Fig. 2(e)]. As shown in Fig. 2(f), in the Pt-A-TiO2 sample, Pt nanoparticles with the average particle size of 100 nm were deposited on the open-ends of the TiO2 nanotubes. However, for the sample without activation step, it can be clearly seen that Pt nanoparticles aggregated on the surface (Supplementary Material Fig. S1). This indicated that activation step has a benefit for Pt nanoparticles evenly depositing on the clean surface of TiO2 nanotubes.
(a) SEM images of as-annealed TiO2 film, (b) the side and (c) the bottom views of the TiO2 film. (d) SEM images of as-activated TiO2 (A-TiO2) film and (e) the top view of A-TiO2 film. (f) SEM images of Pt-loaded TiO2 (Pt-A-TiO2).

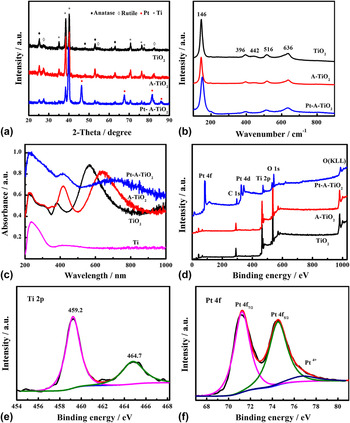
The x-ray diffraction (XRD) patterns of TiO2, A-TiO2, and Pt-A-TiO2 were shown in Fig. 3(a). The diffraction peak positions of TiO2 and A-TiO2 matched well with those of anatase TiO2 (JCPDS no. 21−1272), rutile TiO2 (JCPDS no. 21−1276), and the Ti substrate (JCPDS no. 44−1294). Both the TiO2 and A-TiO2 had mixed crystal structures of anatase and rutile. For Pt-A-TiO2, additional peaks from Pt nanoparticles were observed at 39.7°, 46.3°, 67.43°, 81.39°, and 85.75° (JCPDS no. 04−0802). Figure 3(b) showed the Raman spectra of all the samples. Typical and strong vibrational peaks of anatase phase were observed at 144 cm−1 (Eg), 197 cm−1 (Eg), 396 cm−1 (B1g), 516 cm−1 (A1g + B1g), 636 cm−1 (Eg), and only one small peak for the rutile phase was observed at 442 cm−1 (Eg). Reference Chen, Liu, Yu and Mao51–Reference Zhang, Harris, Wallenmeyer, Murowchick and Chen53 The UV–Vis absorption spectra of the samples between 200 and 1000 nm were shown in Fig. 3(c) along with that of Ti substrate. All the TiO2 samples displayed substantial absorption with two broad peaks in the visible-light region and one peak in the UV-region. The Pt-A-TiO2 exhibited a higher absorption than that of TiO2 and A-TiO2. The Ti substrate displayed a very weak absorption in the visible-light region, but a large absorption in the UV-region, which were seen in all the other samples. It is known that TiO2 powders do not have apparent absorption in the visible and near-infrared regions (Supplementary Material Fig. S2). The two peaks in the visible-light region of the TiO2 samples seen from the interference Reference Mun, Alvarez, Choi and Sailor54–Reference Zheng, Cheng, Liang, Shu, Tsang, Li, Lee and Li56 depend on the thickness, dielectric constant, porosity, and the photon penetration depth of the TiO2 nanotubes and the Ti substrate. Reference Chiarello, Zuliani, Ceresoli, Martinazzo and Selli14
(a) XRD patterns, (b) Raman spectra of TiO2, A-TiO2, and Pt-A-TiO2, (c) UV–Vis absorption of Ti foil, TiO2, and Pt-A-TiO2 film, (d) survey XPS spectra of TiO2, A-TiO2, and Pt-A-TiO2, (e) Ti 2p and (f) Pt 4f core-level XPS spectrum of Pt-A-TiO2.

The x-ray photoelectron spectroscopy (XPS) survey spectra of TiO2, A-TiO2, and Pt-A-TiO2 were shown in Fig. 3(d). Ti, O, C, and N elements were observed for TiO2 and A-TiO2, and additional Pt signal was observed for the Pt-A-TiO2. The atomic ratio of Ti:O was about 1:2, with the atomic composition of TiO2. The Ti 2p core-level spectrum of the Pt-A-TiO2 in Fig. 3(e) showed peaks at 459.2 and 464.7 eV from the Ti 2p 3/2 and 2p 1/2 of the Ti4+ in the TiO2. The Pt 4f XPS spectrum in Fig. 3(f) had peaks at 71.2 and 74.5 eV from the 4f 7/2 and 4f 5/2 of the Pt0 metallic nanoparticles, Reference Yu, Qi and Jaroniec57 with small peak at 76.8 eV from Pt4+. The results indicated that H2PtCl6 was mainly reduced into metallic Pt and deposited on the surface of TiO2. For photocatalytic hydrogen generation reactions, metallic Pt can act as reactive sites and provide much more active sites than other states such as PtO and PtO2. Reference Zhang, Chen, Zhang, Gao, Jin, Guan and Li58 The O 1s core-level XPS spectrum of Pt-A-TiO2 nanofilm was shown in Supplementary Material Fig. S3, the peak located at 530.6 eV could be assigned to the lattice oxygen of TiO2. Another peak at 532.3 eV could be attributed to a basic hydroxyl group, which was reported to be at about 1.5–1.8 eV higher than the lattice oxygen. The detected N elements at 397.7 and 399.8 eV were ascribed to nitrate species derived from the [EPy][BF4] in the anodization process Reference Chen and Burda59 and the interstitial nitrogen atoms doped in the TiO2 lattice as a Ti–O–N bond, Reference Romero-Gómez, Rico, Borrás, Barranco, Espinós, Cotrino and González-Elipe60 respectively (Supplementary Material Fig. S4). The C signal was likely from the residual organic carbons or adventitious carbon contaminants in the XPS instrument.
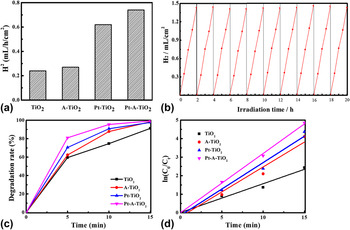
The PEC activity was evaluated by hydrogen generation under simulated sunlight irradiation with a bias of 1 V. As shown in Fig. 4(a), the TiO2 film had a very low hydrogen generation rate of 0.24 mL/h/cm2 in the test time of 6 h. A-TiO2 had a little better hydrogen generation rate (0.27 mL/h/cm2) than TiO2 film. Compared with TiO2 and A-TiO2 samples, the Pt-TiO2 film showed a relatively high hydrogen generation rate (0.62 mL/h/cm2), but lower than that of Pt-A-TiO2 film. The Pt-A-TiO2 film exhibited a hydrogen generation rate of 0.74 mL/h/cm2, which was three times of the pure TiO2. The results indicated that uniform deposition of Pt nanoparticles on the clean tube ends of the TiO2 nanotubes was important for improving the photogenerated electron transportation. To investigate the stability of the Pt-A-TiO2 film, ten consecutive cycles of the PEC hydrogen generation reaction were performed [Fig. 4(b)]. The amount of generated hydrogen in each cycle increased steadily with the irradiation time and the photocatalytic activity was almost constant during these cycle tests. The persistently high hydrogen generation capability was likely due to that the deposition of Pt nanoparticles on the clear surface of TiO2 induced efficient photogenerated electron transportation.
(a) The hydrogen generation rates of TiO2, A-TiO2, Pt-TiO2, and Pt-A-TiO2, (b) the cycling tests of photoelectrocatalytic hydrogen generation of Pt-A-TiO2 under simulated sunlight irradiation, (c) the photoelectrocatalytic degradation rates of the MO solution with TiO2, A-TiO2, Pt-TiO2, and Pt-A-TiO2 as the catalysts, (d) ln(C 0/C t ) as a function of irradiation time in the degradation of MO with TiO2, A-TiO2, Pt-TiO2, and Pt-A-TiO2.

The PEC degradation of MO solution was also carried out with a bias of 2 V under simulated sunlight for 15 min to evaluate their environmental applications. As shown in Fig. 4(c), the Pt-A-TiO2 exhibited the best photoactivity, reaching a degradation ratio of 80% after 5 min and 100% after 15 min. And the degradation efficiency of A-TiO2 film was higher than TiO2. To eliminate the influence of MO self-decomposition under the light and the adsorption of MO by photocatalyst, the MO degradation processes with light in the absence of any photocatalyst as well as the MO with photocatalyst in the darkness were measured (Supplementary Material Fig. S5). The degradation of MO solution in those two processes was almost negligible during 15 min irradiation. The degradation process was well fitted with a first-order kinetic model as shown in Fig. 4(d). The k values were 0.16, 0.27, 0.29, and 0.32 min−1 for TiO2, A-TiO2, Pt-TiO2, and Pt-A-TiO2, respectively. The enhancement in degradation rate of A-TiO2 was explained with the opening of TiO2 nanotubes after the “activation step”, which provided easy access for pollutant to the inner surface of TiO2 nanotubes. Efficiency of TiO2 was improved with deposition of Pt and with the formation of a Schottky barrier at the interface of TiO2 and Pt nanoparticles, resulting in an efficient channeling of excited conduction band electrons from the TiO2 to the newly formed interface. As a result, the electron density in TiO2 decreases which prevents the electron–hole pair recombination. Reference Ismail and Bahnemann61 The difference of the PEC activity between Pt-TiO2 and Pt-A-TiO2 was ascribed to effective and selective deposition of Pt nanoparticles on the original or the open-ends of the TiO2 nanotubes. For Pt-A-TiO2 film, Pt nanoparticles were uniformly deposited on the clean surface of TiO2 nanotubes, which was better for the efficient separation of photo-electrons and holes, and thus improving the photocatalytic activity. In contrast, randomly deposited Pt nanoparticles on the original surface of the TiO2 would cause unwanted charge recombination, and the large aggregation of Pt nanoparticles may also block the absorption of light by TiO2. So the Pt-A-TiO2 had an enhanced activity than Pt-TiO2. The results further confirmed that “activation step” before electrochemical deposition was crucial to the improved photocatalytic performance of the Pt-A-TiO2.
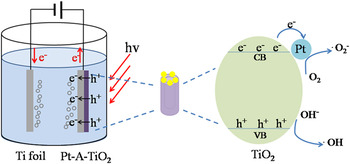
A schematic illustration of the electron transition and PEC process of Pt-A-TiO2 was shown in Fig. 5. When photons with energies larger than the band gap were absorbed by Pt-A-TiO2, electrons were excited from the valence band to the conduction band, leaving holes in the valence band. Pt nanoparticles coated on the TiO2 nanotubes were acted as electron sinks promoting the reduction of O2 on the surface. At the same time, extra photo-electrons were continuously transferred to the counter electrode under the electric field, which greatly reduced the recombination rate of photo-electrons-holes, and enhanced the photocatalytic activity. The typical photocatalytic process can be shown as in the following equations. Reference Ismail and Bahnemann61
 $${\rm{Ti}}{{\rm{O}}_2} + h\nu \to {\rm{Ti}}{{\rm{O}}_2}\left( {{{\rm{e}}^ - } + {{\rm{h}}^ + }} \right)\quad .$$
 $${\rm{Ti}}{{\rm{O}}_2}\left( {\rm{e}} \right) + {\rm{Pt}} \to {\rm{Ti}}{{\rm{O}}_2} - {\rm{Pt}}\left( {\rm{e}} \right)\quad .$$
 $${\rm{Ti}}{{\rm{O}}_2} - {\rm{Pt}}\left( {\rm{e}} \right) + {{\rm{O}}_2} \to {\rm{Ti}}{{\rm{O}}_2} - {\rm{Pt}} + \cdot {{\rm{O}}_{\rm{2}}}\quad .$$
 $$\cdot {{\rm{O}}_{\rm{2}}} + {{\rm{H}}_2}{\rm{O}} \to {\rm{O}}{{\rm{H}}^ - } + \cdot {\rm{H}}{{\rm{O}}_2}\quad .$$
 $$2 \cdot {\rm{H}}{{\rm{O}}_2} \to {{\rm{H}}_2}{{\rm{O}}_2} + {{\rm{O}}_2}\quad .$$
 $${{\rm{H}}_2}{{\rm{O}}_2} + {{\rm{h}}^ + } \to \cdot {\rm{OH}} + {\rm{O}}{{\rm{H}}^ - }\quad .$$
 $${\rm{O}}{{\rm{H}}^ - } + {{\rm{h}}^ + } \to \cdot {\rm{OH}}\quad {\rm{.}}$$
 $$\cdot {\rm{OH}}\left( { \cdot \mathop {{{\rm{O}}_{\rm{2}}}}\nolimits^ - , \cdot {\rm{H}}{{\rm{O}}_2}} \right) + {\rm{MO}} \to {\rm{C}}{{\rm{O}}_2} + {{\rm{H}}_2}{\rm{O}}\quad {\rm{.}}$$
A schematic illustration of the proposed mechanism to illustrate the enhanced photoelectrocatalytic activity of Pt-A-TiO2.

IV. CONCLUSIONS
In conclusion, anodized TiO2 nanotubes tipped with Pt nanoparticles were fabricated by introducing the “activation step” before the electrochemical deposition of Pt nanoparticles. In this case, the Pt nanoparticles were uniformly deposited on the exposed tube ends of the TiO2 nanotubes. The “activation step” played a key role in achieving a clean surface of the TiO2 nanotubes, thus ensuring the uniform growth of Pt nanoparticles and the enhanced PEC activity. The hydrogen generation rate of Pt-A-TiO2 film (0.74 mL/h/cm2) was three times of the pure TiO2 film (0.24 mL/h/cm2) under simulated sunlight irradiation. The film also exhibited high stability for methyl orange degradation. The improved PEC performance could be attributed to the efficient separation of photo-electrons and holes after Pt loading on the surface of TiO2 nanotube arrays.
Supplementary Material
To view supplementary material for this article, please visit https://doi.org/10.1557/jmr.2016.462.
ACKNOWLEDGMENT
This work was supported by Program for Changjiang Scholars and Innovative Research Team in University (IRT13083) from Ministry of Education of The People’s Republic of China.