INTRODUCTION
Rural depopulation affects many regions of the world, as people move to cities, driven by social, economic and ecological factors (Grau & Aide Reference Grau and Aide2007; Rey Benayas et al. Reference Rey Benayas, Martins, Nicolau and Schulz2007; Robson & Berkes Reference Robson and Berkes2011). Reductions in human population density and associated changes in sociodemographic processes can affect biodiversity and ecosystems in several ways (MacDonald et al. Reference MacDonald, Crabtree, Wiesinger, Dax, Stamou, Fleury, Gutiérrez Lazpita and Gibon2000; Grau & Aide Reference Grau and Aide2007; Rey Benayas et al. Reference Rey Benayas, Martins, Nicolau and Schulz2007; Parry et al. Reference Parry, Peres, Day and Amaral2010; Blanco-Fontao et al. Reference Blanco-Fontao, Quevedo and Obeso2011; Navarro & Pereira Reference Navarro and Pereira2012). In several studies, the abandonment of livestock and decline of husbandry practices resulted in habitat loss and degradation for native herbivores and birds (Blanco-Fontao et al. Reference Blanco-Fontao, Quevedo and Obeso2011; Acebes et al. Reference Acebes, Traba and Malo2012; Cocca et al. Reference Cocca, Sturaro, Gallo and Ramazin2012). For example, abandonment of a desert ecosystem in South America led feral donkeys to overexploit vegetation and outcompete native herbivores (Acebes et al. Reference Acebes, Traba and Malo2012). Conversely, rural depopulation may be accompanied by abandonment of agricultural practices, which may be beneficial for wildlife if native habitats recover from human-induced transformations (Navarro & Pereira Reference Navarro and Pereira2012). For wild populations that are difficult to conserve in human-dominated landscapes, such as large carnivores (Ripple et al. Reference Ripple, Estes, Beschta, Wilmers, Ritchie, Hebblewhite, Berger, Elmhagen, Letnic and Nelson2014), rural depopulation seems to offer carnivores an opportunity to recolonize historic range.
The consequences of rural human depopulation may be beneficial or detrimental to carnivores. Many researchers suggest that rural depopulation allows carnivores to recolonize landscapes with more prey and fewer humans (Knight Reference Knight2003; Enserink & Vogel Reference Enserink and Vogel2006; Navarro & Pereira Reference Navarro and Pereira2012; Lescureux & Linnell Reference Lescureux and Linnell2013). Traditionally, people retaliate or kill carnivores pre-emptively (Treves & Naughton-Treves Reference Treves and Naughton-Treves1999; Goodrich et al. Reference Goodrich, Kerley, Smirnov, Miquelle, McDonald, Quigley, Hornocker and McDonald2008; Sánchez-Mercado et al. Reference Sánchez-Mercado, Ferrer-Paris, Yerena, García-Rangel and Rodríguez-Clark2008; Liberg et al. Reference Liberg, Chapron, Wabakken, Pedersen, Hobbs and Sand2011; Marchini & Macdonald Reference Marchini and Macdonald2012). Humans are responsible for the majority of large carnivore mortality worldwide, thus depopulation may reduce the risk to carnivores (Woodroffe & Ginsberg Reference Woodroffe and Ginsberg1998; Wang & Macdonald Reference Wang and Macdonald2006). However, if carnivores recolonize depopulated areas to prey on remaining livestock or otherwise use human spaces, the remaining humans may increase retaliation levels (Knight Reference Knight2003; Navarro & Pereira Reference Navarro and Pereira2012; Lescureux & Linnell Reference Lescureux and Linnell2013; Takahata et al. Reference Takahata, Nielsen, Takii and Izumiyama2014). Governments may reallocate resources to rural areas (Knight Reference Knight2003; Lescureux & Linnell Reference Lescureux and Linnell2013), which can result in high rates of pre-emptive and retaliatory killing of carnivores (Bergstrom et al. Reference Bergstrom, Arias, Davidson, Ferguson, Randa and Sheffield2014). Private reinvestment or government subsidies for rural areas may lead livestock producers to hire herders who, in turn, may alter patterns of herd protection or retaliation against carnivores (Mertens & Promberger Reference Mertens and Promberger2001; Frank et al. Reference Frank, Woodroffe, Ogada, Woodroffe, Thirgood and Rabinowitz2005). Meanwhile, communities with less available labour or lacking outside support may abandon traditional livestock practices such as continuous supervision of herds or maintenance of barriers and deterrents (Knight Reference Knight2003; Ogada et al. Reference Ogada, Woodroffe, Oguge and Frank2003; Woodroffe et al. Reference Woodroffe, Frank, Lindsey, Ranah and Romañach2007; López-Bao et al. Reference López-Bao, Sazatornil, Llaneza and Rodríguez2013). In short, depopulation can lead to diverse changes in husbandry that affect protections for domestic animals. Therefore, predicting the outcomes for carnivores and people in a particular rural area requires assessment of human responses to changing conditions, as well as those of the carnivores. Human responses to carnivores are guided by more than economic costs (Treves & Bruskotter Reference Treves and Bruskotter2014).
Even if measurable losses of property caused by carnivore predation on livestock do not change in the wake of rural depopulation, perceptions of risk may change (Treves et al. Reference Treves, Wallace, Naughton-Treves and Morales2006). Many studies show that social changes, such as policy shifts and demographic transitions, can affect perceptions of risk. For example hazard assessments, preferences for interventions, or responses to wildlife can be predicted by respondents’ wealth or social capital, trust in government, and relationships with power elites (Hill Reference Hill1998; Archabald & Naughton-Treves Reference Archabald and Naughton-Treves2001; Dickman et al. Reference Dickman, Marchini, Manfredo, Macdonald and Willis2013; Bruskotter & Wilson Reference Bruskotter and Wilson2014). Perceptions of risk are also shaped by cultural symbols attached to carnivores and outside actors, both positive and negative, in addition to real and perceived threats to property, income, and human safety (Knight Reference Knight and Knight2000; Thirgood et al. Reference Thirgood, Woodroffe, Rabinowitz, Woodroffe, Thirgood and Rabinowitz2005; Holmern et al. Reference Holmern, Nyahongo and Røskaft2007; Dickman et al. Reference Dickman, Marchini, Manfredo, Macdonald and Willis2013). Therefore, fear of carnivores, and cultural symbolism (both positive and negative) attached to carnivores and government alike, are as important as measurable losses in understanding the consequences of rural depopulation.
We measured perceived risks and self-reported losses relating to pumas (Puma concolor) in the high Andean Plateau (hereafter ‘altiplano’) of Chile, an area with several abandoned villages and low population density (Caqueo-Urízar et al. Reference Caqueo-Urízar, Urzúa and De Munter2014). We tested contrasting hypotheses about the effects of rural depopulation on perceived risk and self-reported losses blamed on pumas, in relation to changing demographics and husbandry practices in the region.
The altiplano of Chile hosts the indigenous Aymara people, who engage mainly in crop and livestock production (Gundermann Reference Gundermann1984; Moreno Reference Moreno2011). They experienced three decades of migration to coastal urban areas, in search of economic opportunities (Grebe Reference Grebe1986; Gundermann & González Reference Gundermann and González2008; Fernández & Salinas Reference Fernández and Salinas2012; Caqueo-Urízar et al. Reference Caqueo-Urízar, Urzúa and De Munter2014). Approximately 4.8% of the 2008 population remained in the altiplano region during our study (INE [Instituto Nacional de Estadística] 2008; Caqueo-Urízar et al. Reference Caqueo-Urízar, Urzúa and De Munter2014). Aymara migrants maintained connections to their native communities during sporadic visits, traditional holidays, and by using multiple residences (Moreno Reference Moreno2011; Caqueo-Urízar et al. Reference Caqueo-Urízar, Urzúa and De Munter2014), nevertheless, depopulation produced changes in their traditional practices (Zapata Reference Zapata2007; Caqueo-Urízar et al. Reference Caqueo-Urízar, Urzúa and De Munter2014), and specifically in their agricultural and livestock practices (Grebe Reference Grebe1986; Romo Reference Romo1998; Gavilán Reference Gavilán2002; Gundermann & González Reference Gundermann and González2008; Moreno Reference Moreno2011). Government agencies addressing agricultural productivity have also been viewed with resentment and distrust by the ethnic minority Aymara (V. Malinarich, regional manager of the Renewable Natural Resources Unit of the Agriculture and Livestock Service [Servicio Agrícola y Ganadero, henceforth SAG], personal communication 2010; O. Ohrens, personal observation 2010). Women (18–80 years) and children of both sexes (5–18 years) generally undertook traditional livestock husbandry, however households showed flexibility as conditions required, so men also played roles when livestock herding required supplementary supervision and maintenance (Gundermann Reference Gundermann1984, Reference Gundermann1998; Gavilán Reference Gavilán2002). Depopulation sometimes undermined the traditional divisions of labour in livestock husbandry, because of emigration, intermittent presence of employable adults, declining birth rates in rural areas, and aging household members (Grebe Reference Grebe1986; Gavilán Reference Gavilán2002; Moreno Reference Moreno2011). In the Tarapacá region, there have been increased reports of pumas preying on livestock (Moreno Reference Moreno2011). We surveyed Aymara livestock owners about the social organization around livestock husbandry practices to assess whether sociodemographic changes associated with rural depopulation affected livestock protections. We also studied perceptions of pumas, an emblematic top predator of the Andean mountains (Franklin et al. Reference Franklin, Johnson, Sarno and Iriarte1999; Walker & Novaro Reference Walker, Novaro, Hornocker and Negri2010), which is categorized as threatened in Chile (Laundré & Hernández Reference Laundré, Hernández, Hornocker and Negri2010; SAG 2011). As with other large carnivores, pumas are thought to regulate ecosystems by influencing prey and smaller predator behaviours and population densities (Ripple & Beschta Reference Ripple and Beschta2006; Estes et al. Reference Estes, Terborgh, Brashares, Power, Berger, Bond, Carpenter, Essington, Holt and Jackson2011; Ripple et al. Reference Ripple, Estes, Beschta, Wilmers, Ritchie, Hebblewhite, Berger, Elmhagen, Letnic and Nelson2014). Over the last decade, there has been an increase in various forms of puma-human conflict nationwide, which mainly include puma attacks on livestock (Cattan et al. Reference Cattan, Iriarte, Johnson and Villalobos2006, Reference Cattan, Acosta, Cundhill, Correa, Cortés and Rojo2010; Bonacic et al. Reference Bonacic, Ibarra, Amar, Sanhueza, Guarda, Gálvez and Murphy2007; Iriarte Reference Iriarte2010, Reference Iriarte2011, Reference Iriarte2012). In the northern Arica-Parinacota region of the Chilean altiplano, residents have recently reported an increase in livestock predation by pumas (Cattan et al. Reference Cattan, Iriarte, Johnson and Villalobos2006; Amar Reference Amar2008; Villalobos & Iriarte Reference Villalobos and Iriarte2014). Both here and in Tarapacá (Moreno Reference Moreno2011), depopulation has been implicated in the change, through the abandonment of traditional livestock husbandry practices. We tested that hypothesis by analysing whether sociodemographic variables associated with depopulation of Tarapacá were associated with perceptions of risk and self-reported losses of livestock blamed on pumas. This is the first quantitative study of the relationship between rural depopulation and puma-human conflict. We make recommendations for puma and livestock management, and discuss the implications of our work for large carnivore conservation in other areas experiencing human depopulation.
METHODS
Study area and respondents
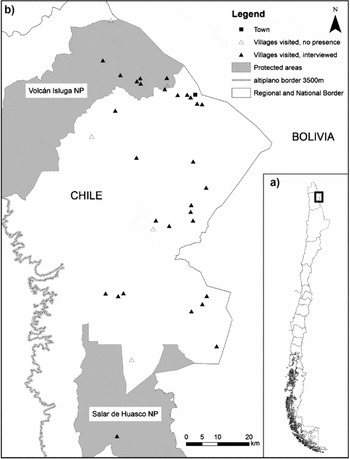
The study area covers two districts of the Tarapacá region (Colchane and Pica) in the altiplano of Chile, c. 6500 km2 in area, at an altitude of 3800–5000 m, and about 250 km from the regional capital, Iquique (Fig. 1). Human population densities in the study area are extremely low (range 0.01–0.4 individuals km–2; INE 2002; Fernández & Salinas Reference Fernández and Salinas2012). It has a cold desert climate, with a temperature range of –10 °C to 12 °C, and an annual average rainfall of 50–250 mm, concentrated between December and March (Gundermann Reference Gundermann1984; Moreno Reference Moreno2011). Montane grasslands, shrublands and salt flats characterize the area, which also supports Andean meadows or wetlands (bofedales), where most of the biodiversity is found (Gundermann Reference Gundermann1984; Villagrán & Castro Reference Villagrán and Castro1997).
(a) Tarapacá region location in Chile (lower right). (b) Diagrammatic map of the Chilean altiplano of the Tarapacá region showing location of the town of Colchane, villages, and the national parks (NP). Villages with no respondents labelled no presence.

The Aymara live mainly on agriculture and livestock, by raising quinoa, potatoes, and the domestic South American camelids, Lama glama (llama) and Vicugna pacos (alpaca), and less frequently Ovis aries (sheep) (Gundermann Reference Gundermann1984; Romo Reference Romo1998; Gavilán Reference Gavilán2002; Moreno Reference Moreno2011). Aymara villages were developed in areas suitable for livestock grazing near bofedales (Gundermann Reference Gundermann1984; Romo Reference Romo1998). Despite communal property, the Aymara people organize herding activities in the nuclear family, dividing labour according to the gender, life stage, and members available (Gundermann Reference Gundermann1984, Reference Gundermann1998; Romo Reference Romo1998; Gavilán Reference Gavilán2002). Traditionally, livestock management was based on the available forage resources. Different habitats made animal movements possible seasonally and in response to unpredictable changes in the environment. For example, bofedales and montane shrubland-grassland habitats provided forage at different times and places. Aymara coped with environmental variation in part by taking advantage of the different adaptations of the three common livestock types. From around September to March (the rainy season), llamas and alpacas usually grazed in bofedales. However, low forage productivity prompted owners to move livestock to the montane shrubland. There they were monitored closely and confined in corrals at night, to prevent damage to crops cultivated in the same habitat. Livestock were also moved to montane grassland during shortages of forage (from around April to September), where they were monitored and gathered in corrals every 5 to 15 days. Sheep were supervised and herded day and night owing to their susceptibility to harsh conditions, and grazed most of the year in bofedales. In case of low forage productivity, sheep were managed as explained previously for llamas and alpacas (Gundermann Reference Gundermann1984).
Sample design
Between January and July 2013, we administered a total of 61 questionnaires (see Supplementary material) as structured interviews with individual livestock owners in Tarapacá. We tried to interview every livestock owner in this region and covered 29 of the c. 35 (83%) villages (Fig. 1). This is approximate because of lack of information about the total number of villages present in the region and the partial or total abandonment of some villages. Lack of reliable postal or mobile phone coverage restricted our ability to select respondents randomly or locate selected respondents, and lack of an up-to-date census (INE 2002) made it impossible to verify whether a sample was demographically representative. Long distances between villages, and harsh topography also limited our ability to revisit villages to find livestock owners we might have missed. Although we tried to interview every livestock owner, ultimately we chose respondents haphazardly by encounter, and a few we found following directions from another respondent. Thus, a selection bias may have resulted because we missed absentee and remote livestock owners. We attempted to interview the herders hired by some of the absentee owners; however, we were informed that some were Bolivians present in Chile illegally, which probably contributed to our difficulties in finding them.
We parked our vehicle near the outer limit of villages and approached individuals on foot in the fields or in their households. We asked them about their willingness to participate in a project about the interaction between livestock and wildlife, conducted by the Pontifícia Universidad Católica de Chile (henceforth PUC) and funded by SAG, Tarapacá. Respondents were interviewed alone; we explained to them that the study required individual and independent responses. None of the individuals we approached refused to participate in our study. Respondents welcomed the study team and displayed no reluctance to answer questions. As the conversations were in fluent Spanish on both sides, we would have detected if responses were artificial or inconsistent with other respondents within the same villages.
Survey method
We used a structured questionnaire written in basic Spanish (see Supplementary material), explaining details to respondents where needed. The instrument was based on a pilot visit to livestock owners (following Newing et al. Reference Newing, Eagle, Puri and Watson2011), previous studies in the region, and the literature; the final questionnaire was approved by the Institutional Review Board of the University of Wisconsin-Madison (approval number: SE 2012-0958). We tested and reviewed the questionnaire with nine respondents in July 2012. The main topics covered by the final questionnaire were: (1) sociodemographics; (2) perceptions of wildlife, risk, and self-reported losses; (3) livestock husbandry; and (4) perceptions of different methods used to protect livestock (Rassmussen Reference Rassmussen1999; Conforti & De Azevedo Reference Conforti and De Azevedo2003; Zimmermann et al. Reference Zimmermann, Walpole and Leader-Williams2005; Holmern et al. Reference Holmern, Nyahongo and Røskaft2007; Murphy & Macdonald Reference Murphy, Macdonald, Macdonald and Loveridge2010).
Survey questions concerned the respondent's age, the number of years they had lived there, household size, seasonal residency, and whether livestock was the major source of income (Table 1). We recorded gender, date, and assigned each respondent a unique ID to preserve confidentiality.
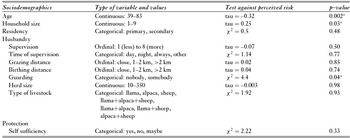
Sociodemographic variables associated with rural depopulation tested against ‘perceived risk’ (where +1 = increased, 0 = no change, –1 = diminished; ordinal variable) of puma attack on livestock since 2008 (n = 58 Aymara respondents who reported puma losses). *Significant p-value.

We asked respondents to estimate the distances from their household to the areas they used for livestock grazing and also to the areas used for the birthing season, when and how frequently they supervised their animals, and who guarded or herded their animals (Table 1). We also asked if anyone else supervised the animals when respondents were unable or absent. We recorded type of livestock within herds as one type or several (Table 1).
Respondents were asked to rank sources of injury to livestock (predation, lack of pasture, robberies, disease, and weather conditions) from most to least severe, and to rank wildlife species in the area from most to least problematic; the ranking was facilitated by using cards with photos of the species that they themselves had listed (following Newing et al. Reference Newing, Eagle, Puri and Watson2011). We measured these perceptions of wildlife, including pumas, as well as self-reported losses of livestock. We asked respondents to estimate the number of livestock they had lost to predators since 2012 by predator, trends in injury and loss over the previous five years by predator (namely whether losses had increased, diminished, or remained unchanged), and to indicate whether they had observed seasonal loss patterns.
We asked respondents to rank livestock protection methods in order of preference for use in their herds or areas. We asked about self-sufficiency (Table 1), which we explained as their ability to apply those same methods by themselves.
Data analysis
We used univariate non-parametric tests in R version 3.0.1 for Mac OS X to relate the response (perceived risks and self-reported losses from pumas) and independent variables (sociodemographics and husbandry) (Tables 1 and 2). We used Wilcoxon signed rank tests to compare rankings of alternative wildlife species or mitigation methods in pairs (Nummi & Pellikka Reference Nummi and Pellikka2012). We analysed relationships between categorical (for example guarding) and ordinal (such as perceived risk) variables using Kruskal-Wallis tests. For associations between continuous (such as age or self-reported losses) and/or ordinal (such as perceived risk) variables, we used the Kendall-Tau correlation test, which corrects for ties between ranks. When we asked for details about puma predation, our sample size declined from n = 61 respondents to n = 58 because three respondents had never experienced puma predation. Two further respondents reported no puma predation since 2012, but answered questions about puma losses prior to 2012.
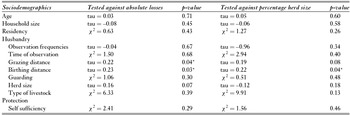
Sociodemographic variables (see Table 1) associated with rural depopulation tested against self-reported losses of livestock since 2012 measured as absolute losses and percentage of herd size (continuous variables). Sample size declined from n = 61 respondents to n = 58 for the self sufficiency variable, as the question concerned mitigation of puma predation and three respondents did not report any puma predation in their lifetimes. *Significant p-value.

RESULTS
Description of respondents
Forty-four respondents (72% of total) were males, most often encountered outside houses or in fields, their age range being 39–83 years (mean = 63.4; median = 65). Half of the respondents said their household consisted of 2–3 people (mean = 2.8, median = 2); 74% said they had no children living in their household, and 69% stated that it was their primary residence. Livestock production was the primary income for 80% of respondents, with a range of herd sizes from 10 to 350 animals (mean = 112; median = 90); 62% of herd animals were llama, 23% alpaca, and 15% sheep. Larger herds tended to have more types of livestock (Kruskal-Wallis test, χ2 = 20.37, df = 6, p = 0.002). Sixty-two per cent of respondents reported their animals grazed > 2 km from households; 43% indicated their animals gave birth > 2 km from households and 43% gave a distance of 1–2 km from households. Supervision of livestock most commonly occurred twice per day (31%), whereas 21% of respondents stated they supervised their herd continuously. When respondents were absent, 67% reported leaving their livestock with a family member, whereas 13% hired herders, and 11% involved a friend; 18% of respondents used no guard.
Ninety-eight per cent of respondents reporting losses to pumas stated they burned vegetation to threaten pumas, while 68% protected their livestock in corrals, which were mainly intended to facilitate handling livestock, such as marking individuals or castrating juvenile males. More than half (58%) intervened (either by shrub burning, corrals or guarding) only when a puma was observed near their villages, or following a local report of recent predation, tracks or encounters.
Perceptions of pumas and self-reported losses of livestock
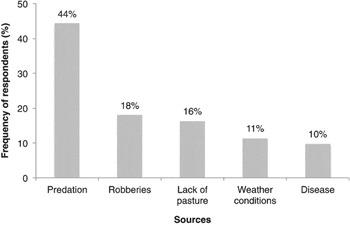
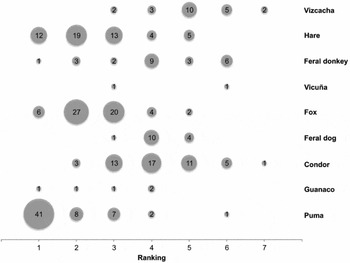
Respondents ranked predation as the top cause of injury, followed by lack of pasture and robberies (n = 61, Wilcoxon signed rank, V = 597.5, p = 0.01; V = 364.5, p ≤ 0.0001; Fig. 2). Respondents ranked the puma as the most problematic species, followed by the fox (Lycalopex culpaeus) and hare (Lepus europaeus) (n = 61, V = 333, p ≤ 0.0001; V = 339, p ≤ 0.001; Fig. 3). The majority (93%) reported puma injured or killed livestock sometime during their lifetime, and all had heard of a neighbour that had lost livestock because of puma. All 58 respondents indicated that their losses to pumas occurred at night, with most (77%) reporting that puma attacks did not show any clear seasonal pattern. The 58 respondents who lost to pumas self-reported a mean of 11 individual livestock lost since 2012 (SD ± 12.5). We estimated losses of livestock averaged 10.8% of herd size (SD ± 12.9%).
Histogram of the frequency with which 61 Aymara respondents ranked common sources of injury to livestock as the worst problems (rank 1 = worst).

Ranking (where 1 = most problematic) of wildlife species in response to the question ‘Which is the species that causes you most problems?’ Bubble size indicates the number of respondents assigning the wildlife species a ranking order on the x-axis. Not all respondents ranked all wildlife as problematic, so sample sizes vary across wildlife species.

Forty-one per cent (n = 58) of the respondents perceived that puma predation on livestock had diminished since 2008, 35% perceived no change, and 24% perceived an increase. There was a net decrease of 17% in perceived risk. We found no relationship between perceived risk and self-reported losses to pumas expressed as absolute numbers of animals, or as a percentage of the respondent's herd size (n = 58, Kendall's rank correlation: tau = –0.12, p = 0.27, and tau = –0.1, p = 0.34, respectively).
Respondents ranked the livestock protection methods from least to most preferred, with barriers and repellents being the most preferred (n = 58, Wilcoxon signed rank, V = 630, p = 0.07, no difference between ranks) followed by financial compensation (V = 563, p = 0.02). When asked whether they needed help from someone (such as a governmental agency, non-governmental organization, the community, or the local police) to implement these methods, 79% stated help would be welcome.
Rural depopulation patterns and perceived risk from pumas
Older respondents were more likely to perceive risk had diminished, whereas younger respondents were more likely to report an increase in predation (Table 1). Respondents with larger household sizes were more likely to perceive the risk had increased (Table 1). Older respondents had smaller household sizes (tau = –0.3, p = 0.004). Those who perceived an increase in risk were more likely to have somebody guarding their livestock than no guard (24% versus 0%, respectively) and those who perceived a decrease in risk were more likely to use no guard than have somebody guard their livestock (12% and 29%, respectively) (Table 1). There was no correlation between respondent age and guard use (χ2 = 0.47, p = 0.49). Respondents with larger households were more likely to use guards for their livestock (χ2 = 4.19, p = 0.04). We found no relationship between perceived risk and any other livestock husbandry variables or self-sufficiency (Table 1).
Rural depopulation patterns and self-reported losses to pumas
We found no significant relationship between sociodemographic variables and the absolute number of livestock reported lost to pumas. However, those whose livestock gave birth further from households reported higher losses both in absolute numbers and as a percentage of herd size. To a lesser extent, the same held for those reporting their herds grazed further from the household (absolute numbers) (Table 2). We found no relationship with any other husbandry variables or self-sufficiency (Table 2).
DISCUSSION
We found no support for the hypothesis that depopulation had increased conflicts with large carnivores. Indeed, in the depopulated altiplano of Tarapacá, many respondents, including older respondents and those with smaller households, reported a decline in the perceived risk of puma predation. In a review of attitudes to crop loss (Naughton-Treves & Treves Reference Naughton-Treves, Treves, Woodroffe, Thirgood and Rabinowitz2005), smaller households and those with older household members were associated with depopulation, as well as lower tolerance for wildlife. Our study was funded because the government agency in charge of agriculture and livestock (SAG) had perceived growing problems with pumas in the area, and respondents reported predation as the biggest cause of mortality for their livestock (Fig. 2), the puma being blamed most often. This is consistent with qualitative studies from further north (Cattan et al. Reference Cattan, Iriarte, Johnson and Villalobos2006; Amar Reference Amar2008) and in neighbouring Argentina (Lucherini & Merino Reference Lucherini and Merino2008; Lucherini et al. Reference Lucherini, Ríos, Manfredi, Merino and Arellano2008). As our study respondents predominantly indicated predation problems were declining, the SAG may have received or perceived more frequent or emotional complaints from a vocal minority that predation was increasing, possibly because altiplano residents felt neglected. Predation risk might be a complaint the Aymara feel they can legitimately air to demand help from the government, whereas other issues may be less clearly arguable (Naughton-Treves Reference Naughton-Treves1997). Alternatively, Aymara complainants may have wanted the SAG to intervene with compensation or lethal management, whereas they understood our research team had no such authority or resources. The vocal minority hypothesis may be valid, because we found that larger households with younger livestock-owners were more likely to perceive that risk had increased in the previous five years and to employ guards for livestock. The notion that influential complaints attract government attention is consistent with findings elsewhere that individuals with more wealth, social capital, or political influence are more likely to complain or seek compensation (Montag Reference Montag2003; Naughton-Treves et al. Reference Naughton-Treves, Grossberg and Treves2003; Nyhus et al. Reference Nyhus, Fisher, Madden and Osofsky2003). Although attending to such complaints might be politically attractive for government agents, it may conflict with other political demands to conserve pumas or save government revenues for the neediest citizens. Without verification of puma attacks on livestock, the accuracy of perceptions, and therefore the incentive for the government to help the marginalized Aymara, cannot be assessed accurately.
Differences between measured and perceived losses can be quite large in the few studies measuring both (Naughton-Treves Reference Naughton-Treves1998; Naughton-Treves et al. Reference Naughton-Treves, Grossberg and Treves2003). If our data are accurate reflections of actual puma threats to property, then we infer that rural depopulation was associated with fewer conflicts between pumas and Aymara in the altiplano. Under typical circumstances, reduced losses should lead to reduced puma killing. Indeed, our respondents preferred barriers and repellents over financial compensation, despite the clear economic need in this impoverished depopulated region, and they preferred both over lethal management. That would lead us to predict improvements in the conservation outlook for the threatened pumas in the Chilean altiplano. However, approval for killing predators, legally or illegally, does not correlate well with economic necessity in other studies (Treves & Bruskotter Reference Treves and Bruskotter2014). Indeed, approval for killing predators is expected to increase when the killing is done by the government, when the predator is on private property, and when social norms or beliefs about the expectations of others reinforce predator-killing as a societal good (Treves & Naughton-Treves Reference Treves, Naughton-Treves, Woodroffe, Thirgood and Rabinowitz2005; St John et al. Reference St John, Keane, Edward-Jones, Jones, Yarnell and Jones2011; Marchini & Macdonald Reference Marchini and Macdonald2012; Treves & Bruskotter Reference Treves and Bruskotter2014). None of those conditions seem to be met currently in the study site, but further research targeted to this question would help.
Human population in the study area has declined by >95% over the last 30 years. We witnessed abandonment of communities at least seasonally, and a decline in traditional agricultural practices and neglected livestock, as reported previously (Grebe Reference Grebe1986; Gundermann & González Reference Gundermann and González2008; Caqueo-Urízar et al. Reference Caqueo-Urízar, Urzúa and De Munter2014). But we also found Aymara responding to changing human demographic patterns by changing methods, such as hiring unrelated guards (non-kin) for livestock, while owners were away (Gundermann Reference Gundermann1984; Gavilán Reference Gavilán2002). Hiring non-kin to take care of animals may compensate for the lack of family members in the area, but may elevate the cost of herd ownership. However, use of guards was only weakly associated with perceived risk from pumas over the last five years and not with self-reported losses to pumas since 2012. Therefore, the use of guards may be a response to stock theft instead, which was the second most highly-ranked cause of lost livestock (Fig. 2). Guards may serve two purposes, preventing theft as well as potential predation (Woodroffe et al. Reference Woodroffe, Frank, Lindsey, Ranah and Romañach2007). It would be difficult to argue that use of non-kin to supervise herds was a response to pumas in the wake of depopulation. Nevertheless, if the government seeks a cost-effective way to verify livestock losses, it may wish to train and equip private guards to investigate dead livestock and collect evidence of predation.
We observed that livestock owners who grazed livestock at a greater average distance from households reported larger losses (Wang & Macdonald Reference Wang and Macdonald2006; and dozens of studies since Robel et al. Reference Robel, Dayton, Henderson, Meduna and Spaeth1981). We also observed that owners who reported their animals gave birth at greater distances from their households reported more puma predation. This supports a widespread observation that livestock is more vulnerable when it is more distant from areas of human supervision or traffic (Mishra Reference Mishra1997; Wang & Macdonald Reference Wang and Macdonald2006; Davie et al. Reference Davie, Murdoch, Lhagvasuren and Reading2014). We infer that pumas prefer to prey on calves, which is consistent with other studies (Michalski et al. Reference Michalski, Bouhlosa, Faria and Peres2006; Palmeira et al. Reference Palmeira, Crashaw, Haddad, Ferraz and Verdade2008). However, as stated previously, an effective verification system might corroborate our inference and support closer livestock supervision, at least during the birthing seasons. Lack of pasture was highly ranked among sources of injury to livestock. Conversations held with respondents suggest movement of livestock to remote grazing areas was a response to poor pasture near households, which is consistent with their traditional practices (Gundermann Reference Gundermann1984). According to Moreno (Reference Moreno2011), overgrazing has contributed to use of increasingly distant grazing areas. Therefore, efforts to reduce predation on livestock should address both supervision and forage quality. Remote grazing areas could explain why herds are not so well supervised. Lack of frequent supervision could lead people to blame a puma that was merely scavenging on animals that died of other causes. However, the effect that this might have on perceptions of pumas is unknown, as in most studies of carnivore-livestock interactions. Regardless, conflict may be accentuated by a tendency to blame the largest carnivore, the focus of research, or emblematic species (Mishra Reference Mishra1997; Treves et al. Reference Treves, Jurewicz, Naughton-Treves, Harper, Mladenoff, Rose, Sickley and Wydeven2002; Ogada et al. Reference Ogada, Woodroffe, Oguge and Frank2003; Treves & Naughton-Treves Reference Treves, Naughton-Treves, Woodroffe, Thirgood and Rabinowitz2005).
Interestingly, hares were perceived to be the second most problematic species, together with foxes. Hares were rated as problematic because of damage to quinoa and other crops, as in neighbouring Perú and Bolivia (Bonino et al. Reference Bonino, Cossios and Menegheti2010). Perhaps problems with hares will maintain or elevate tolerance for predators such as puma and foxes, both of which commonly eat hares (Johnson & Franklin Reference Johnson and Franklin1994; Rau & Jiménez Reference Rau and Jiménez2002). Further studies to understand the many causes of income loss and of attitudes to change towards different wildlife species are desirable.
Our findings that a minority of individuals perceived increasing conflict with pumas has implications for future decision-making on puma-human coexistence in the altiplano. A regional direct intervention does not currently seem justified or necessary. More information is needed before investing government resources. Indeed, direct intervention itself may be counterproductive if it elevates the Aymaras’ perceptions of risk, at least until losses are empirically measured and the causes of complaints are more precisely defined. Managers should focus on the complainants at present, and seek to gain greater understanding of their perceived risks, rather than assuming that puma behaviours or ecosystems have somehow changed. Further interventions to prevent either livestock losses or retaliation against pumas could be targeted more precisely and cost-effectively if verified measured losses indicate they are warranted.
ACKNOWLEDGEMENTS
We thank the Aymara people for their participation and collabouration. This study was conducted under Human Subjects Protocol 2012-0958 from the University of Wisconsin-Madison. We thank the Chilean National Forest Corporation (CONAF), for providing lodging and fieldwork assistance within their areas. A special thank you to Pedro Muñoz and Jorge Leichtle for assistance in the field. Jani Pellikka, Lisa Naughton-Treves and Isabel Rojas offered helpful comments. This research was funded through a public-private partnership between the Agriculture and Livestock Service (SAG) and three mine companies (Teck-Quebrada Blanca; BHP Billiton, Compañia Minera Doña Inés de Collahuasi SCM), Tarapacá region, Chile. We thank Vinko Malinarich (SAG, Tarapacá), for providing helpful information and personal observations. We would also like to thank the government of the USA for a Fulbright Senior Specialist award to Adrian Treves. Omar Ohrens received a postgraduate scholarship from the Comisión Nacional de Investigación Científica y Tecnológica (CONICYT).
Supplementary material
To view supplementary material for this article, please visit http://dx.doi.org/10.1017/S0376892915000259.