Aromatic compounds are important organic raw materials in the petrochemical industry. Aromatics include a variety of components, among which benzene, toluene and xylene (BTX) are considered first-class basic organic raw materials (Yao et al., Reference Yao, Liu, Shi and Wang2015; Zhao et al., Reference Zhao, Yao, Shi and Wang2016; Liu et al., Reference Liu, Liu, Ren, Shi and Meng2017). At present, BTX are mainly obtained through naphtha-reforming and cracking processes. However, the aromatic products produced by these processes contain traces of olefin impurities, which affect product quality and even the safe operation of oil-distillation units; therefore, these traces must be removed. Traditional olefin removal methods include clay adsorption and hydrogenation removal. The white clay needs to be replaced frequently, which affects the environment negatively (Tian et al., Reference Tian, Meng and Shi2013). Hydrogenation catalysts can be divided into precious-metal catalysts and non-precious-metal catalysts. Among them, noble-metal catalysts represented by Pt and Pb have been proven to have high activity, stability and selectivity, but they are expensive and difficult to implement on a large scale. In contrast, non-precious metals represented by Cu and Ni are relatively inexpensive, but their activity and stability are significantly lower than those of precious-metal catalysts (Wang et al., Reference Wang, Meng, Wang, Shi, Hu and Liu2021). It is important, therefore, to explore and find high-efficiency and low-cost catalysts for hydrogenation and the removal of olefins to replace the precious-metal catalysts used in industry.
Cu has been shown to be a good hydrogenation metal, as it can be well-dispersed on a support surface and enhance the activity of hydrogenation catalysts (Álvarez-Rodríguez et al., Reference Álvarez-Rodríguez, Guerrero-Ruiz, Rodríguez-Ramos and Arcoya2008; Kaźmierczak et al., Reference Kaźmierczak, Salisu, Pinel, Besson, Michel and Perret2021; Zhang et al., Reference Zhang, Li, Zhao, Cui, Ye and He2021b). Ru has also been shown to be a highly active and selective metal (Su et al., Reference Su, Lee, Lv, Liu, Tian and Zhao2007; Zheng et al., Reference Zheng, Wang, Li, Liu, Lu, Lin and Zheng2021). Some studies have been conducted on the application of Cu–Ru bimetallic catalysts in hydrogenation reactions (Chen et al., Reference Chen, Yu, Chen, Shen, Wang and Cao2016; Lu et al., Reference Lu, Yu, Meng, Chen and Zhao2017). Their use has been demonstrated in the synthesis of alcohols and lipids, the hydrogenolysis of glycerol, the catalytic wet oxidation of ammonia to nitrogen and even the hydrogenation of olefins with high activity and selectivity (Asedegbega-Nieto et al., Reference Asedegbega-Nieto, Bachiller-Baeza, Guerrero-Ruíz and Rodríguez-Ramos2006; Chen et al., Reference Chen, Yu, Chen, Shen, Wang and Cao2016; Fu et al., Reference Fu, Yang, Ma, Zhang, Gai, Zheng and Chen2016; Soares et al., Reference Soares, Salazar, Falcone, Vasconcellos, Davis and Passos2016; Ban et al., Reference Ban, Yang, Kim and Kim2019). Compared with the C=O bond, it is beneficial thermodynamically to reduce the C=C bond instead (Asedegbega-Nieto et al., Reference Asedegbega-Nieto, Bachiller-Baeza, Guerrero-Ruíz and Rodríguez-Ramos2006).
To explore the effects of bimetals on Cu–Ru/montmorillonite (Cu–Ru/M) catalysts for removing trace olefins from aromatic hydrocarbons, Cu–Ru bimetal catalysts were prepared using a step-by-step impregnation method with Cu and Ru as the active components and M as the support. We used Cu–Ru bimetallic catalysts to remove trace olefins from aromatic hydrocarbons via hydrogenation.
The catalytic mechanism of the bimetals was investigated using X-ray diffraction (XRD), N2 isotherm adsorption–desorption, inductively coupled plasma atomic emission spectrometry (ICP-AES), high-resolution transmission electron microscopy (HR-TEM) and temperature-programmed reduction of H2 (H2-TPR). Due to the synergistic effects of bimetals, compared with the single metal Cu, the addition of Ru could increase significantly the dispersion of Cu on the support surface, provide more active sites and improve the activity of the catalyst through the strong interactions between the bimetals. Due to the hydrogen spillover effect, the addition of Ru could increase significantly the absorption and storage capacity of activated hydrogen on the surface of the Cu–Ru catalyst.
By assessing the catalytic activity at various loadings, it was determined that 5% Cu and 1% Ru were the optimal loadings. In the hydrogenation reaction, 5Cu–1Ru/M exhibits high activity and stability, even comparable to Pt-based catalysts, showing great potential for application in the field for removing trace olefins from aromatics. The focus of this research is to investigate the effects of the interactions between Cu and Ru on the hydrogenation catalysts and to develop high-performance Cu-based bimetallic catalysts.
Experimental
Materials
The activated M used in this study is produced in Zhejiang (China). The components of M are shown in Table 1. Cu(NO3)2•3H2O (analytical reagent) was purchased from Zhengzhou Chengchen Chemical Products Co., Ltd (China). RuCl3•nH2O (analytical reagent) was purchased from Shanghai Haohong Biomedical Technology Co., Ltd (China). Feed oil (hereinafter referred to as ‘reforming oil’) consisted of the mixed aromatics produced by the reforming unit of China Petrochemical Co., Ltd, Zhenhai Refinery Branch (China).
Components of the activated M.

Catalyst preparation
The Cu-–Ru bimetallic catalyst was prepared using a two-step impregnation method. First, M was immersed in the solution of Cu(NO3)2•3H2O for 6 h, then dried at 110°C for 12 h. Second, the product from the first step was immersed in the RuCl3•nH2O solution for 3 h and dried at 110°C for 12 h. After calcination at 300°C for 4 h, we obtained the final catalyst, denoted as xCu–yRu/M, where x and y represent the mass percentages of Cu and Ru in this system (in elemental form). For example, 5Cu–1Ru/M indicates that Cu and Ru account for 5% and 1%, respectively, of the mass fraction of the whole catalyst (Cu + Ru + M). The additive amounts of M, Cu(NO3)2•3H2O and RuCl3•nH2O during the impregnation were 9.40, 1.90 and 0.25 g, respectively.
Catalyst characterization
The pore-structure parameters of the catalysts were obtained from N2 isothermal adsorption–desorption experiments using an ASAP-2010 low-temperature N2 adsorption–desorption instrument (Micromeritics, USA) with the pressure of N2 set to 3 MPa. The sample mass for each experiment was ~0.10 g. Each sample was degassed in a vacuum at 200°C for 3 h to remove internal moisture, and then the adsorption measurement experiments were performed. After the adsorption and desorption process, we obtained the corresponding isotherm.
The grain size of a crystal was determined using XRD analysis. The main piece of equipment used was a D500 diffractometer (Siemens, Germany), with Cu-Kα (40 kV, 100 mA) as the radiation source, and the scanning range was 3–80°2θ. An X-ray chamber reactor was used to register the spectra at high temperatures.
H2-TPR was carried out using an Autochem 2910 (Micromeritics) instrument. Approximately 50 mg of catalyst powder, after pre-treatment (reaching 120°C at a rate of 10°C min–1 and maintaining this temperature for 1 h) to remove water and impurities, was exposed to a reducing gas consisting of 5.0 vol.% H2 in Ar with a temperature ramp rate of 10°C min–1 from ambient temperature to 600°C.
The chemical compositions of the catalysts were determined using a 725-ES (Agilent, USA) ICP-AES instrument. The samples were dissolved completely in a suitable acid solution before analysis.
The morphologies of samples were observed using HR-TEM with a JEM-2100 apparatus (JEOL, Japan). A small amount of powder sample was placed on the Mo mesh, and TEM images were obtained using electron beams from an LaB6 filament (200 kV).
Catalytic reaction test
The reactor consisted of a 36 cm-long steel tube of dimensions 8.0 mm (outer diameter) × 1.5 mm (wall thickness of the reaction tube). The constant-temperature section was located in the middle part of the tube and was ~10 cm long; 1.3389 g of catalyst (screening 20–40 mesh) was loaded into the constant-temperature section of the reactor, and both ends were filled with quartz sand (20–40 mesh; Sinopharm Group Chemical Reagent Co., Ltd, China). The catalyst was first reduced at a H2 flow rate of 50 mL min–1 and 300°C for 1 h. The hydrogenation reaction of the reforming oil was then carried out. The reaction temperature was 175°C and the pressure was 1.8 MPa. The volume flow rates of H2 and the reforming oil were 18.0 and 0.9 mL min–1, respectively; that is, the volume ratio of H2 to reforming oil (VRHR) was 20. The ratio of reforming oil mass flow to catalyst mass (WHSV) was 35 h–1.
An LC-6 Bromine Index Tester (Jiangsu Jiangyan Analytical Instrument Factory, China) was used to electrolyze KBr in an electrolyte to generate Br. A computer detected the electrical signal of the electrolytic KBr to obtain the degree of addition of unsaturated double bonds and then to obtain the bromine index of the aromatic hydrocarbon feedstock oil. We tested the bromine values of the raw oil and samples and then calculated the conversion rate of each sample. The conversion rate of olefin is X = ((Ci – Cf)/Ci) × 100%, where Ci is the initial olefin content and Cf is the final olefin content.
Gas chromatography (GC) was performed using a GC-1970 system (Tianmei Scientific Instrument Co., Ltd, China) to determine the composition of the reforming oil. The initial temperature was 60°C, which was then increased to 100°C at 10°C min–1 and maintained at that temperature for 2 min, and then further increased to 180°C at 10°C min–1 and maintained at that temperature for 4 min.
Results and discussion
N2 adsorption–desorption isotherms
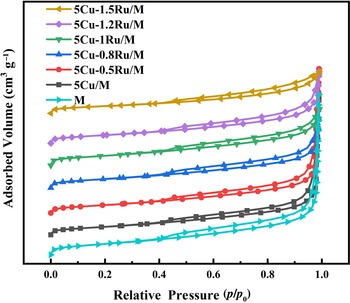
In the N2 isothermal adsorption–desorption experiment, in the range where the relative partial pressure p/p 0 is low, the adsorption capacity increased rapidly with increasing relative partial pressure, as is shown in Figs 1 & 2. At higher p/p 0 values, a hysteresis loop can be observed. All catalysts showed typical type-IV isotherms and type-H3 loops based on the International Union of Pure and Applied Chemistry (IUPAC) classification, indicating the presence of mesopores.
N2 adsorption–desorption isotherms of the catalysts with various Cu and Ru loadings.

Pore-size distribution curves of the various catalysts.

Table 2 lists the Brunauer–Emmett–Teller specific surface area (S BET), average total pore volume (V total) and most probable pore diameter for the Barrett–Joyner–Halenda (BJH) adsorption of various catalysts. The S BET first increased and then decreased with increasing Ru content, while V total as measured using the BJH method showed the opposite trend.
Structural parameters of the various catalysts.

It is worth noting that the addition of Ru increased the S BET of the 5Cu/M catalyst. This may be due to the synergetic effect between Ru and Cu, which increases the dispersion of Cu on the surface of M (Ma et al., Reference Ma, Cai, Wang, Cui, Sun, Cao and Meng2019). In addition, Cu is more inclined to combine with Ru than M, thereby forming an alloy (Álvarez-Rodríguez et al., Reference Álvarez-Rodríguez, Guerrero-Ruiz, Rodríguez-Ramos and Arcoya2008). These all lead to increased S BET. However, S BET did not always increase with increased Ru loading, as when the loading of Ru exceeded 1%, S BET decreased. Previous research (Asedegbega-Nieto et al., Reference Asedegbega-Nieto, Bachiller-Baeza, Guerrero-Ruíz and Rodríguez-Ramos2006) demonstrated that Cu and Ru tend to combine when loading is low, but when loading exceeds a certain value, Cu species separate from Ru and load onto the support M, which is consistent with our S BET results. 5Cu–1Ru/M provides more sites for binding to active hydrogen species.
XRD characterization
XRD was performed to analyse the crystalline structure of the various catalysts, and the XRD traces are displayed in Fig. 3. For support M, typical structures of SiO2 (JCPDF 46-1045) and M (JCPDF 13-0135) with lattice parameters of a = 5.169 Å, b = 5.169 Å and c = 15.02 Å could be observed. The characteristic peaks of SiO2 and M remained essentially unchanged before and after modification. As such, it is shown that the structure of M is not destroyed during the preparation of the catalyst.
XRD traces of the various catalysts.

As is shown in Fig. 3, the characteristic diffraction peaks of Cu or Ru were not found. We attribute this to the light loading (up to 5%) of Cu and Ru (Stefanov et al., Reference Stefanov, Todorova, Naydenov, Tzaneva, Kolev and Atanasova2015) and the synergistic effects of the bimetal, as the strong interaction between Cu and Ru can promote the dispersion of Cu and Ru (Ban et al., Reference Ban, Yang, Kim and Kim2019), making it difficult to observe the characteristic peaks of their related compounds.
H2-TPR characterization
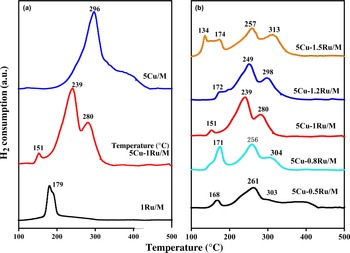
Figure 4a shows the H2-TPR profiles of the catalysts. 1Ru/M had a reduction peak at ~179°C, which was much lower than the value for 5Cu/M, suggesting that the oxygen species in the 1Ru/M catalyst had relatively high reactivity. The 5Cu/M catalyst presented a main reduction peak at 296°C, and H2 consumption continued up to a temperature of 440°C, indicating that Cu was harder to reduce than Ru. Note that there were three reduction peaks of 5Cu–1Ru/M at 151°C, 239°C and 280°C, which could be assigned to the hydrogen-consumption peak of Ru and the two hydrogen-consumption peaks of Cu (Asedegbega-Nieto et al., Reference Asedegbega-Nieto, Bachiller-Baeza, Guerrero-Ruíz and Rodríguez-Ramos2006; Bulánek & Čičmanec, 2008). The hydrogen-consumption peaks of Ru and Cu in Cu–Ru/M all shifted to lower temperatures as a result of the hydrogen spillover effect (Stassi et al., Reference Stassi, Zgolicz, Rodriguez, de Miguel and Scelza2015). During the hydrogenation reaction, the active hydrogen species on Ru oxide surfaces would spill over to the nearby active metal Cu, changing from the original single active centre to the two Cu–Ru active centres (Zhang et al., Reference Zhang, Gao, Wang, Wang, Gao and Zhang2019), therefore making RuOx and CuOx easier to reduce with activated hydrogen species. There were two peaks for Cu, which could be assigned to the reduction of Cu2+ to Cu+ and Cu+ to Cu0, respectively (Li et al., Reference Li, Wilken, Kamasamudram, Currier, Olsson and Yezerets2013). This is also a typical manifestation of the hydrogen spillover effect in bimetallic catalysts (Stassi et al., Reference Stassi, Zgolicz, Rodriguez, de Miguel and Scelza2015). Due to the strong interaction between Cu and Ru, the two metals were bound tightly and the distribution was more dispersed (Soares et al., Reference Soares, Salazar, Falcone, Vasconcellos, Davis and Passos2016), which also resulted in a lower reduction temperature (Lu et al., Reference Lu, Yu, Meng, Chen and Zhao2017).
H2-TPR profiles of the non-reduced samples. (a) Comparison of Cu-based, Ru-based catalysts and Cu–Ru bimetallic catalysts. (b) Comparison of 5Cu–yRu/M catalysts (y = 0.5, 0.8, 1.0, 1.2 or 1.5).

The reducible behaviour of 5Cu–yRu/M (y = 0.5, 0.8, 1.0, 1.2 or 1.5) was then investigated using H2-TPR, and the results of this are shown in Fig. 4b. Except for 5Cu–1.5Ru/M, the shapes of the hydrogen-consumption peaks of the various 5Cu–yRu/M catalysts were approximately the same. Note that there were two hydrogen-consumption peaks of Ru species in 5Cu–1.5Ru/M, which could be assigned to the Ru clusters that result from the separation of Ru species (>1%) from Cu species and Ru species that combined with Cu species (Fu et al., Reference Fu, Yang, Ma, Zhang, Gai, Zheng and Chen2016). With increasing Ru loading, the reduction temperature first decreased, as the reduction temperature for 5Cu–1Ru/M was less than that for 5Cu–0.5Ru/M by ~20°C, but when the Ru loading exceeded 1%, the reduction temperature increased gradually and shifted back towards its previous value. These results further support the notion of a strong interaction between Cu and Ru and the separation of Ru from the Cu surface when the Ru content was increased to >1%.
Integrating the H2-TPR curves was performed to obtain the total hydrogen consumptions of the catalysts, and the results are shown in Table 3. By comparing the peak area of the hydrogen-consumption curve, it can be concluded that the addition of Ru not only improved the reduction activity of H species on the 5Cu/M catalyst, but also increased the adsorption capacity for H species (Álvarez-Rodríguez et al., Reference Álvarez-Rodríguez, Guerrero-Ruiz, Rodríguez-Ramos and Arcoya2008; Huang et al., Reference Huang, Liu, Wen, Shen, Mehdi and Wu2021). Note that 5Cu–1Ru/M had the strongest reducibility and provided the most activation sites, which is consistent with the S BET results and the H2-TPR profiles.
Total hydrogen consumption of the various catalysts in H2-TPR.

Inductively coupled plasma atomic emission spectrometry
To prove that Cu and Ru were loaded successfully on the M, the actual metal contents of the 5Cu–1Ru/M catalysts were determined using ICP-AES. The ICP-AES data show that the Cu content was 4.55 mg L–1, while the Ru content was 0.96 mg L–1. According to these calculations, for the 5Cu–1Ru/M catalyst, the actual loading of Cu was 4.55 wt.% and of Ru was 0.96 wt.%. Excluding instrument error and losses during the roasting process, these values are close to the theoretical loadings, proving that Cu and Ru can combine effectively with support M.
High-resolution transmission electron microscopy
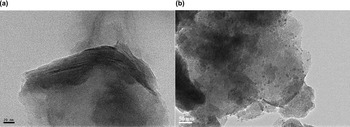
HR-TEM images of M and 5Cu–1Ru/M are shown in Fig. 5. Figure 5a shows that M has a layered structure, which is consistent with the results from the N2 adsorption–desorption isotherm experiments. The dispersion of metal oxides on the support was also studied using HR-TEM. Figure 5b shows that metal oxides were observed on the support surface. The metal-oxide particles are displayed in Fig. 5b as black dots, and the light grey region is the support, indicating that metal oxides were supported successfully on the surface of M. Most of the metal oxides were well dispersed, and only a few were agglomerated.
HR-TEM images of (a) M and (b) 5Cu–1Ru/M.

Comparison of the activity levels of the various catalysts
In the absence of hydrogenation, M also removes olefins via adsorption. To test its effect on olefin removal, we tested the activities of M and 5Cu–1Ru/M without hydrogenation, while the other reaction conditions were the same as with hydrogenation. The comparison of the conversion rates for removing olefins is shown in Fig. 6. M and 5Cu–1Ru/M removed very few olefins via adsorption, and so this process had a negligible effect on the results. Therefore, the catalysts mainly removed the olefins in the reforming oil via the hydrogenation reaction.
Comparison of olefin-removal conversion of the catalysts with and without hydrogenation (WHSV = 35 h–1, T = 175°C, P = 1.8 MPa, VRHR = 20).

For the same catalysts, reagent diffusion is affected by particle size. To exclude the influence of reagent diffusion in these reaction conditions, we prepared 5–10, 20–40, 40–60 and 60–80 mesh 5Cu–1Ru/M catalysts and tested their performance under the same reaction conditions. The results are shown in Fig. 7. It can be observed that the conversion of the 5–10 mesh catalyst was significantly less than those of the 20–40, 40–60 and 60–80 mesh catalysts. However, there were no significant differences in conversion rates between the other catalysts, so for the 20–40 mesh catalysts the influence of reagent diffusion can be excluded in these reaction conditions.
Conversion of 5Cu–1Ru/M with various mesh numbers (WHSV = 35 h–1, T = 175°C, P = 1.8 MPa, VRHR = 20).

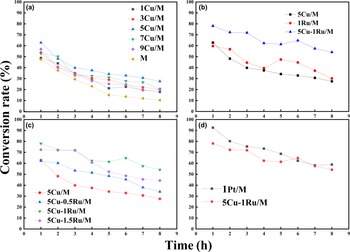
Figure 8 shows the conversion rates of the various catalysts over time. As is shown in Fig. 8a, pure M could adsorb olefins, and it had the lowest activity and the worst stability. As Cu was loaded on M, the activity of the catalyst increased and the deactivation rate also reduced, demonstrating that Cu provided the active centre and improved the stability of the catalyst to a certain extent, confirming the good performance of Cu as the active metal in hydrogenation catalysts (Schittkowski et al., Reference Schittkowski, Tölle, Anke, Stürmer and Muhler2017).
Catalytic activity tests. (a) Comparison of Cu-based catalysts (WHSV = 35 h–1, VRHR = 20). (b) Comparison of 5Cu/M, 1Ru/M and 5Cu–1Ru/M (WHSV = 35 h–1, VHRH = 20). (c) Comparison of 5Cu–yRu/M (y = 0.5, 1.0 or 1.5; WHSV = 35 h–1, VRHR = 20). (d) Comparison of 5Cu–1Ru/M and 1Pt/M (WHSV = 35 h–1, VRHR = 20).

On this basis, by changing the loading of Cu, various xCu/M (x = 1, 3, 5, 7 or 9) catalysts were prepared to compare their activities. It was found that 5Cu/M demonstrated greater activity than the other catalysts at the beginning of the reaction. Furthermore, in terms of application time of the catalysts, we compared the stability of their activity after 5 h of evaluation. As the loading of Cu increased, the activity of xCu/M first increased and then decreased, and 5Cu/M performed best. This could be due to low levels of Cu being insufficient to increase the active sites for the hydrogenation reaction, while high levels of Cu would block the layered structure of the support M, which could be confirmed from the N2 adsorption–desorption isotherm results. A 1Ru/M catalyst was also prepared. 1Ru/M performed well at 1 h, but then its performance began to decline sharply and finally stabilized at a similar value as that for 5Cu/M. Therefore, the single Cu or Ru metal catalysts were not suitable for catalytic hydrogenation. By contrast, the activity and stability of the 5Cu–1Ru/M catalyst were improved significantly. Due to the synergistic effects in bicomponent Cu–Ru/M catalysts, the addition of Ru could increase the dispersion and structural stability of Cu on the surface of the support, thus improving activity while slowing down the deactivation rate of the catalyst (Lu et al., Reference Lu, Yu, Meng, Chen and Zhao2017). Moreover, due to the hydrogen spillover effect, the combined action of the bimetals added new active centres, and the activated hydrogen species reacted on the three active centres of Cu, Ru and support M at the same time, which increased the reaction rate significantly (Zhang et al., Reference Zhang, Gao, Wang, Wang, Gao and Zhang2019).
On this basis, the influence of various Ru loadings on Cu-based catalysts was explored. As is shown in Fig. 8c, we found that with increased Ru loading, the activity of 5Cu–yRu/M (y = 0.5, 1.0 or 1.5) first increased and then decreased. Among these catalysts, 5Cu–1Ru/M demonstrated the greatest activity and stability, which is consistent with the N2 adsorption–desorption isotherm results, confirming the greatest metal dispersibility for 5Cu–1Ru/M, which provided the greatest number of active sites to bind with active hydrogen species. Moreover, via H2-TPR, 5Cu–1Ru/M was also shown to absorb and utilize the most active hydrogen species (Zhang et al., Reference Zhang, Gao, Wang, Wang, Gao and Zhang2019). Overall, we have verified through experiments that 5% Cu and 1% Ru are the optimal loadings for xCu–yRu/M catalysts.
Pt has been recognized as an excellent active metal for hydrogenation catalysts and has been used widely in industrial applications. Under the same reaction conditions, we compared the performance of 5Cu–1Ru/M with 1Pt/M catalysts. The Pt catalyst had extremely high activity (92%) at the beginning of the reaction, but this decreased rapidly over time, and the activity of the 5Cu–1Ru/M catalyst was very close to that of the 1Pt/M catalyst after 6 h. Considering the high cost of Pt, this result is very satisfactory. In general, 5Cu–1Ru/M was comparable to the precious-metal Pt catalyst, showing great potential for replacing traditional noble-metal catalysts in the future.
In addition, we compared this catalyst with a Cu–Zn bimetallic hydrogenation catalyst (Wang et al., Reference Wang, Meng, Wang, Shi, Hu and Liu2021). The results of this are shown in Table 4. The two catalysts reacted at the same temperature, pressure and WHSV. However, the VRHR of the Cu–Zn catalyst was 250, while the VRHR for 5Cu–1Ru/M was 50. This also illustrates the excellent performance of 5Cu–1Ru/M.
Comparison of 5Cu–1Ru/M and Cu–Zn catalyst performance.

The side-reactions during the experiment included mainly aromatic cracking and hydrogenation of benzene rings in aromatic molecules. We used GC to study the loss of aromatics in the reforming oil under these reaction conditions. The raw oil in this experiment was taken from the reformer of the refinery. Its composition is very complicated, as is shown in Fig. 9. To study the influence of side-reactions more clearly, we prepared a simulated oil. The simulated oil was prepared with n-heptane and mixed xylene, and the mass fraction of mixed xylene was 50%, which was selected to simulate the specific gravity of xylene in the feedstock oil. The simulated oil was hydrogenated catalytically under the same reaction conditions as the previous experiments, and the results of this are shown in Fig. 10. There was no GC of the sample after the reaction, which means that there was no aromatic cracking and hydrogenation of benzene rings in the aromatics. This occurred firstly because these side-reactions required severe conditions of high temperature and high pressure, which were not available in this hydrogenation experiment, and secondly because the catalyst had the effect of selective hydrogenation and the reaction process was relatively mild.
Gas chromatogram of the reforming oil.

Gas chromatograms of the simulated oil (a) before and (b) after reaction.

Mechanism of the hydrogenation process on the catalyst surface
It is believed generally that the olefin hydrogenation reaction takes place on the surface of a catalyst. Its mechanism is shown in Fig. 11. First, hydrogen is adsorbed on the huge surface of the finely dispersed metal, and the catalyst surface breaks the H–H covalent bond of hydrogen molecules, forming active hydrogen atoms. Second, at the same time, the olefin and the catalyst form a complex, and the π bond in the olefin is also weakened, which reduces greatly the activation energy required for the hydrogenation reaction and increases the reaction rate. Third, hydrogen atoms combine with the carbon atoms of the olefin double bond to form alkanes. As the adsorption capacity of the catalyst surface for alkanes is less than that for alkenes, the resulting alkanes dissociate from the catalyst surface. When alkanes are generated, the greater the number of active sites on the catalyst surface, the greater the number of olefins and hydrogen molecules that can be adsorbed at the same time, thereby accelerating the hydrogenation reaction rate. Excess metal will agglomerate and block the pore structure even more, which will cause a sharp decrease in the number of active sites (Wang et al., Reference Wang, Meng, Wang, Shi, Hu and Liu2021). This is consistent with our N2 adsorption–desorption isotherm results. Moreover, the number of active sites is not the only factor that affects the reaction rate. The adsorption and desorption rate of active hydrogen and olefins on the surface and the adsorption capacity of the catalyst surface are also very significant factors (Centi & Perathoner, Reference Centi and Perathoner1995).
The hydrogenation mechanism of olefins on a metal catalyst surface.

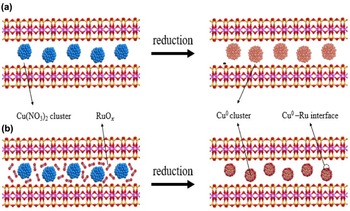
The formation process of the catalyst surface is shown in Fig. 12. For single-metal Cu catalysts, after high-temperature calcination and reduction processes, Cu species converge into copper clusters, which will result in a reduction in the number of active sites. By contrast, in the Cu–Ru bimetallic catalyst, there is an interface effect between the two metals (Zhu et al., Reference Zhu, Yang, Zhang, An, Zhang, Shu and He2021). A Cu–Ru interface is formed after calcination and reduction, and Ru species tend to combine with Cu species (Poels & Brands, Reference Poels and Brands2000; Zhang et al., Reference Zhang, Wu, Li, Zhang, Hu and Wu2021a), which improves the dispersion of Cu species greatly and also reduces the number and size of copper clusters (Zheng et al., Reference Zheng, Porosoff, Weiner, Lu, Zhu and Chen2012). As a result, the adsorption and desorption rate and capacity for hydrogen on the surface of the catalyst are also improved significantly.
The formation process of the catalyst surface.

Conclusion
Cu–Ru/M bimetallic catalysts were prepared and characterized. Based on the ‘Results and discussion’ section, the following conclusions can be drawn:
(1) Cu and Ru can be loaded successfully onto M using a step-by-step impregnation method without changing the layered structure of M.
(2) There is an interaction between Cu and Ru, and appropriate loadings of Ru can increase the dispersion of Cu on the catalyst surface (Zhuang et al., Reference Zhuang, Currie, McAuley and Simakov2019).
(3) Due to the hydrogen spillover effect, the reducing ability of the Cu–Ru/M catalysts increases and more active hydrogen species can be adsorbed; 5Cu–1Ru/M had the strongest reducing ability.
(4) The optimal loadings of Cu–Ru/M bimetallic catalysts are 5% Cu and 1% Ru. 5Cu–1Ru/M shows excellent catalytic performance that is comparable to those of noble-metal Pt catalysts. 5Cu–1Ru/M did not lead to the loss of aromatics under these experimental conditions.
To further improve the performance of this catalyst, we will improve the preparation method and find better co-catalysts in the future.