





Dietary recommendations and guidelines are evolving to better reflect new health evidence and cultural preferences and to address emerging global challenges such as climate change(Reference Zeraatkar, Johnston and Guyatt1,2) . In Canada, Health Canada is responsible for revising and updating Canada’s food guide (CFG) based on new scientific evidence and evaluation of previous versions(2,3) . The most recent version, published in January 2019, featured several changes, including categorising dairy products under ‘protein foods’ alongside unsweetened fortified soya beverages and other protein-rich foods, such as meat, legumes and fish. This contrasts with the 2007 CFG version, in which dairy products and alternatives were a unique food group(4). A new section focusing on healthy beverages, promoting water, lower-fat milk and fortified plant-based milk alternatives such as soya beverages and almond beverages was also introduced in the CFG in 2019, with specific recommendations to choose unsweetened fortified beverages(5). Consistent with these recommendations, the 2019 CFG Food Classification System(6) categorises foods based on their nutritional profile: foods that are fully recommended have low saturated fat and Na content and contain no free sugars or sugar substitutes (Tier 1), including plain skim and 1 % milk, as well as most unsweetened plant-based beverages (PBB) that are fortified and/or contain sufficient protein. Foods not recommended for regular consumption due to high sugar, Na and/or saturated fat content (Tier 3) include whole milk and dairy beverages/PBB with added sugars (≥5 g of sugar per reference amount). Foods that meet neither Tier 1 nor Tier 3 criteria, such as plain 2 % milk, fall into Tier 2(6).
The 2019 CFG also has an increased focus on sustainability, with a particular emphasis on plant-based foods(7) as their impact on the environment is known to be lower than animal-based foods(Reference Poore and Nemecek8). Indeed, milk production performs poorly compared with plant-based alternatives for most environmental indicators, including greenhouse gas emissions and land use(Reference Geburt, Albrecht and Pointke9). For example, the production of milk and soya beverages generates an average of 3·2 kg and 1·0 kg of CO2 equivalents per litre, respectively(Reference Poore and Nemecek8). In addition, plant-based options tend to be more expensive than milk(Reference Stewart, Kuchler and Cessna10–Reference Lee, Srebot and Ahmed13), have variable micronutrient content depending on fortification(14) and typically provide less protein and fewer essential amino acids, except for soya-based alternatives(Reference Smith, Dave and Hill15).
To our knowledge, no recent studies have examined trends in household purchasing habits for dairy beverages and PBB alternatives to milk and dairy products, which include milk substitutes (e.g. soya and almond beverages), as well as plant-based drinkable yogurt and kefir. Moreover, research on specific subcategories, such as milk by fat content, dairy beverages and PBB with added sugars and types of milk alternatives, is lacking. A better understanding of these purchasing habits is essential to assess how Canadians’ diets are evolving in response to the 2019 CFG recommendations but also to inform policies promoting healthier and more sustainable consumption of dairy beverages and PBB. Therefore, the objectives of this study were (1) to examine purchasing of dairy beverages and PBB before and after the release of the 2019 CFG, (2) to examine differences in purchases by household sociodemographic characteristics and province and (3) to compare the average price of dairy beverages and PBB by province and by beverage type.
Methods
Study sample
This study used NielsenIQ Homescan data from 2018 to 2020 from the provinces of Québec and Ontario, Canada. A total of 6067 distinct households (13 561 household-year observations) participated in the panel for at least 1 year between 2018 and 2020. Households were selected for the panel to ensure representativeness of the Canadian population, and weights were applied to represent all households in Canada based on region, age, household size, household income and language.
Households were required to actively participate in at least eleven of the thirteen 4-week periods during the given year of participation. Panel members were asked to identify the head(s) of household, defined as those who make the majority of purchasing decisions. Participating heads of household (responding to the questionnaires) were given a handheld scanner or provided an app on their smartphone and were asked to scan the Universal Product Codes (UPC) of all products purchased on a shopping occasion. For each occasion, the following information was also collected: date of purchase, retailer visited, channel visited (online and in-store), trip amount, and for each UPC, the number of units purchased, and the price paid. Purchases were reported to the NielsenIQ team on a weekly basis. The participating head of household was also asked to report the sociodemographic characteristics of their household, including household income, household composition (household size, presence and age of children at home) and information about heads of household (themselves and, if applicable, their partner) including education level, marital status, age, employment status, ethnicity and location. Participating heads of household received rewards for their participation using a point system that could be used to purchase items. Ethical approval was not required as the data were obtained in anonymised format.
This study analysed purchases of dairy beverages (milk, drinkable yogurt and kefir, milkshakes and eggnogs) and PBB (milk alternatives, plant-based drinkable yogurts and kefirs). Both sweetened and unsweetened beverages and flavoured and unflavoured beverages were included. Buttermilk and cream were excluded from the analysis, as were milkettes (e.g. 9–15 ml cup of milk for coffee). Products with missing or implausible price information or missing format or with a UPC or product description that did not allow identification of the product were also excluded. After excluding 393 purchases due to missing information on the product or outlet, 2569 purchases of buttermilk, 141 purchases of milkettes and 210 purchases with implausible price information, a total of 1451 distinct UPC (618 084 individual products purchased), were included in the analysis.
Nutrition information, including the ingredient list and data found in the Nutrition Facts table, was obtained from the Food Quality Observatory database (2022 data)(16) or collected online between September 2023 and May 2024, by matching UPC and/or product descriptions from the NielsenIQ database. When the exact product could not be found, nutrition information from a similar product was used, based on the closest comparable alternative that had the highest sales in the dataset. Nutrition Facts tables were used to estimate the total sugar content, including lactose, of beverages, and ingredient lists were used to determine whether a beverage contained added sugars or was fortified. In Canada, fifteen vitamins and minerals are permitted for fortification in PBB under certain conditions(17).
Statistical analyses were performed using SAS Studio version 3.81 (SAS Institute). Weighted descriptive analyses of sociodemographic characteristics were conducted. The weighted mean annual volume purchased per household, with 99 % CI and rounded to one significant digit, was estimated for the following: (1) total dairy beverages (i.e. milk, milkshakes, eggnog, drinkable yogurt and kefir, with and without added sugars), (2) milk by fat content (i.e. skim, 1 %, 2 % and whole milk, with and without added sugars), (3) total PBB (i.e. plant-based milk alternatives, plant-based kefir and drinkable yogurt, with and without added sugars), (4) plant-based milk alternatives by type (i.e. soya, almond and ‘other’ milk alternatives, with and without added sugars), (5) dairy beverages and PBB with added sugars and (6) fortified PBB (with and without added sugars). The volume purchased was calculated by using the volume of the container, the number of containers per unit (if multipack) and the number of units purchased. Modelled after previous methods, households were excluded from a given year’s analysis if they reported excessive purchases (>1 litre per household member per day for all dairy beverages and PBB combined)(Reference Berger, Cummins and Allen18) or no purchases of any beverages. However, these households were retained in analyses for other years in which their purchases met inclusion criteria. Across the three years, nineteen household-year observations were excluded due to excessive purchases, and six household-year observations were excluded due to reporting no purchases; a total of six households were removed from the sample as they were excluded in all years they were participating. The final analytical sample included 6061 distinct households, yielding 13 536 household-year observations.
Weighted mixed linear regressions were conducted to assess the volume purchased for the different categories. A random household effect was included to account for dependence among data from the same household. Each regression included a variable for year (2018, 2019 or 2020) and the following sociodemographic characteristics: highest level of education achieved by a head of household (high school or less, technical or college, and university), lowest head of household age (<45 years, 45–64 years and ≥65 years), household income (<$40 000 CAD, $40 000–$79 999 CAD and ≥$80 000 CAD), age/presence of children at home (youngest children under 6 years of age, youngest children between 6 and 12 years of age, youngest children between 13 and 17 years of age and no children <18 years of age at home), ethnicity (at least one head of household who reported a race or ethnicity other than White, no head of household reporting a race or ethnicity other than White), province of residence (Québec, Ontario) and household size (1 member, 2 members, 3 members, 4 members, 5 members or more).
Descriptive analyses were also conducted to identify the most frequently purchased container size, and the average price (per 100 ml) and sugar content (per 250 ml), weighted by purchase frequency. Sugar content was assessed per 250 ml, corresponding to the serving size used to determine whether dairy beverages and PBB containing ≥15 g of sugar per serving are required to display a ‘high in’ front-of-pack (FOP) label. This policy was implemented in Canada in January 2026(19).
Linear regressions, weighted by purchase frequency and adjusted for year, presence of added sugars (binary variable), province and type of store where the purchase was made (i.e. convenience store, discount grocery/warehouse/dollar store, regular grocery store, drug store and other types of stores including specialty grocery stores, hardware stores, online-only stores and unknown stores) were used to assess the price difference between the different beverage categories and between provinces. The price variable was transformed using a log transformation to better meet the assumptions of homoscedasticity and normality and a random intercept was added to take into account the dependence among data from the same product across the panel (i.e., products with the same UPC are more likely to have similar prices).
Results
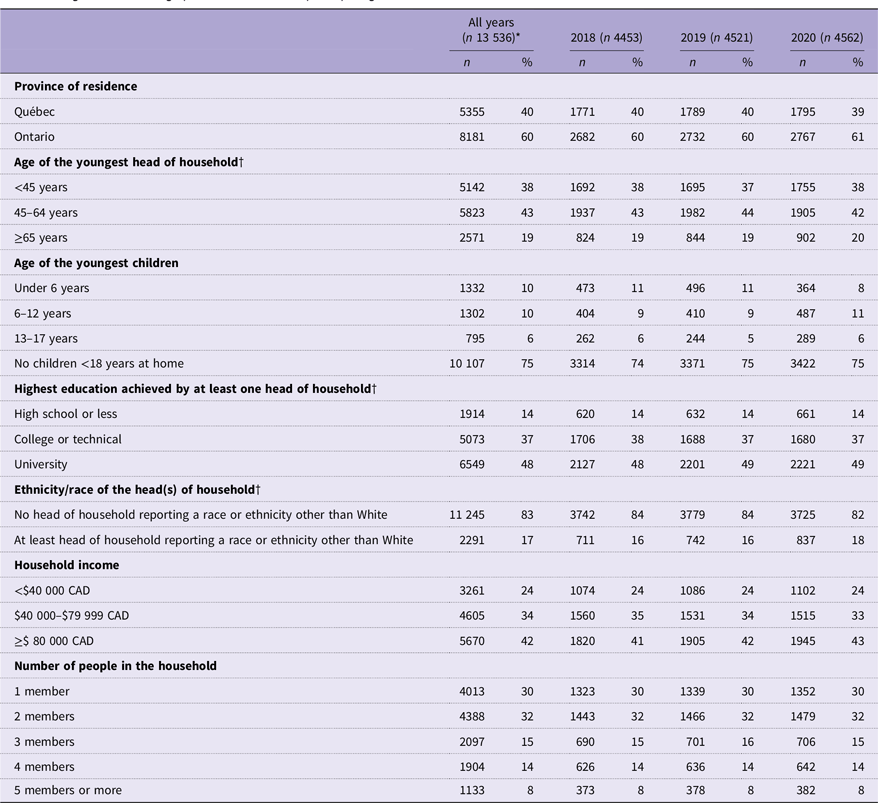
Weighted sociodemographic characteristics of the final sample are shown in Table 1. Approximately 4500 individual households participated each year, with 60 % of households residing in the province of Ontario and having a household size of two members or less. Most households had a head of household under 65 years of age, no children <18 at home and no head of household reporting a race or ethnicity other than White. Half of the households had at least one head of household with a university degree, and 40 % had a household income over $80 000 CAD.
Weighted sociodemographic characteristics of participating households

Table 1. Long description
The table presents sociodemographic characteristics of participating households across three years. It has 13 rows and 7 columns, including headers. The columns are labeled as All years (n 13 536), 2018 (n 4453), 2019 (n 4521), and 2020 (n 4562), with each year further divided into n and percent. The rows are grouped under different categories: Province of residence, Age of the youngest head of household, Age of the youngest children, Highest education achieved by at least one head of household, Ethnicity/race of the head(s) of household, Household income, and Number of people in the household. Each row provides specific data points for each year. For example, under Province of residence, Québec has 5355 participants in all years, with percentages of 40% in 2018, 40% in 2019, and 39% in 2020. Ontario has 8181 participants in all years, with percentages of 60% in 2018, 60% in 2019, and 61% in 2020. The table also includes detailed data on age groups, education levels, ethnicity, household income, and household size for each year.
* Households that participated for more than 1 year could move between sociodemographic categories over time.
† Panel members were asked to identify the head(s) of household, defined as those who make the majority of purchasing decisions.
Volume purchased
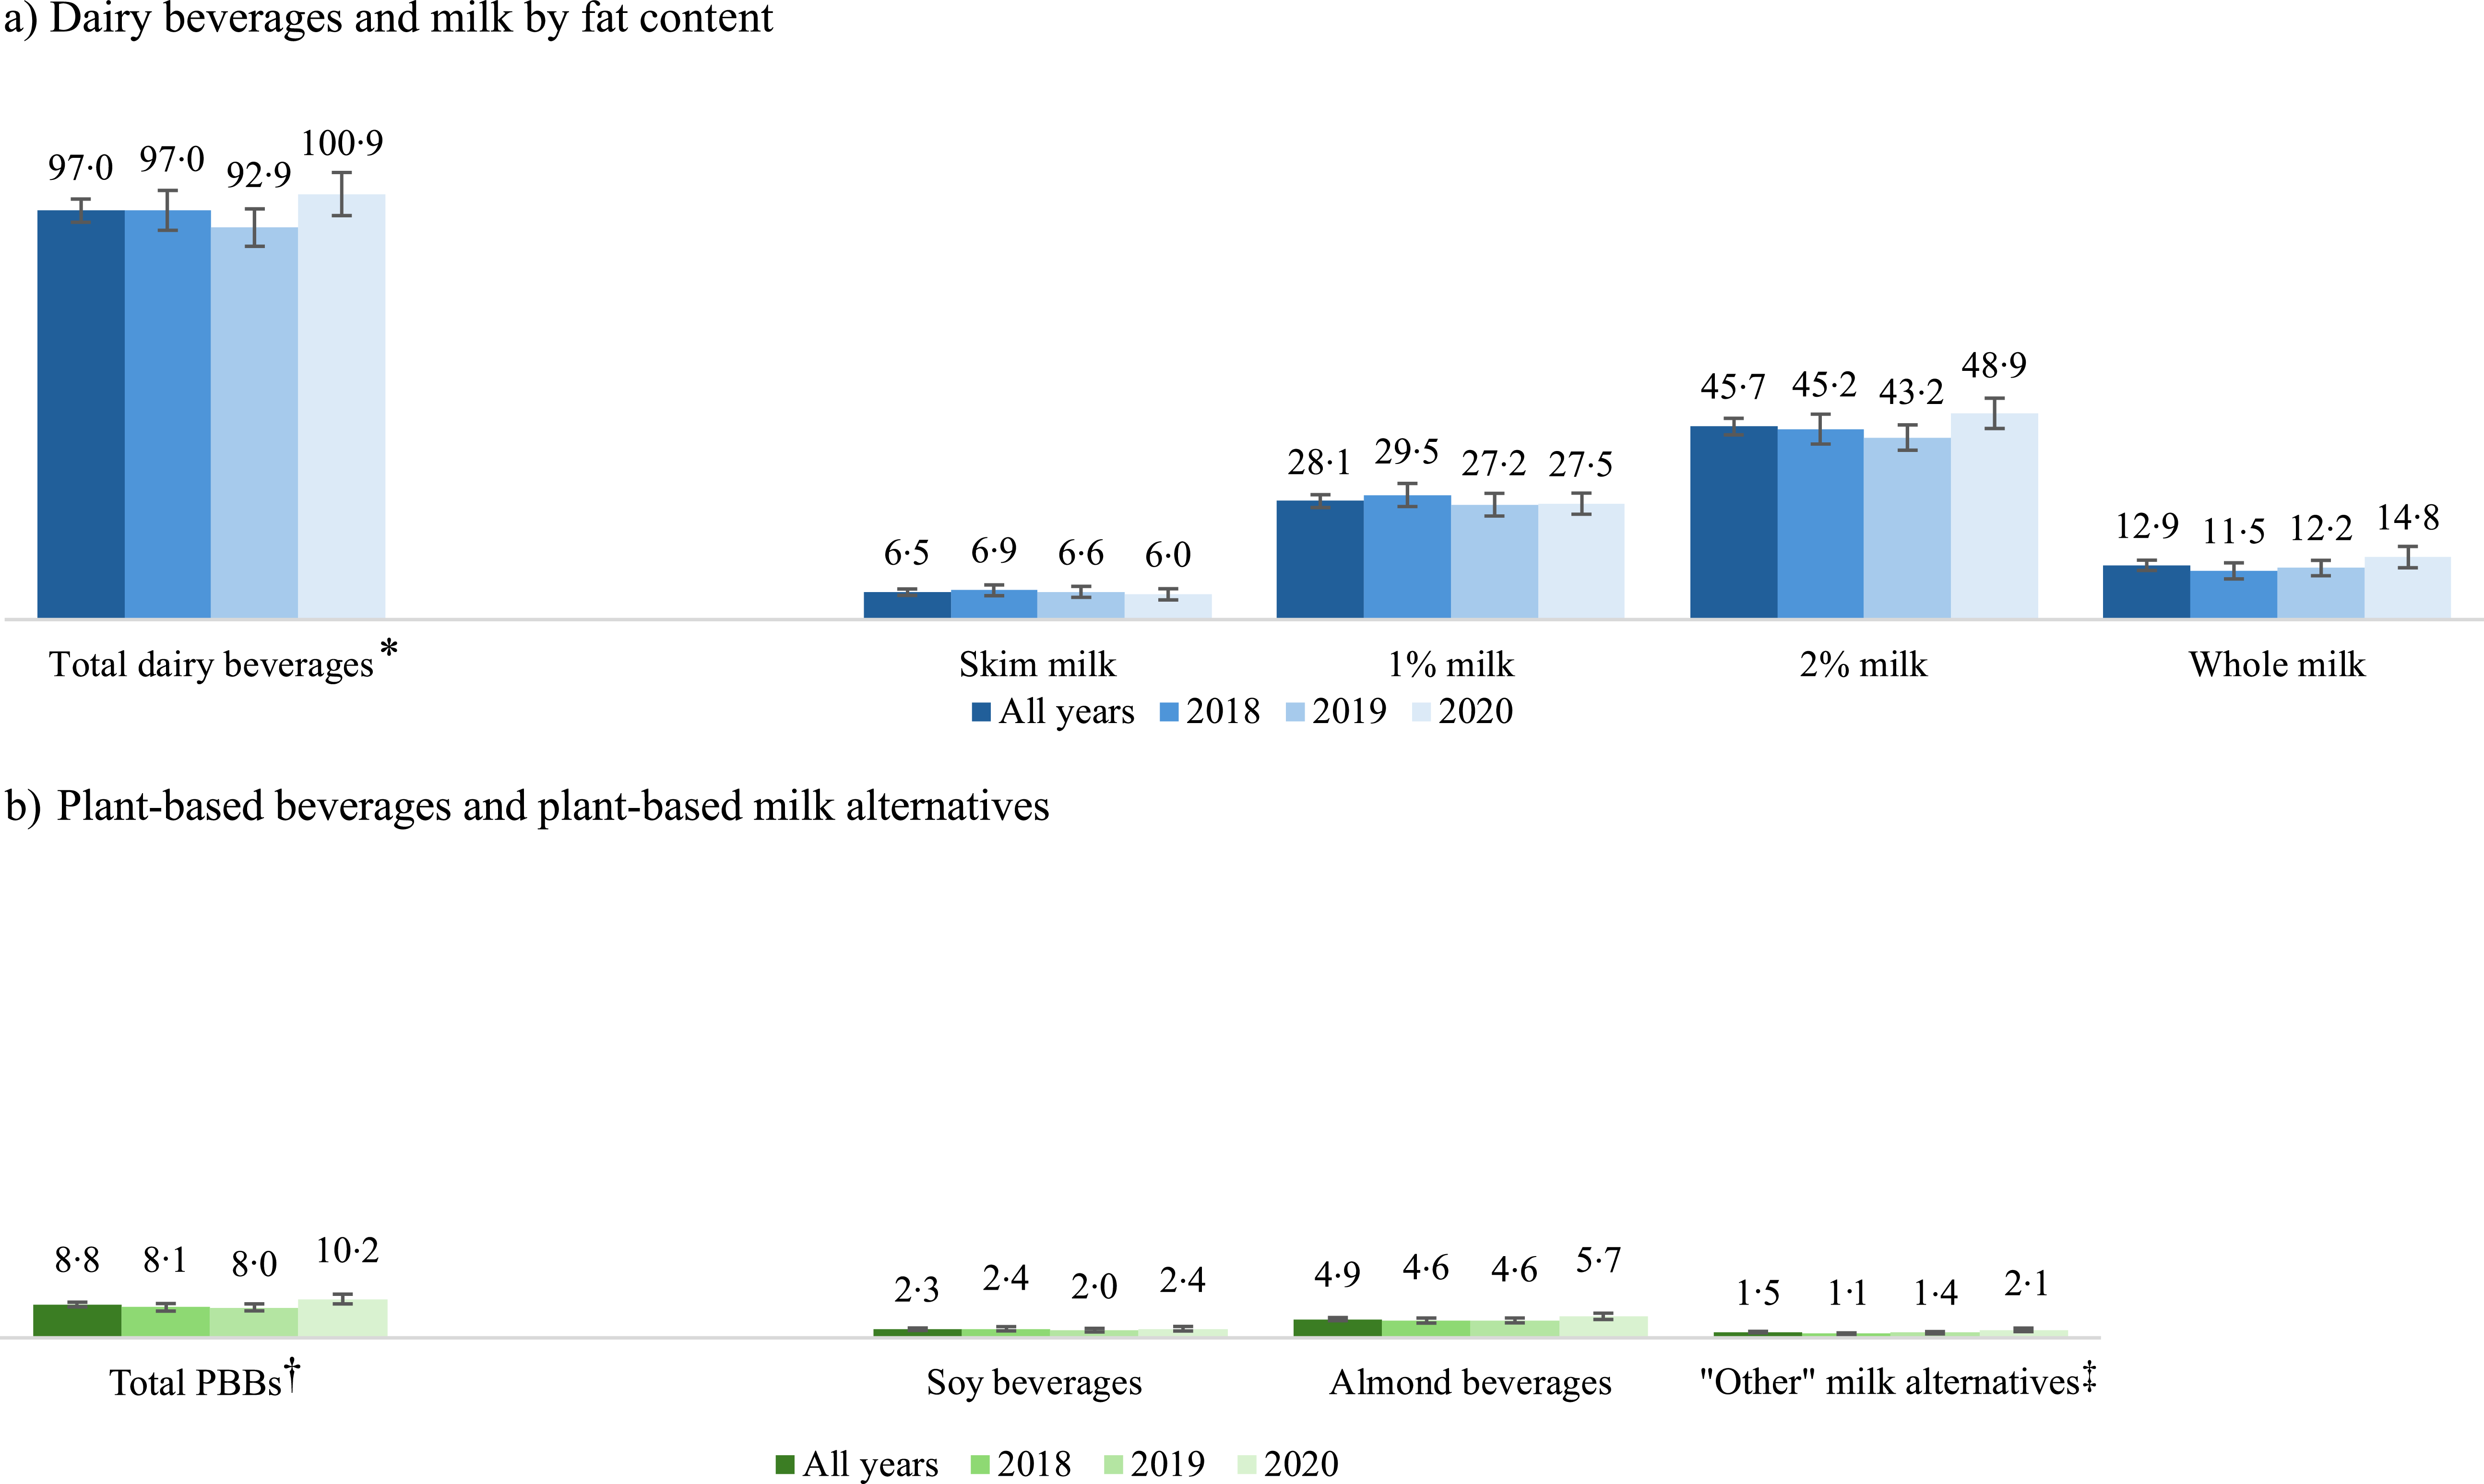
Overall, households purchased an average of 97·0 litres (99 % CI 94·2, 99·7) of total dairy beverages and 8·8 litres (99 % CI 8·2, 9·4) of total PBB annually (Figure 1). The most commonly purchased milk fat contents were 2 % (average annual purchase of 45·7 litres, 99 % CI 43·8, 47·7) and 1 % milk (28·1 litres, 99 % CI 26·5, 29·6), followed by whole (12·9 litres, 99 % CI 11·6, 14·1) and skim milk (6·5 litres, 99 % CI 5·7, 7·2). In contrast, almond beverages were the most purchased plant-based milk alternatives (4·9 litres, 99 % CI 4·5, 5·4), followed by soya beverages (2·3 litres, 99 % CI 2·0, 2·6) and ‘other’ milk alternatives (i.e. oat, rice and cashew) (1·5 litres, 99 % CI 1·3, 1·7). Purchases of other dairy beverages (e.g. eggnog, milkshakes, kefir and drinkable yogurt) and PBB (plant-based drinkable yogurt, kefir and other plant-based milk alternatives further broken down by type) are presented in the supplementary figures (Figure S1). Notably, the average amount of oat beverage purchased went from 0·1 litre (99 % CI 0·0, 0·1) in 2018 to 1·0 litre (99 % CI 0·6, 1·3) in 2020. The proportion of households that purchased at least one PBB per year increased from 38·3 % in 2018 to 42·0 % in 2020, while the proportion of households purchasing dairy beverages remained stable (96·0 % to 95·5 %) (data not shown). The volumes of dairy beverages and PBB purchased, among purchasing households only, are shown in supplemental figures (Figure S2).
Average weighted household purchases of dairy beverages and plant-based beverages among a panel of households in Ontario and Québec, in litres, by year. *Total dairy beverages included milk, milkshakes, eggnogs, drinkable yogurts and kefir, with and without added sugars. †Total PBB included milk alternatives, plant-based kefir and plant-based drinkable yogurt, with and without added sugars. ‡‘Other’ milk alternatives included cashew, oat and rice beverages, which are further detailed in Supplemental Figure S1. PBB, plant-based beverages.

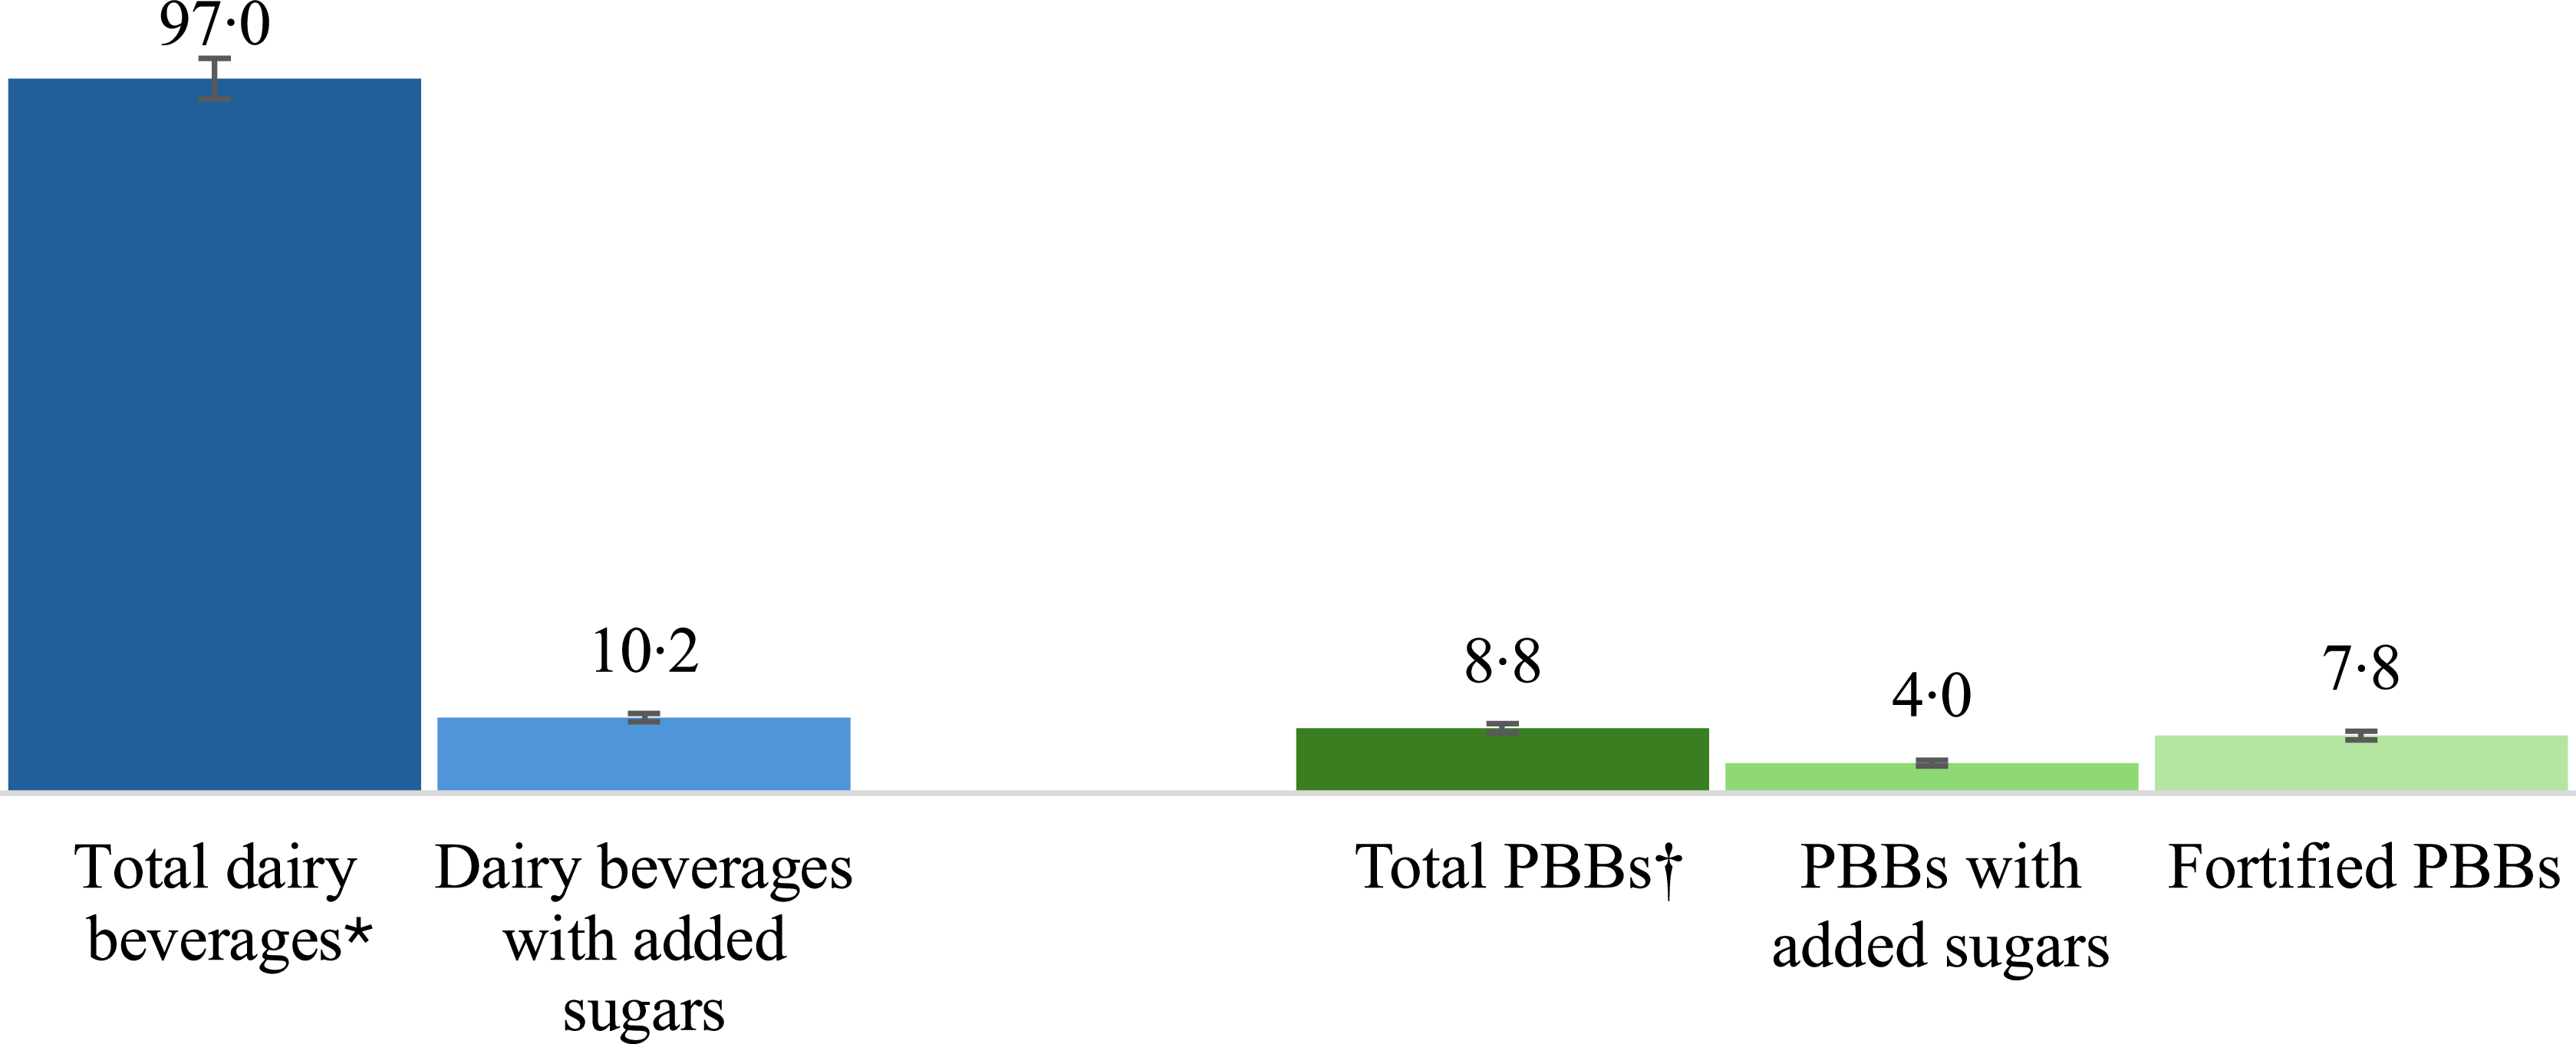
Households purchased relatively small proportions of dairy beverages with added sugars compared with the total volume of dairy beverages (10·2 litres out of 97·0 litres, 10·5 %), whereas almost half of PBB purchased contained added sugars (4·0 litres out of 8·8 litres, 45·5 %) (Figure 2). In addition, high proportions of PBB purchased by households were fortified with at least one vitamin or mineral (7·8 litres out of 8·8 litres, 88·6 %). The mean total sugar content for all PBB and dairy beverages purchased was 6·4 g/250 ml (99 % CI 6·3, 6·5) and 15·3 g/250 ml (99 % CI 15·3, 15·3), respectively, and 16·4 % of PBB had a total sugar content of 15 g/250 ml or more compared with 26·8 % for dairy beverages (data not shown).
Average weighted household purchases of dairy beverages and plant-based beverages with added sugars, and of fortified plant-based beverages, among a panel of households in Quebec and Ontario, in litres, all years combined. *Total dairy beverages included milk, milkshakes, eggnogs, drinkable yogurts and kefir. †Total PBB included milk alternatives, plant-based kefir and plant-based drinkable yogurt. PBB, plant-based beverages.

Differences in volume purchased over time
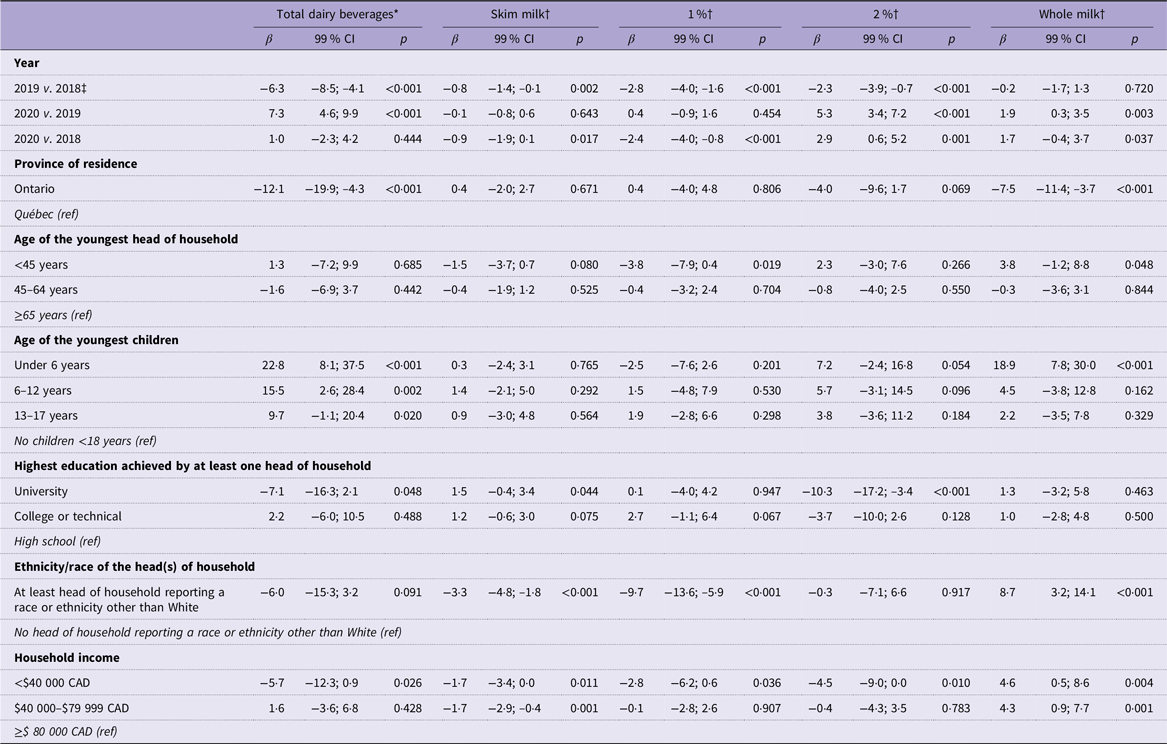
In the adjusted weighted mixed linear regressions, the average volume of total dairy beverages purchased per household was lower in 2019 than in 2018, by 6·3 litres (99 % CI −8·5, −4·1) and higher in 2020 than in 2019 by 7·3 litres (99 % CI 4·6, 9·9), with no significant difference between 2018 and 2020 (Table 2). In addition, purchases of skim, 1 % and 2 % milk were lower in 2019 than in 2018 by 0·8 litres (99 % CI −1·4, −0·1), 2·8 litres (99 % CI −4·0, −1·6) and 2·3 litres (99 % CI −3·9, −0·7), respectively, while whole milk purchases were unchanged. Purchases of 2 % and whole milk were higher in 2020 than in 2019 by 5·3 litres (99 % CI 3·4, 7·2) and 1·9 litres (99 % CI 0·3, 3·5), respectively, and were higher in 2020 compared with 2018 by 2·9 litres (99 % CI 0·6, 5·2) for 2 % milk only.
Purchases of dairy beverages, by year and household characteristics

Table 2. Long description
A table with 20 rows and 12 columns comparing dairy beverage purchases by year and household characteristics. The columns are labeled as follows: Year, Province of residence, Age of the youngest head of household, Age of the youngest children, Highest education achieved by at least one head of household, Ethnicity/race of the head(s) of household, and Household income. The rows are labeled with specific categories under each column header. The table includes data for total dairy beverages, skim milk, 1% milk, 2% milk, and whole milk. Each cell contains values for beta, 99% confidence interval, and p-value. Notable trends include changes in dairy beverage purchases over the years 2018, 2019, and 2020, as well as variations based on province of residence, age groups, education levels, ethnicity, and household income.
Weighted mixed linear regressions were conducted. All models included a variable for year and all sociodemographic characteristics, including province of residence, age of the youngest head of household, presence and age/presence of the children at home, highest education achieved by at least one head of household, ethnicity/race of the head(s) of household, and household income, and were adjusted for household size.
* Total dairy beverages included milk, milkshakes, eggnogs, drinkable yogurts and kefir, with and without added sugars.
† Only milk, both with and without added sugars, was included in the analyses by fat content.
‡ The second year listed is the reference year.
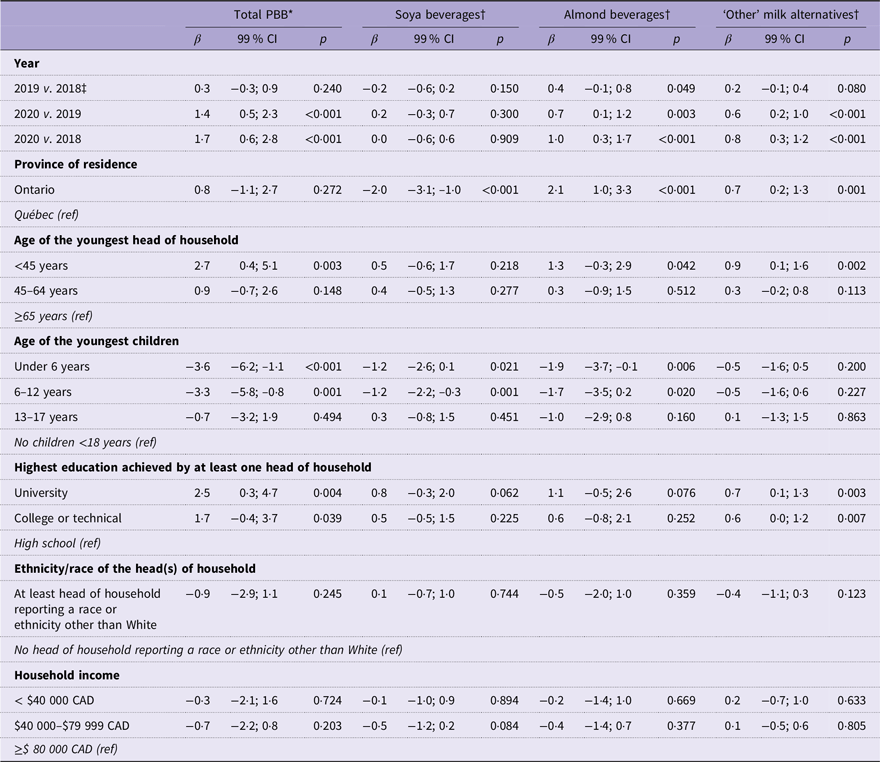
Purchases of total PBB, almond and ‘other’ plant-based milk alternatives were higher in 2020 than in 2019 by 1·4 litres (99 % CI 0·5, 2·3), 0·7 litres (99 % CI 0·1, 1·2) and 0·6 litres (99 % CI 0·2, 1·0), respectively, and the amounts purchased in 2020 were higher than in 2018 for all three categories (β = 1·7, 99 % CI 0·6, 2·8; β = 1·0, 99 % CI 0·3, 1·7; and β = 0·8, 99 % CI 0·3, 1·2, respectively) (Table 3). No changes over time were observed for soya beverages.
Purchases of plant-based beverages (PBB), by year and household characteristics

Table 3. Long description
The table presents data on purchases of plant-based beverages (PBB) by year and household characteristics. It includes columns for Total PBB, Soya beverages, Almond beverages, and Other milk alternatives, with rows for different years, provinces of residence, age of the youngest head of household, age of the youngest children, highest education achieved, ethnicity/race of the head(s) of household, and household income. Each cell contains values for beta (β), 99% confidence interval (CI), and p-value (p). Notable trends include higher purchases in 2020 compared to 2019 and 2018 for total PBB, almond beverages, and other milk alternatives, while no significant changes were observed for soya beverages. The table highlights variations in purchases based on different household characteristics.
Weighted mixed linear regressions were conducted. All models included a variable for year and all sociodemographic characteristics, including province of residence, age of the youngest head of household, presence and age/presence of the children at home, highest education achieved by at least one head of household, ethnicity/race of the head(s) of household, and household income, were adjusted for household size.
* Total PBB included milk alternatives, plant-based kefir and plant-based drinkable yogurt, with and without added sugars.
† Milk alternatives only, both with and without added sugars, were included in the analyses by beverage type.
‡ The second year listed is the reference year.
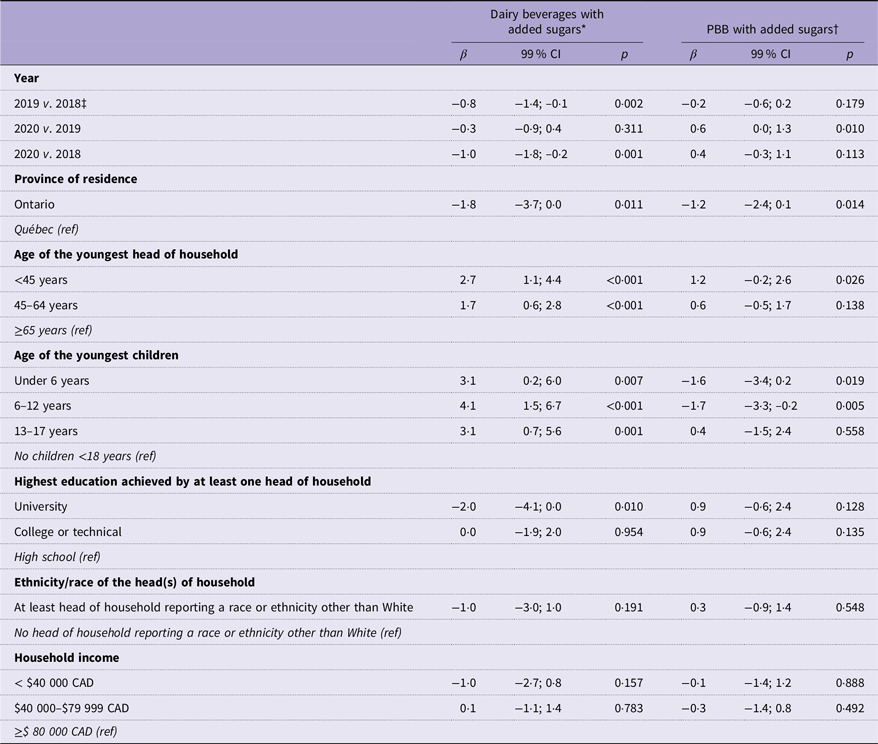
Finally, purchases of dairy beverages with added sugars were lower in 2019 compared with 2018 by 0·8 litres (99 % CI −1·4, −0·1) and were overall lower in 2020 compared with 2018 by 1·0 litres (99 % CI −1·8, −0·2). There were no significant differences over time for PBB with added sugars, although there was some indication of higher purchases in 2020 compared with 2019 (β = 0·6, 99 % CI 0·0,1·3) (Table 4).
Purchases of beverages with added sugars, by year and household characteristics

Table 4. Long description
The table presents data on the purchases of dairy beverages with added sugars and PBB with added sugars, categorized by year and various household characteristics. It includes columns for the year, province of residence, age of the youngest head of household, age of the youngest children, highest education achieved by at least one head of household, ethnicity/race of the head(s) of household, and household income. Each row provides specific data points for these categories, including beta values, 99% confidence intervals, and p-values. The table shows trends and comparisons over the years 2018, 2019, and 2020, as well as variations based on different household characteristics such as age, education, ethnicity, and income. Notable trends include changes in purchases of dairy beverages with added sugars and PBB with added sugars over time and across different provinces and household demographics.
PBB, plant-based beverages.
Weighted mixed linear regressions were conducted. All models included a variable for year and all sociodemographic characteristics, including province of residence, age of the youngest head of household, presence and age/presence of the children at home, highest education achieved by at least one head of household, ethnicity/race of the head(s) of household, and household income, were adjusted for household size.
* Dairy beverages included milk, milkshakes, eggnogs, drinkable yogurts and kefir.
† PBB included, milk alternatives and plant-based kefir and drinkable yogurt.
‡ The second year listed is the reference year.
Differences in volumes purchased between groups
Differences between sociodemographic groups are shown in Tables 2–4. Overall, households residing in the province of Québec purchased more total dairy beverages, whole milk and soya beverages, while those in Ontario purchased more almond beverages and ‘other’ milk alternatives. Households with children under 6 years and aged 6–12 years (v. with no children <18 years of age) purchased more total dairy beverages, including whole milk (<6 years only), and less PBB, including almond beverages (<6 years only) and soya beverages (6–12 years only). Additionally, households with children of any age (v. with no children <18 years of age) purchased more dairy beverages with added sugars, and those with children aged 6–12 years (v. with no children <18 years of age) purchased less PBB with added sugars. Differences were also found by education level, as households with at least one head of household with a university degree (v. high school diploma) purchased less 2 % milk, but more PBB, including ‘other’ milk alternatives. Households with no head of household reporting a race or ethnicity other than White (v. at least head of household reporting a race or ethnicity other than White) purchased more skim milk and 1 % milk, but less whole milk. Finally, households with a head of household under 45 years (v. over 65 years) purchased more PBB, ‘other’ milk alternatives and dairy beverages with added sugars.
Price and location of purchase
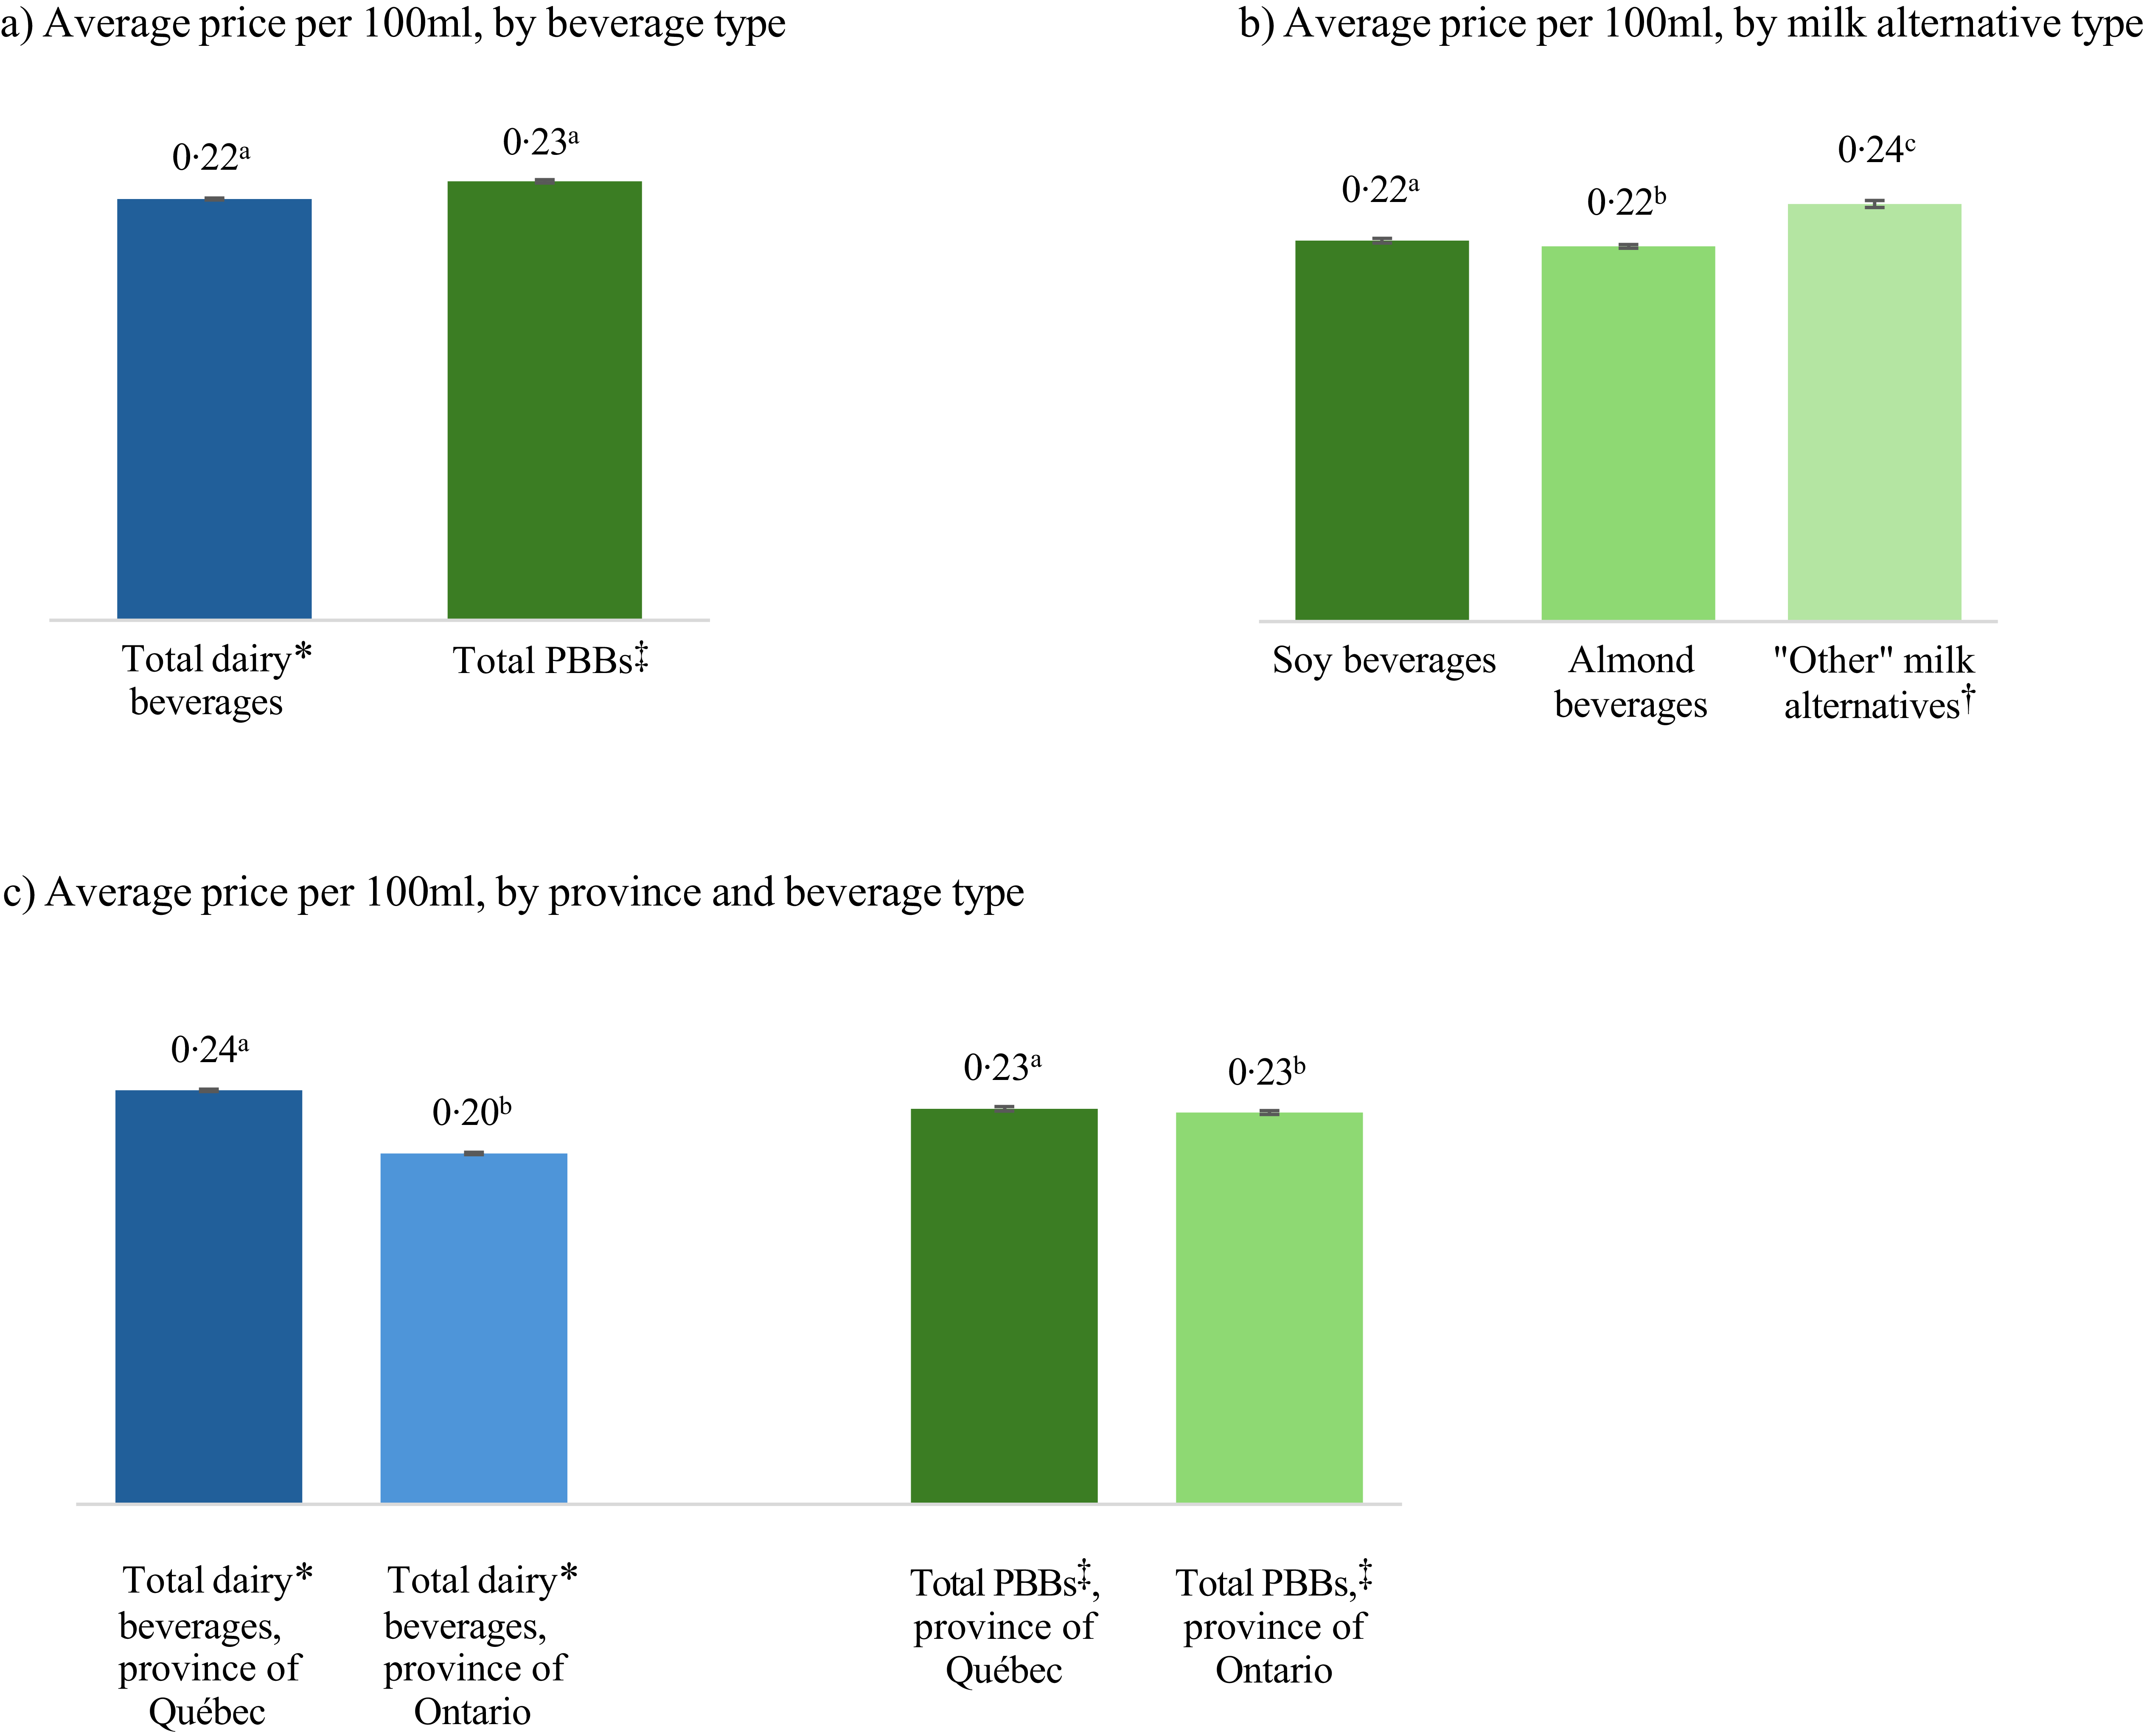
The most frequently purchased container size for dairy beverages was 4 litres (41·9 % of purchases), followed by 2 litres (20·9 %), while the most frequently purchased container size for PBB was 1·89 litres (55·2 %), followed by 946 ml (34·6 %). Overall, the difference in the price of PBB and dairy beverages purchased by panel households were not significantly different in adjusted linear regressions using the log-transformed variables (p = 0·288) (Figure 3). For the milk alternatives purchased, the adjusted model showed that the ‘other’ category was significantly more expensive per 100 ml than almond and soya beverages, and that the almond beverages were more expensive than soya beverages. However, these differences were small in absolute terms when comparing unadjusted mean prices ($0·24 CAD, 99 % CI 0·24, 0·25 for ‘other’ milk alternatives; $0·22 CAD, 99 % CI 0·22, 0·22, for both almond and soya beverages). In the adjusted models, the average prices were also significantly higher in Québec than in Ontario for dairy beverages, but were higher in Ontario for PBB, although unadjusted prices between provinces were relatively similar, especially for PBB.
Unadjusted average price paid per 100 ml of dairy beverages and plant-based beverages among a panel of households in Québec and Ontario, in $CAD. Different superscript letters denote significant differences (p < 0·01) based on linear regression models adjusted for year, presence of added sugars (binary variable), province (3a and 3b only) and retail of purchase. The average prices shown are weighted by purchase frequency. *Total dairy beverages included milk, milkshakes, eggnogs, drinkable yogurts and kefir. † ‘Other’ milk alternatives included cashew, oat, and rice beverages. ‡Total PBB included milk alternatives and plant-based kefir and drinkable yogurt. PBB, plant-based beverages.

Discussion
This study found that 2 % milk and almond beverages were the most purchased dairy beverages and PBB, respectively, and that price per 100 ml was similar for PBB and dairy beverages. Most PBB purchased were fortified with at least one vitamin or mineral, and proportionally more PBB contained added sugars, compared with dairy beverages. Significant differences were observed over time as well as across household sociodemographic characteristics.
Purchasing of dairy products
The most purchased milk by fat content, in all years, was 2 %, followed by 1 %, whole, and skim milk. In addition, annual purchases of skim, 1 % and 2 % milk (with and without added sugars) were lower in 2019 compared with 2018, while purchases of 2 % and whole milk increased from 2019 to 2020. These findings show poor alignment with CFG’s broad recommendation to favour lower-fat milk as skim and 1% milk were less popular than 2% milk, and purchases declined over time, while purchases of whole milk increased(6).
Similar to our study, recent commercial sales data in Canada showed a decline in lower-fat milk purchases and an increasing preference for higher-fat milk(20) which contrasts with the long-term decline in whole milk purchases observed over the past decades(Reference St-Pierre21). Consumers’ growing interest in whole milk may reflect low public awareness of CFG recommendations, notably regarding fats(Reference Ramuscak, Duncan and Ma22), or a preference for its taste(Reference Chi, Wang and He23). The ongoing scientific debate surrounding the impact of dairy saturated fat on cardiovascular health(Reference Lamarche, Astrup and Eckel24–Reference Pokala, Kraft and Taormina27) may also have influenced media portrayals of dairy products, public discourse and consumer behaviour. Further research is needed to examine the factors driving these shifting preferences.
Purchasing of plant-based beverages
This study found that nearly 90 % of PBB purchased by households in the panel were fortified, aligning with CFG’s recommendation on fortification. This is encouraging given that fortification of PBB is permitted, though not mandatory, in Canada(17), and may help PBB consumers meet some of their nutrient requirements. However, almond beverages, which have low levels of protein and essential amino acids(Reference Smith, Dave and Hill15), were the most purchased plant-based milk alternative, followed by soya beverages and other types of milk alternatives. Other studies have also shown a preference for almond beverages by consumers(Reference Wolf, Malone and McFadden28,Reference Schiano, Nishku and Racette29) . Lack of knowledge about the nutrient content of plant-based milk alternatives(Reference Fifi, Pagan and Chakraborty30,Reference Soczynska, Da Costa and O’Connor31) and concerns surrounding soya and hormone dysregulation (i.e. phyto-oestrogen)(Reference Schiano, Nishku and Racette29) could explain why the high-protein choice (i.e. soya) is less preferred. In Canada, PBB that contain low amounts of high-quality protein, such as almond beverages, must carry a statement declaring ‘Not a source of protein’(17). Although no study has examined whether consumers notice or use this statement, promoting this information or making it more prominent could help those trying to substitute milk choose a product with a similar protein content. In addition, a 2022 report on product availability in Québec grocery stores showed a greater diversity of nut-based (including almond) and oat-based plant-based milk alternatives compared with soya-based beverages(14). This may prompt consumers to purchase nut-based products but may also reflect the industry’s response to their preferences. The introduction of new beverages, such as oat beverages(Reference Ramsing, Santo and Kim32), may also have encouraged consumers to transition away from traditional alternatives like soya.
Our findings also demonstrate that purchases of total PBB, and more specifically of almond and other types of milk alternatives, increased between 2019 and 2020, but no significant changes were observed for soya beverages. From an environmental perspective, and given CFG’s emphasis on sustainability, the growing popularity of PBB is encouraging, although purchases remain far below those of dairy products. The central role that milk has played in Canadian diets and dietary guidelines for decades(4), its embedding in social norms(Reference Lacroix, Desroches and Turcotte33), significant advertising investments(Reference Potvin Kent, Pauzé and Bagnato34) and importance to the Canadian economy(35), likely all contribute to this large gap between dairy and non-dairy products.
Purchasing of dairy beverages and plant-based beverages with added sugars
The mean sugar content per 250 ml of purchased beverages was higher in total dairy beverages than in total PBB; however, comparisons of sugar content between beverage categories should be done with caution, as lactose accounts for a large proportion of total sugar in dairy beverages (i.e. 12–13 g per 250 ml in milk). Opposite trends were observed for beverages with added sugars, with a decrease in purchasing of dairy beverages with added sugars between 2018 and 2019, in line with CFG’s recommendation to favour unsweetened beverages, and an indication of an increase, though not significant, in purchases of sweetened PBB between 2019 and 2020. In addition, nearly half of PBB purchased by households contained added sugars, whereas most dairy beverages did not. Overall, the preferred and familiar taste of milk may act as a facilitator for plain milk consumption(Reference Lacroix, Desroches and Turcotte33,Reference Laila, Topakas and Farr36) , whereas the taste of plant-based milk alternatives, which has been identified as a barrier to consumption(Reference Laila, Topakas and Farr36,Reference Sottile, Massaglia and Merlino37) , may drive consumers to sweetened and flavoured options(Reference Jaeger, Dupas De Matos and Frempomaa Oduro38,Reference Lawrence, Lopetcharat and Drake39) . The mandatory FOP labelling regulations in Canada(19) could further support informed decision-making by helping consumers identify products with total sugar content below the 15 g per 250 ml threshold and may also encourage industry reformulation. This study did not examine the presence of non-nutritive sweeteners.
Sociodemographic differences
Differences by sociodemographic characteristics were also observed. First, households with children purchased larger amounts of total dairy beverages, whole milk and dairy beverages with added sugars, and less PBB, including almond beverages. The Canadian Paediatric Society recommends introducing 3·25 % milk between 9 and 12 months when breast-feeding is no longer possible and does not recommend plant-based alternatives as a breast milk substitute(40). Therefore, parents with young children at home may prefer whole milk and maintain this behaviour beyond infancy, even though CFG recommends lower-fat milk for children over 2 years of age(41). Children’s preference for sugary drinks(Reference Sylvetsky, Visek and Halberg42) may also lead parents to buy sweetened dairy beverages. Households with a younger head of household and with higher education, characteristics that have been associated with pro-environmental and animal welfare concerns(Reference Meyer43,Reference McKendree, Croney and Widmar44) , tended to purchase more PBB, consistent with previous research(Reference Boaitey and Minegishi45). In addition, households with at least one head of household reporting a race or ethnicity other than White purchased more whole milk and less lower-fat milk. The underlying reasons for these differences remain unclear, but cultural traditions and preferences may be a contributing factor. Promoting the 2019 CFG recommendations, particularly among the aforementioned groups, could increase overall adherence.
Price
Overall, PBB and dairy beverages purchased by this panel had similar prices, which contrasts with the average retail prices observed in Québec(Reference Robitaille and Zarnovican46) and other countries(Reference Stewart, Kuchler and Cessna10,Reference Nowson, Fallaize and Earl11,Reference Smith, Dave and Hill15) . These discrepancies may be due to the purchasing habits of this panel as, for example, dairy beverages were more frequently purchased in larger containers than PBB. While previous research has shown that demand for milk alternatives, and to a lesser extent for milk, is elastic(Reference Slade and Markevych47) our results suggests that price differences between PBB and dairy beverages were minimal, and thus may have had limited impact on the purchasing patterns identified among this panel. In addition, the price variations of dairy products between Québec and Ontario may reflect differences in purchasing habits, but also in regulatory frameworks: Québec sets both minimum and maximum retail prices for some milk(48), while Ontario does not regulate retail prices(49). However, this study did not consider other factors that may have affected the financial accessibility of these beverages for households, such as rural living location.
Strengths and limitations
Household purchase data have several strengths. First, UPC and product descriptions allowed branded products to be identified and linked to product-specific nutritional information, reducing potential reporting errors encountered in other dietary assessment methods(50). In addition, because data included annual purchases, seasonality was not an issue compared with assessment methods that only capture one point in time such as a single 24-h food recall(50). Finally, there have been no new national survey data since 2015 in Canada, which limits the ability to assess more recent changes in dietary patterns among Canadians. Our analysis therefore allowed for an assessment of more recent trends in dairy beverages and PBB purchases, including changes following the release of the 2019 CFG.
Household data also have several limitations. First, since the data capture purchases rather than actual consumption, it does not provide insight into which household members consumed the beverage or whether it was fully consumed or wasted(50) and apparent consumption of dairy beverages and PBB may have been overestimated. Purchases made away from home, such as in restaurants, bars and institutions (e.g. hospital or school cafeterias), were also not included in our dataset, which could have led to an underestimation of purchases. Second, data from the provinces of Québec and Ontario may not be representative of the rest of Canada as dairy products consumption varies across the country(Reference Jones, Kirkpatrick and Hammond51). Additionally, the sample was not weighted by ethnicity or education level, which may limit the generalisability of the results. Third, because there was no control group in this study, the changes observed over time cannot be directly linked to the release of the 2019 CFG. Indeed, these trends may reflect shifts in food production, marketing practices, supply chain dynamics and other non-measured contextual factors. They may also reflect the impact of the COVID-19 pandemic, which has been associated with increased dairy products sales at retailers(Reference Weersink, Von Massow and McDougall52), likely due to people eating more at home(Reference Goddard53). Changes in purchasing habits, such as purchase location and container size, may also have been influenced by the COVID-19 pandemic. Fourth, although purchase data are a reliable way of estimating food consumption(Reference Vepsäläinen, Nevalainen and Kinnunen54,Reference De Oliveira, De Moura Souza and Levy55) , price accuracy has been shown to be lower(Reference Einav, Leibtag and Nevo56). Therefore, the price results must be interpreted with caution.
Other limitations should be noted regarding the nutritional data collection. First, household purchases were recorded between 2018 and 2020, while nutritional information was collected between 2022 and 2024, after the announcement of the impending FOP policy in July 2022, but prior to full implementation in January 2026. Given that policies such as FOP labelling can incentivise reformulation(Reference Roberto, Ng and Ganderats-Fuentes57), the nutritional composition of products at the time of purchase may differ slightly from the information available in our dataset and thus may represent more conservative sugar content estimates. Additionally, the nutrition information available for foods online may differ from information available on packages.
Conclusion
This study showed a decrease in purchases of skim, 1 % and 2 % milk between 2018 and 2019 as well as an increase in purchases of 2 % and whole milk between 2019 and 2020, showing poor alignment with the CFG’s recommendation to favour lower-fat milk. The decrease in dairy beverages with added sugars is, however, promising, and the small increase in total PBB purchases is consistent with the 2019 CFG’s emphasis on sustainability, although high-protein plant-based milk alternatives remained the least popular. Promoting high-protein, unsweetened, fortified PBB, as well as lower-fat milk, especially among certain population subgroups, may help increase consumption of these products and adherence to the 2019 CFG.
Supplementary material
For supplementary material/s referred to in this article, please visit https://doi.org/10.1017/S0007114526108149
Data availability statement
Due to the terms of our data access agreement, we cannot share data. However, data can be obtained directly from NielsenIQ.
Acknowledgements
The authors would like to thank statistician Julien Miron for his analytical support.
Author contributions
Virginie Drolet-Labelle: Conceptualisation-Equal, Formal analysis-Equal, Methodology-Equal, Software-Lead, Writing – original draft-Lead, Writing – review and editing-Lead; Jennifer J. Lee: Conceptualisation-Supporting, Methodology-Supporting, Supervision-Supporting, Writing – original draft-Supporting, Writing – review and editing-Supporting; Véronique Provencher: Conceptualisation-Supporting, Methodology-Supporting, Supervision-Supporting, Writing – original draft-Supporting, Writing – review and editing-Supporting; Lana Vanderlee: Conceptualisation-Equal, Methodology-Equal, Supervision-Lead, Writing – original draft-Supporting, Writing – review and editing-Supporting.
Financial support
The research was supported by the Canadian Foundation for Innovation John R. Evans Leaders Fund (LV), Canada Research Chairs programme (LV), and Fonds de recherche du Québec–Santé (VDL).
Competing interests
None to declare.
Ethical standards
Ethical approval was not required as the data were obtained in anonymised format.


 Open access

