Introduction
Unalloyed titanium (Ti) is normally referred to as commercially pure (CP) Ti which contains a small amount of interstitial elements.[Reference Lutjering and Willams1–Reference Conrad3] CP-Ti has four grades, Grades 1–4. They have excellent ductility, specific strength, and biocompatibility, used in a variety of industries such as chemical processing, biomedical, aerospace, and offshore drilling. Grade 7 Ti alloy is a variant of CP-Ti mildly alloyed with palladium (Pd; 0.12–0.25 wt.%) for improved resistance to corrosion, especially in oxidizing Cl− solutions.[Reference Brossia and Cragnolino4] A similar alloying element for Ti is ruthenium (Ru), which is introduced to CP-Ti in the range of 0.08–0.14 wt.%[Reference Schutz5] and to biomedical β-Ti alloys up to 2.6 wt.%.[Reference Biesiekierski, Ping, Yamabe-Mitarai and Wen6] Altogether CP-Ti and Grade 7 Ti products account for ~25% of the overall Ti market, and they continue to draw much attention from a research perspective.[Reference Yan, Luo, Schaffer and Qian7–Reference Yan, Dargusch, Ebel and Qian9]
Both oxygen and iron are common impurities in CP-Ti and Grade 7 Ti with different specifications.[Reference Lutjering and Willams1–Reference Conrad3] As for Fe, Grades 4 and 7 Ti are allowed to contain up to 0.5 wt.% Fe and 0.3 wt.% Fe, respectively.[10] Fe is a potent β stabilizer and therefore is an important alloying element for designing high-strength Ti alloys.[Reference Liu, Chen, Tang, Liu, Liu and Huang11, Reference Yan, Liu, Schaffer and Qian12] It can noticeably affect the microstructure of CP-Ti materials even at a trace level, e.g., 1280 ppm.[Reference Yan, Luo, Schaffer and Qian8, Reference Simbi and Scully13] Regarding the Grade 7 Ti, although its superior resistance to corrosion in Cl−-containing environments has been well established, the existing form of Pd in the alloy remains controversial, with claims of Pd being present in Pd–O surface oxides[Reference Lutjering and Willams1] or being associated with β-Ti.[Reference Zhu, Qin, Noël, Shoesmith and Ding14]
In the present study, both as-received (cold-rolled) and heat-treated Grade 4 CP-Ti and Grade 7 Ti have been investigated in detail, using Grade 1 Ti as a point of reference. Heat treatment of cold-rolled Ti materials can enhance ductility to achieve desired strength–ductility combinations.[Reference Polyakov, Semenova, Valiev, Huang and Langdon15–Reference Mittemeijer and Mittemeijer18] It was found that after annealing at 1000 °C, Grade 1 CP-Ti showed evident grain growth in its α phase but unusual phenomena were observed in Grade 4 CP-Ti and Grade 7 Ti: (a) significant α-phase growth confinement occurred in Grade 4 CP-Ti and (b) substantial β-phase refinement occurred in Grade 7 Ti, when compared with the microstructures prior to annealing. The mechanisms for each observation were identified through comprehensive microstructural studies and phase diagram analyses. In addition, the existing form of Pd in the Grade 7 Ti alloy was determined.
Experimental
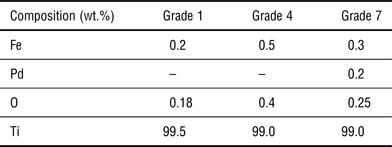
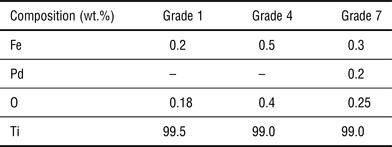
The chemical compositions (Fe, Pd, and O) of the cold-rolled bars of Grades 1, 4, and 7 Ti are listed in Table I, satisfying respective ASTM specifications. Samples of each Ti material was annealed in a differential scanning calorimeter (DSC; Netzsch) at 1000 °C for 30 min in a high-purity argon flow (20 ml/min), followed by furnace cooling (cooling rate was ~10 °C/min).
Compositions of the Ti materials studied (Grades 1, 4, and 7). Impurity levels of other elements such as N and C are not listed.
The microstructures of the as-received (cold-rolled) and as-annealed samples were analyzed using optical microscopy (OP; Leica), scanning electron microscopy (SEM; JEOL 7001), and transmission electron microscopy (TEM; Philips Gatan F20, 200 kV). A focused ion beam (FIB; XT Nova Nanolab 200) using a Ga source was used to prepare TEM samples. The beam current was applied in a step-down fashion to progressively remove any damaged layer from previous operations and to minimize beam damage.[Reference Yan, Qian, Kong and Dargusch19] The composition was analyzed using energy-dispersive x-ray spectroscopy [EDX; Si(Li) detector; standardless] attached to the TEM. The average grain size of each sample was determined from measuring 200 grains.
Results
Figures 1(a) to 1(f) compare the microstructural differences between the cold-rolled and as-annealed Grades 1, 4, and 7 Ti. Fig. 1(g) summarizes the average grain size of each material. The results show that:
• The grain size of the as-annealed Grade 1 increased markedly after annealing at 1000 °C [see Figs. 1(a), 1(b), and 1(g)]. The same observation occurred to the α-Ti phase in the as-annealed Grade 7 Ti as well [Figs. 1(e), 1(f), and 1(g)].
• In contrast, there was significant α-Ti phase growth confinement in the as-annealed Grade 4 CP-Ti whose grain size (of α-Ti phase) remained almost the same as the cold-rolled material [Figs. 1(c), 1(d), and 1(g)].
Optical microstructures of the as-received (cold-rolled) and as-annealed CP-Ti materials: (a) and (b) for Grade 1, (c) and (d) for Grade 4, (e) and (f) for Grade 7. The as-annealed CP-Ti shows evident α phase growth except Grade 4. (g) summarizes the average grain size of the α-Ti phase in these CP-Ti materials.

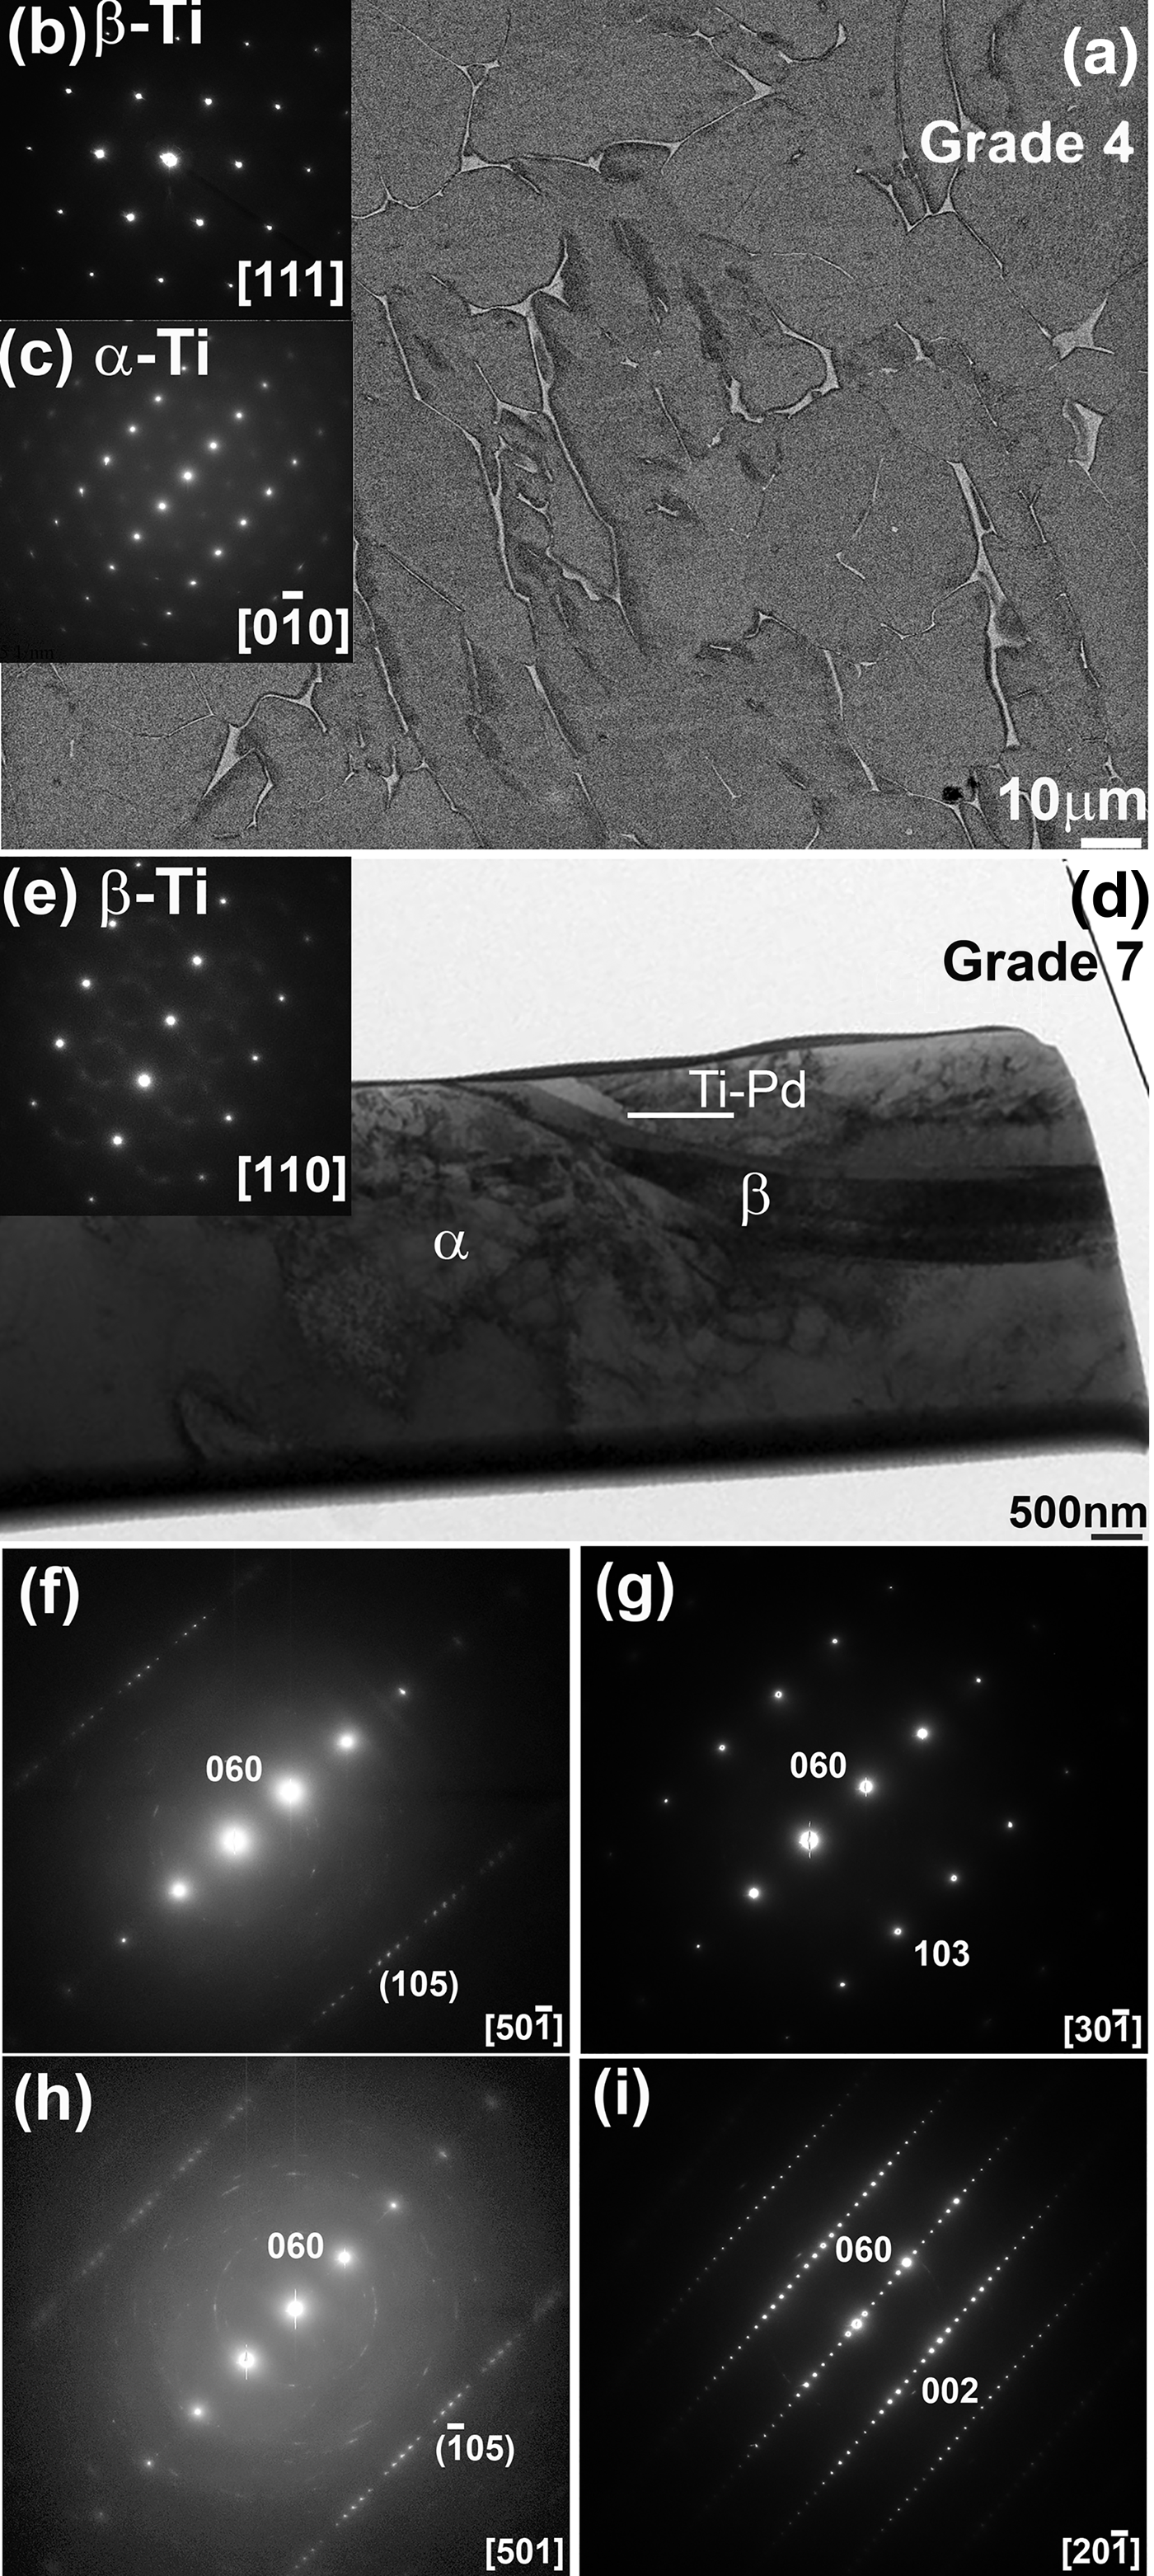
Figure 2(a) reveals that there are extensive secondary phases existing in the grain boundary (GB) areas of the cold-rolled Grade 4 CP-Ti. These secondary phases may have inhabited GB movement serving as the underlying reason for the grain growth confinement observed in the as-annealed Grade 4 CP-Ti. They were identified as Fe-stabilized β-Ti phases. A typical TEM SAED of this phase is shown in Fig. 2(b) along with a TEM SAED pattern from the α-Ti matrix [Fig. 2(c)]. TEM–EDX results exploring the phase constitution are shown in Fig. 3(f).
(a) SEM–BSE image showing the Fe-stabilized β phase in the GB area of the as-received (cold-rolled) Grade 4 CP-Ti, (b) TEM–SAED patterns from an Fe-stabilized β phase, (c) TEM–SAED pattern from an α-Ti phase, (d) TEM bright-field image and (e) corresponding SAED pattern for the Fe-stabilized β phase in the as-received (cold-rolled) Grade 7 Ti, and (f) SAED patterns of the orthorhombic phase (Ti88Pd9Fe3 in at.%) occasionally observed in the cold-rolled Grade 7 Ti.
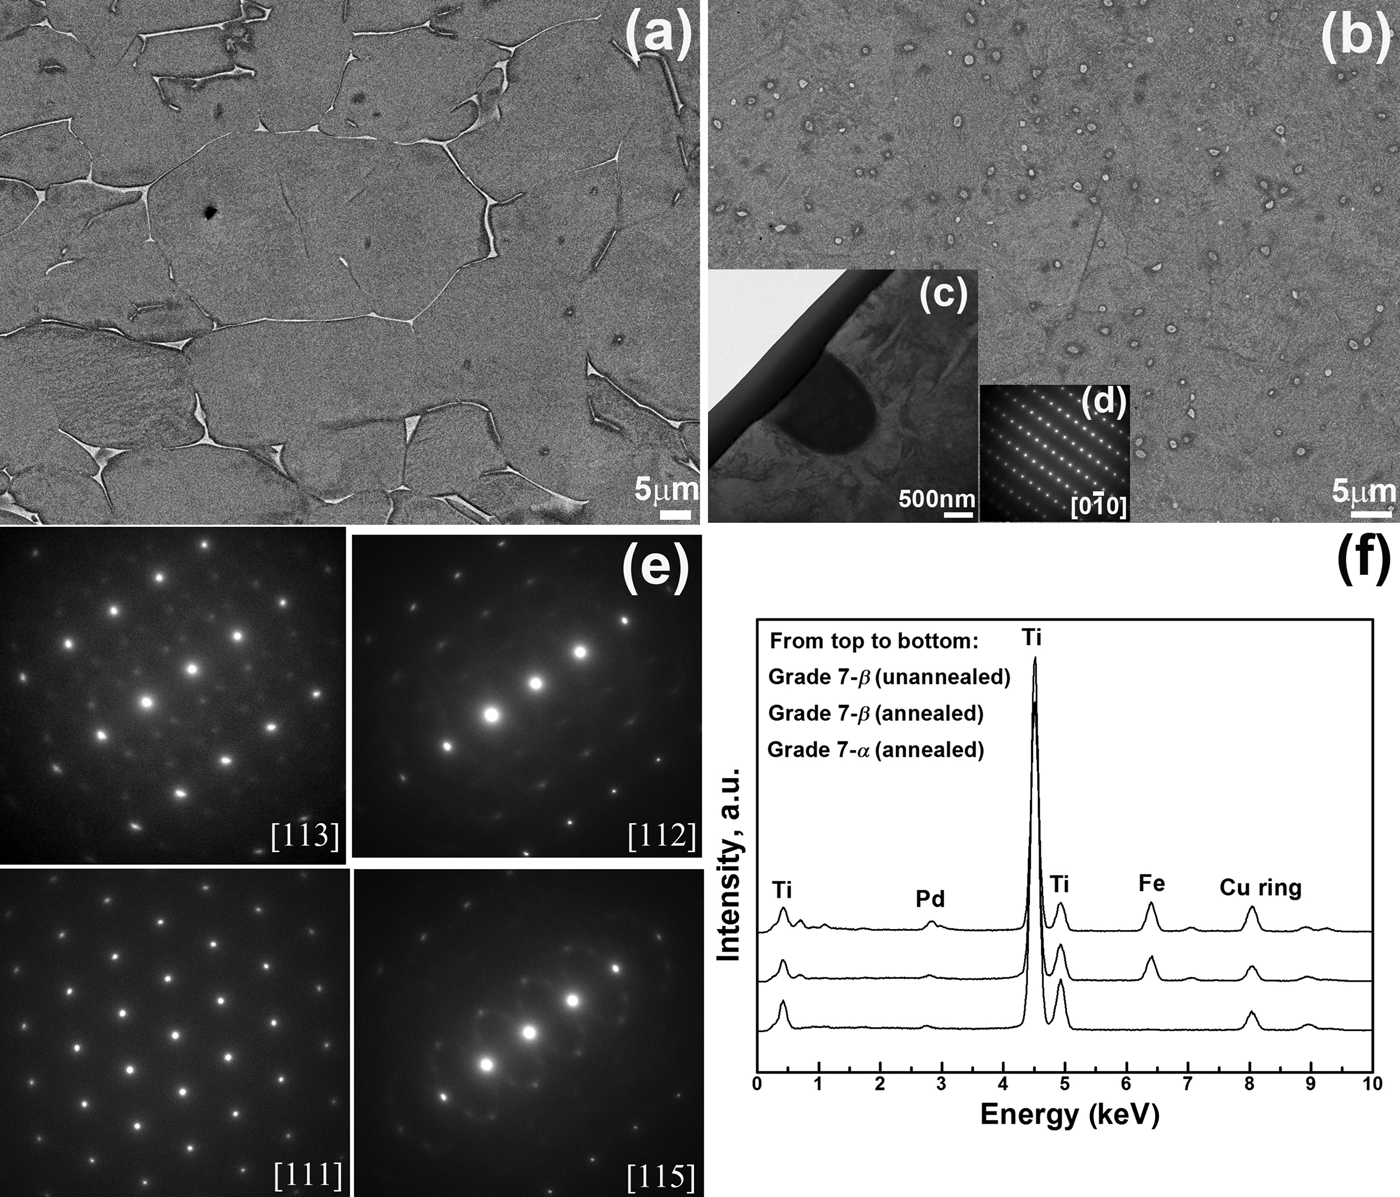
SEM–BSE images comparing the β phase in the (a) as-received (cold-rolled) and (b) as-annealed Grade 7 Ti, (c) a TEM bright-field image for the β-Ti phase particle, (d) an SAED pattern for the surrounding α-Ti grain, (e) a series of SAED patterns for the β-Ti phase in the as-annealed Grade 7 Ti, and (f) comparison of the TEM–EDX results indicating a lowered concentration of both Pd and Fe in the as-annealed Grade 7 Ti.
Fe-stabilized GB β-Ti phases were also observed in the cold-rolled Grade 7 Ti alloy. Figures 2(d) and 2(e) present a TEM bright-field image of one such Fe-stabilized β-Ti phase and the corresponding SAED pattern, respectively. TEM–EDX results suggest that the phase contained Pd in the range of about (2–4 at.%). Electron diffractions of another type of Pd-containing phase (~Ti88Pd9Fe3 in at.% as measured by TEM–EDX), observed only occasionally in the cold-rolled microstructure, are presented in Figs. 2(f) and 2(i). These SAED patterns suggest that this Ti88Pd9Fe3 phase has a relatively large lattice parameter along its b-axis and appears to be an orthorhombic phase with a ≈ 3.7 Å, b ≈ 15.0 Å, and c ≈ 5.2 Å, making it close to the Ti2Pd3 intermetallic phase in terms of the crystal structure.[Reference Krautwas, Bhan and Schubert20–Reference Sokolovskaya, Loboda and Makanov22] These two Pd-containing phases are, however, different in phase constitution. Ti2Pd3 is an uncommon phase at room temperature according to the Ti-rich Ti–Pd binary phase diagram [see Fig. 4(a)[Reference Murray and Murray23]].
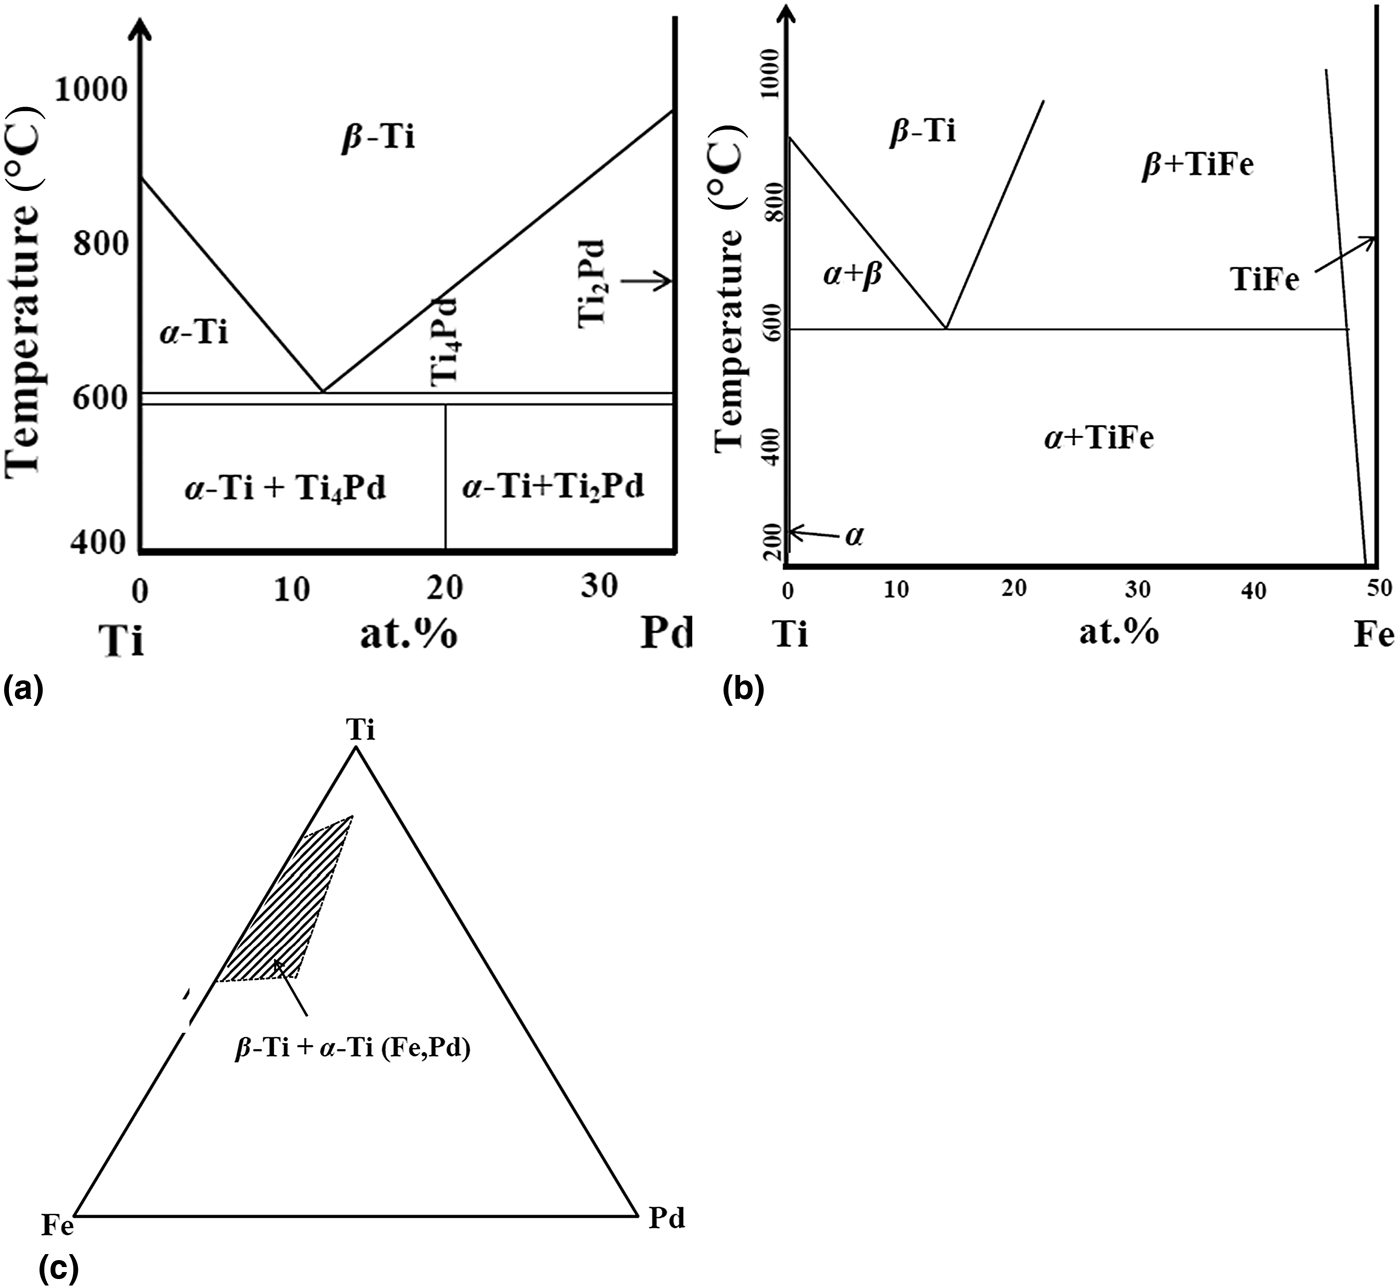
Schematic phase diagrams: (a) Ti–Pd diagram up to 33 at.% Pd, (b) Ti–Fe diagram up to 50 at.% Fe and (c) the isothermal section of the ternary Ti–Fe–Pd phase diagram at 800 °C, showing that there is a region where Fe-stabilized and Pd-containing β-Ti can co-exist with α-Ti containing a small amount of Fe and Pd at 800 °C.
Aside from the significant grain growth confinement observed in the Grade 4 CP-Ti, another notable feature observed from the as-annealed microstructures of Grades 4 and 7 Ti is the much reduced grain size of the β-Ti phase in the Grade 7 Ti. Figure 3 compares the microstructures of the Grade 7 Ti before [Fig. 3(a)] and after annealing [Fig. 3(b)]. The tens of micrometers long, Fe-stabilized β-Ti phases (up to ~40 µm) are reduced to (1–2 µm) round particles. Figure 3(c) presents a TEM bright-field image of one such β-Ti phase particle. The surrounding matrix remains to be α-Ti, Fig. 3(d). The β-Ti phase retains its crystal structure after annealing, with typical SAED patterns shown in Fig. 3(e). The additional diffraction features in the SAED patterns in Fig. 3(e) are associated with the ω phase.[Reference Yan, Luo, Schaffer and Qian8, Reference Yan, Liu, Liu, Kong, Schaffer and Qian24]
Figure 3(f) summarizes the TEM–EDX results of the β phases (annealed and cold-rolled) and the α phase (annealed) in the Grade 7 Ti alloy. The β phase prior to annealing contained a high amount of both Pd (~4 at.%), and Fe (~12 at.%), while after annealing a decrease in the concentration of both Pd (down to ~0.6 at.%) and Fe (down to ~8.0 wt.%) was detected, implying solute redistribution of Pd and Fe away from the β-Ti phase during annealing. This is confirmed by the observation that a small amount of Pd was detectable in the surrounding α-Ti matrix (~0.1 at.%) in the as-annealed Grade 7 Ti, while no Pd was detected prior to annealing. As will be shown below, this is the reason for the much reduced grain size of the β-Ti phase in the Grade 7 Ti after annealing.
Discussion
The three primary experimental findings of this study are:
(a) Grain growth of the α-Ti phase in the cold-rolled Grade 4 CP-Ti during annealing at 1000 °C was significantly confined by the Fe-stabilized GB β-Ti phase;
(b) The grain size of the β-Ti phase in the cold-rolled Grade 7 Ti showed a substantial reduction after annealing at 1000 °C; and
(c) Pd generally exists in two different forms in the annealed Grade 7 CP-Ti and both forms of distribution are closely associated with Fe.
Regarding Point (a), the underlying reasons are:
(i). Although Fe has a significant solubility in β-Ti,[Reference Lutjering and Willams1–Reference Conrad3] its solubility in α-Ti is trivial.[Reference Matyka, Faudot and Bigot25] A recent study[Reference Yan, Luo, Schaffer and Qian8] indicated that the presence of 1280 ppm (0.128 wt.%) of Fe is sufficient to lead to the precipitation of Fe-stabilized β phase at the α-Ti GBs, although this is well below the corresponding ASTM specification (0.2 wt.% Fe).
(ii). Fe is a eutectoid alloying element for Ti [see Fig. 4(b)[Reference Murray and Okamoto26]] and has a negligible solubility in α-Ti at the eutectoid temperature (0.0385 wt.% at 568 °C[Reference Murray and Okamoto26]). Hence, each CP-Ti material is fundamentally a hypereutectoid Ti–Fe alloy. However, the assumed eutectoid reaction (β → α + TiFe) has rarely been observed even in the eutectoid Ti–Fe alloy subjected to furnace cooling, due to the sluggish eutectoid reaction rate involved.[Reference Yan, Qian and Froes27]
These two facts explain why the only other practical way for the extra impurity Fe to exist in the room-temperature microstructure of CP-Ti is to form Fe-stabilized β phases. Assuming the Fe impurity in CP-Ti all participates in the formation of the β phase, it could lead to an estimated volume fraction of ~6% of the β phase based on both the compositional information in β-Ti (~7 at.% Fe as measured by TEM–EDX) and image analysis. According to the particle-pinning model (R = K•r/f, where f is the volume fraction of the pinning phase and R is the average radius of grain),[Reference Moelans, Blanpain and Wollants28] the grain size is adversely proportional to the volume fraction of the secondary phase particles. In this regard, having an increased presence of β-Ti phase particles in CP-Ti through adjusting the Fe impurity level is expected to help restrict α-phase growth during the subsequent heat treatment.
Regarding Point (b), the major difference between the Grade 4 CP-Ti and Grade 7 Ti alloy is that the latter contains Pd. As indicated by TEM–EDX, Pd was associated with Fe in the Fe-stabilized β phase [Fig. 3(f)]. It is noticed from the isothermal section of the Ti–Fe–Pd ternary phase diagram at 800 °C, shown in Fig. 4(c)[Reference Okamoto and Okamoto29] that there is a stage where β-Ti can co-exist with α-Ti. This suggests that reactions like β-Ti (containing higher Fe and Pd) → β-Ti (Fe-stabilized) + α-Ti (containing lower Fe and Pd) may have occurred in the Grade 7 Ti alloy during annealing. Such reactions involve redistribution of Pd and Fe away from high temperature β-Ti phases into a mixture of β-Ti and α-Ti phases at lower temperatures. We propose that this solute redistribution enabled the original Fe-stabilized β phases in the cold-rolled Grade 7 Ti alloy to decompose into two phases of finer grain sizes, consistent with the microstructures observed (Figs. 1 and 3). In particular, it is noted that in the absence of Pd, the Fe-stabilized β-Ti phase persisted to room temperature without the expected β → α transformation at ~882 °C; see Fig. 1 for the results obtained from Grades 1 and 4 CP-Ti samples. This is in contrast to the case of the Grade 7 Ti alloy, further highlighting the key role of Pd in enabling the β-Ti phase refinement through the proposed mechanism.
The last point is about the existing form of Pd in the annealed Grade 7 Ti alloy. We have shown that the presence of Pd is closely associated with Fe in the Grade 7 Ti alloy, existing either in the Fe-stabilized β-Ti phase or as a Ti–Fe–Pd intermetallic phase in addition to a small presence in the α-Ti matrix. The specification for the Grade 7 Ti alloy allows a maximum of 0.3 wt.% Fe. This study has thus raised a stimulating question, i.e., what will happen to the distribution of Pd in the Grade 7 Ti alloy if the alloy is made to be essentially Fe-free. This may affect the corrosion resistance of the Grade 7 Ti. Detailed study is needed in that regard.
Conclusions
• When the impurity Fe is adequately present in CP-Ti (e.g., 0.5 wt.% in Grade 4 CP-Ti), the growth of the α-Ti grains can be significantly confined during annealing even at 1000 °C by the pinning effect from the Fe-stabilized, GB β-Ti phases. However, such confinement effects are not observed in Grade 1 CP-Ti which contains a low level of Fe (0.2 wt.%) due to the lack of formation of sufficient Fe-stabilized, GB β-Ti phases.
• The grain size of the Fe-stabilized β-Ti phase in the Grade 7 Ti alloy can be markedly reduced by annealing, from tens of microns (up to ~40 µm) before annealing to 1–2 µm after annealing. Redistribution of Fe and Pd (Pd in particular) from the Fe-stabilized β-Ti phase (containing a high concentration of both Fe and Pd) is responsible for the substantial refinement of the Fe-stabilized β-Ti phase.
• Pd in the as-received (cold-rolled) Grade 7 Ti alloy exists mainly in the Fe-stabilized β-Ti phase. A small percentage of Pd can also be found in an occasionally observed orthorhombic Ti88Pd9Fe3 phase which is close to the Ti2Pd3 intermetallic phase in terms of crystal structure. The distribution of Pd is closely associated with Fe in the Grade 7 Ti alloy.
Acknowledgment
M.Y. acknowledges the support of a JSPS Fellowship (Invitation, Short Term).